Model Gateway dashboard
The Model Gateway dashboard provides visibility into the traffic flowing through your gateway. Use it to monitor request volume, track token consumption, and identify errors across your workspace.
You can open the dashboard from Model Gateway > Dashboard.
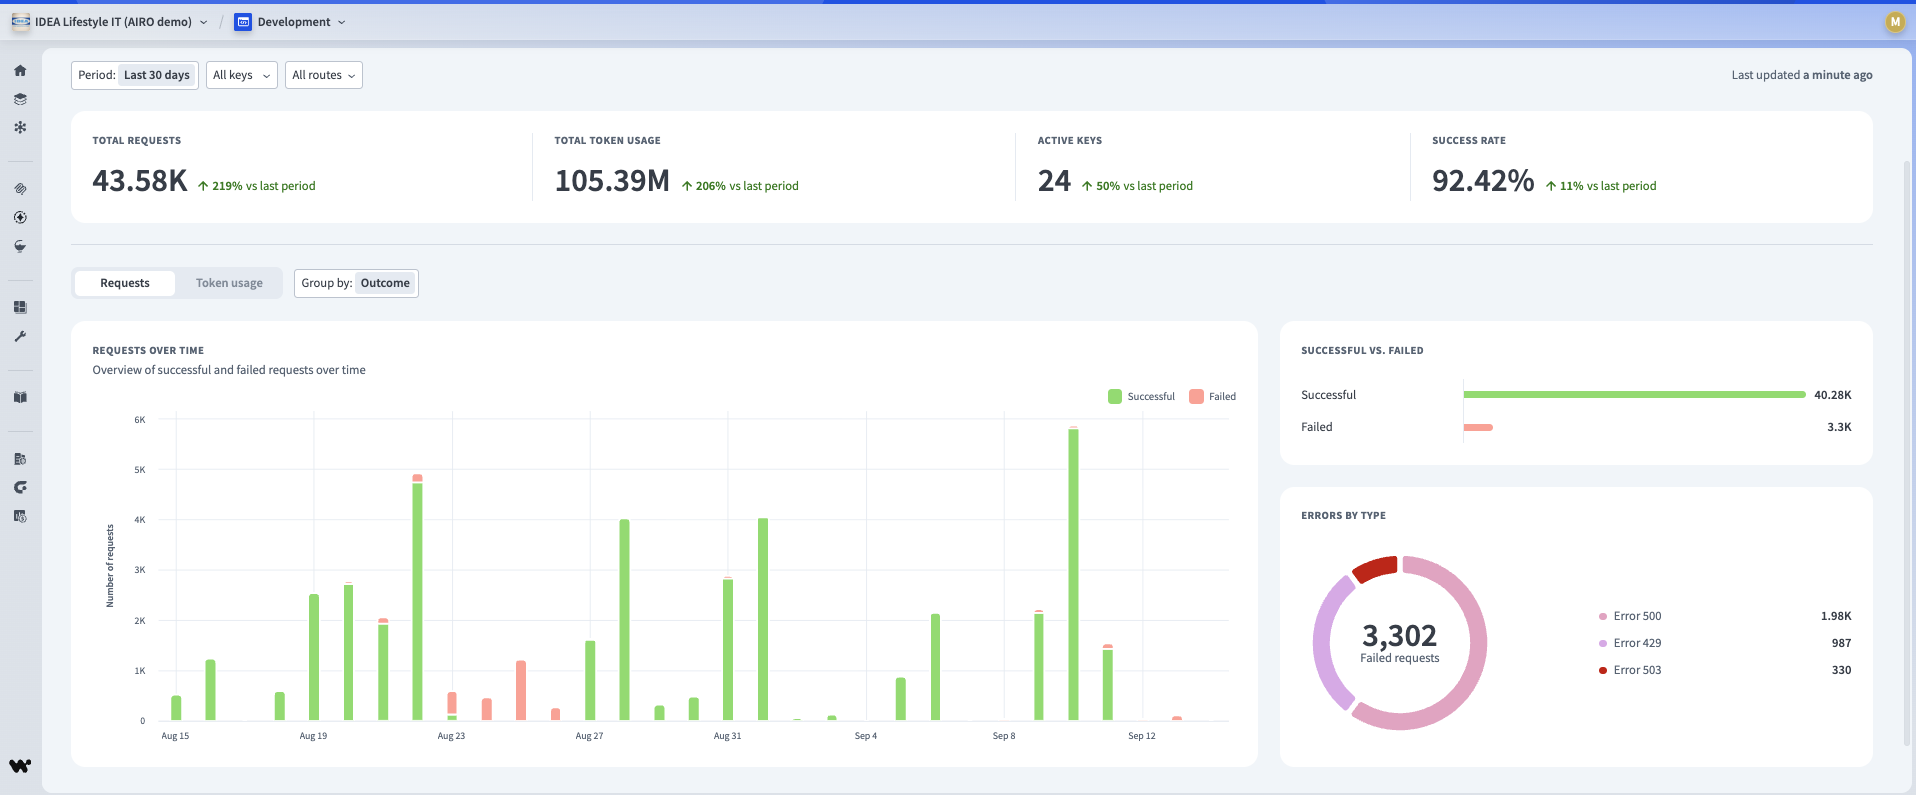 Model Gateway dashboard
The dashboard is scoped to the current workspace. Use the Period filter to set the time range for the metrics displayed. The Last updated timestamp shows when Model Gateway last refreshed the data.
Summary metrics
The dashboard header displays the following for the selected time range:
- Total requests this period: The number of requests that passed through the gateway.
- Total token usage this period: The number of tokens consumed across all requests.
- Active keys: The number of access keys issued.
- Success rate: The percentage of requests that succeeded.
Requests
The Requests view charts request activity across the selected time range. Use the Group by drop-down menu to group the data by outcome, model, provider, or route.
This view includes the following panels:
- Requests over time: An overview of successful and failed requests across the selected time range.
- Successful vs. failed requests: A count of successful and failed requests.
- Errors by type: A breakdown of failed requests by error type.
Token usage
Click Token usage to switch from request activity to token consumption. Use the Group by drop-down menu to group the data by type, model, provider, or route.
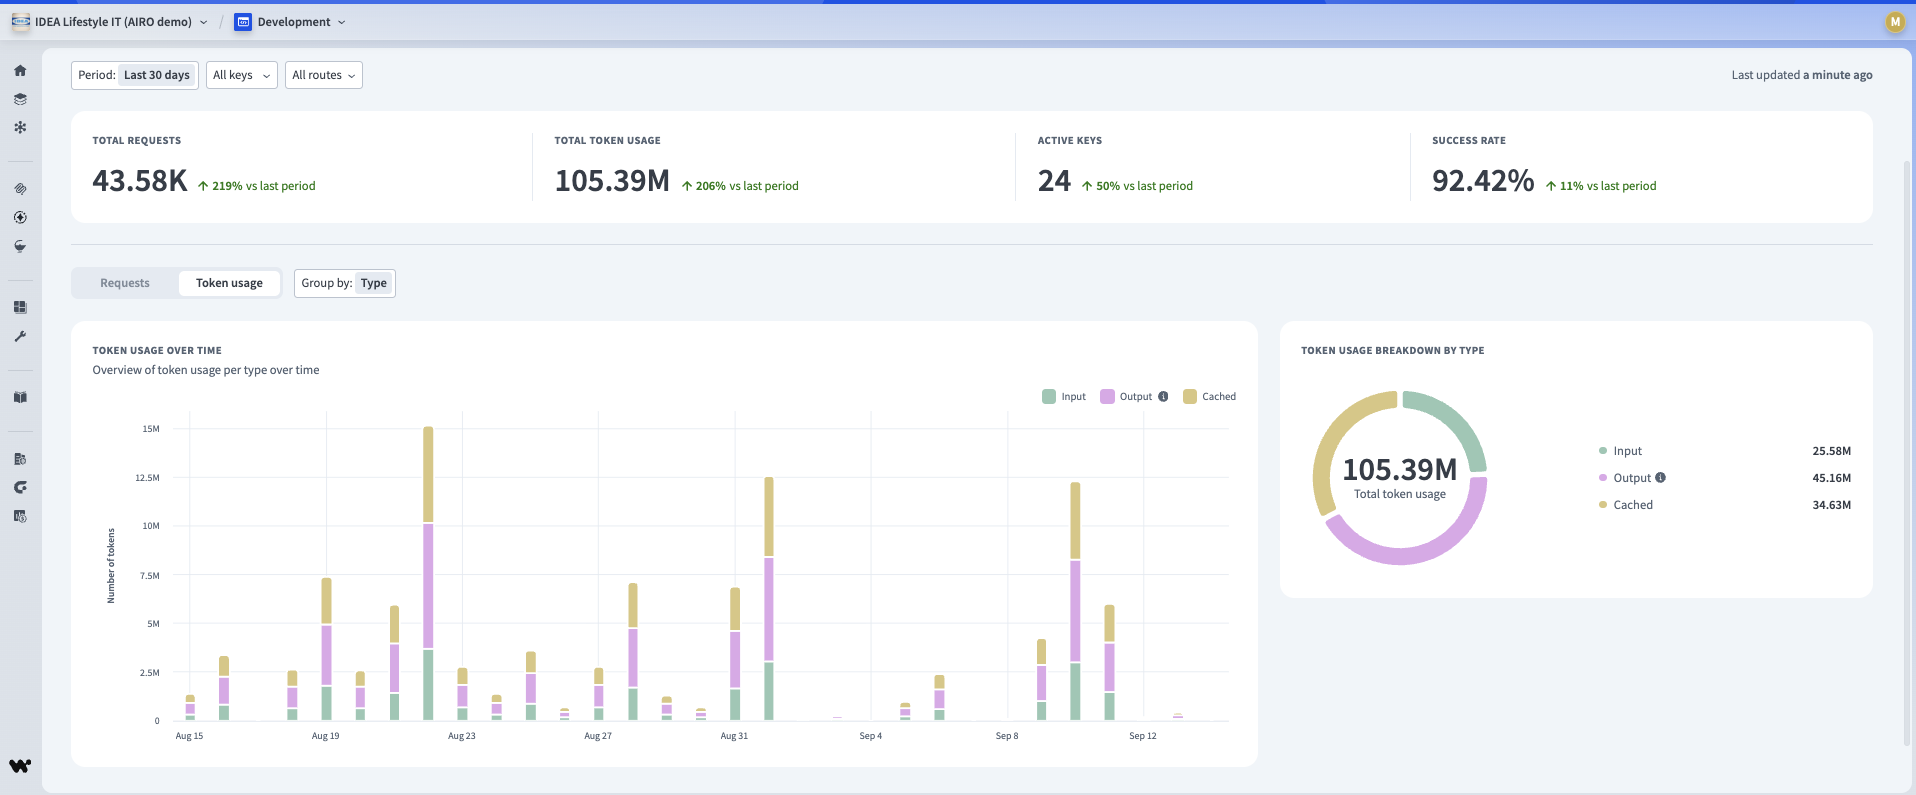 Model Gateway dashboard token usage
This view includes the following panels:
- Token usage over time: An overview of token usage by type (input, output, and cached) across the selected time range.
- Token usage breakdown by type: A count of input, output, and cached tokens, and their share of total token usage.
Output token counts include reasoning and thinking tokens.
Last updated: