OpenTelemetry trace streaming
OpenTelemetry (OTel) trace streaming sends traces of your recipe runs to any observability platform that accepts the OpenTelemetry Protocol (OTLP) over HTTP, such as Datadog. Use traces to view the entire end-to-end execution of a job across assets, such as recipe functions and third-party services, to identify where time was spent.
A trace is the record of one piece of work from start to finish, such as an API call or a job. A trace contains spans. Each span is one timed operation. Spans are nested to show what ran inside each span.
OpenTelemetry trace streaming sends traces only, with no input or output payloads. Job line details, such as inputs and outputs, continue to stream through audit log streaming.
FEATURE AVAILABILITY
OpenTelemetry trace streaming is available on Enterprise plans and above. Refer to your pricing plan and contract to learn more.
What Workato traces
Workato traces the following:
- API recipes: Each call to an API recipe endpoint, as the first span of its trace.
- MCP servers: Each tool call to a Workato MCP server, as the first span of its trace, followed by the skill that runs.
- Recipe jobs: Each job's execution, including jobs started by schedules, webhooks, event topics, and recipe functions.
- Steps: Each action, including steps that use Workato platform features, such as decision models and data tables, and the control flow blocks around each feature, for example, repeat for each, repeat while, IF conditions, and error monitor (try).
- Errors: The failing step and error message, marked on the step and on the job.
Workato doesn't trace data pipeline runs, managed file transfer (MFT), or genie workloads.
Traces contain timing, status, and identifiers only. Workato doesn't include step inputs, step outputs, or log message text in traces, so record data doesn't leave Workato through traces and masked steps don't require extra handling.
Span hierarchy
Spans in a trace are arranged to match the structure of your recipe:
- First span: A trace starts at the API platform call (
apim.call) or the MCP tool call (tools/call <tool name>). The trace starts at the job span for other jobs, such as scheduled and webhook-triggered jobs. - Job: Each job run produces a
job.fragmentspan. A job that waits on a recipe function produces one fragment before the call and one fragment after the call. - Steps: Each action step produces an
action.callspan with the connector and operation name, so you can compare time spent in third-party APIs against the rest of the job. - Control flow: Repeat for each, repeat while, IF condition, and error monitor blocks produce spans that contain the spans of the steps inside them. Loops produce one span for each iteration.
- Synchronous recipe functions: The called recipe's spans appear in the caller's trace.
- Asynchronous recipe functions: The called recipe starts its own trace. A span link connects it to the caller's trace.
Refer to Trace payload for span names and attributes.
Delivery
Workato delivers traces on a best-effort basis. Workato retries a limited number of times when it can't deliver spans to your platform, and then drops the affected spans. Your platform doesn't receive dropped spans. Workato doesn't store trace data, so dropped spans can't be resent and traces aren't generated retroactively for jobs that ran before you set up streaming.
Set up OpenTelemetry trace streaming
You set up trace streaming separately for each environment. Each environment can stream to one collector URL.
PREREQUISITES
You must have the following to set up trace streaming:
- The OpenTelemetry environment settings privilege. The Environment admin role includes this privilege.
- An observability platform account that accepts OTLP traces over HTTP (
http/protobuf) - Your platform's trace endpoint and credentials. Refer to Platform settings for Datadog.
Complete the following steps to set up OpenTelemetry trace streaming:
Sign in to your Workato account and switch to the environment to stream traces from.
Go to Workspace admin > Settings > Debug and logs > OpenTelemetry.
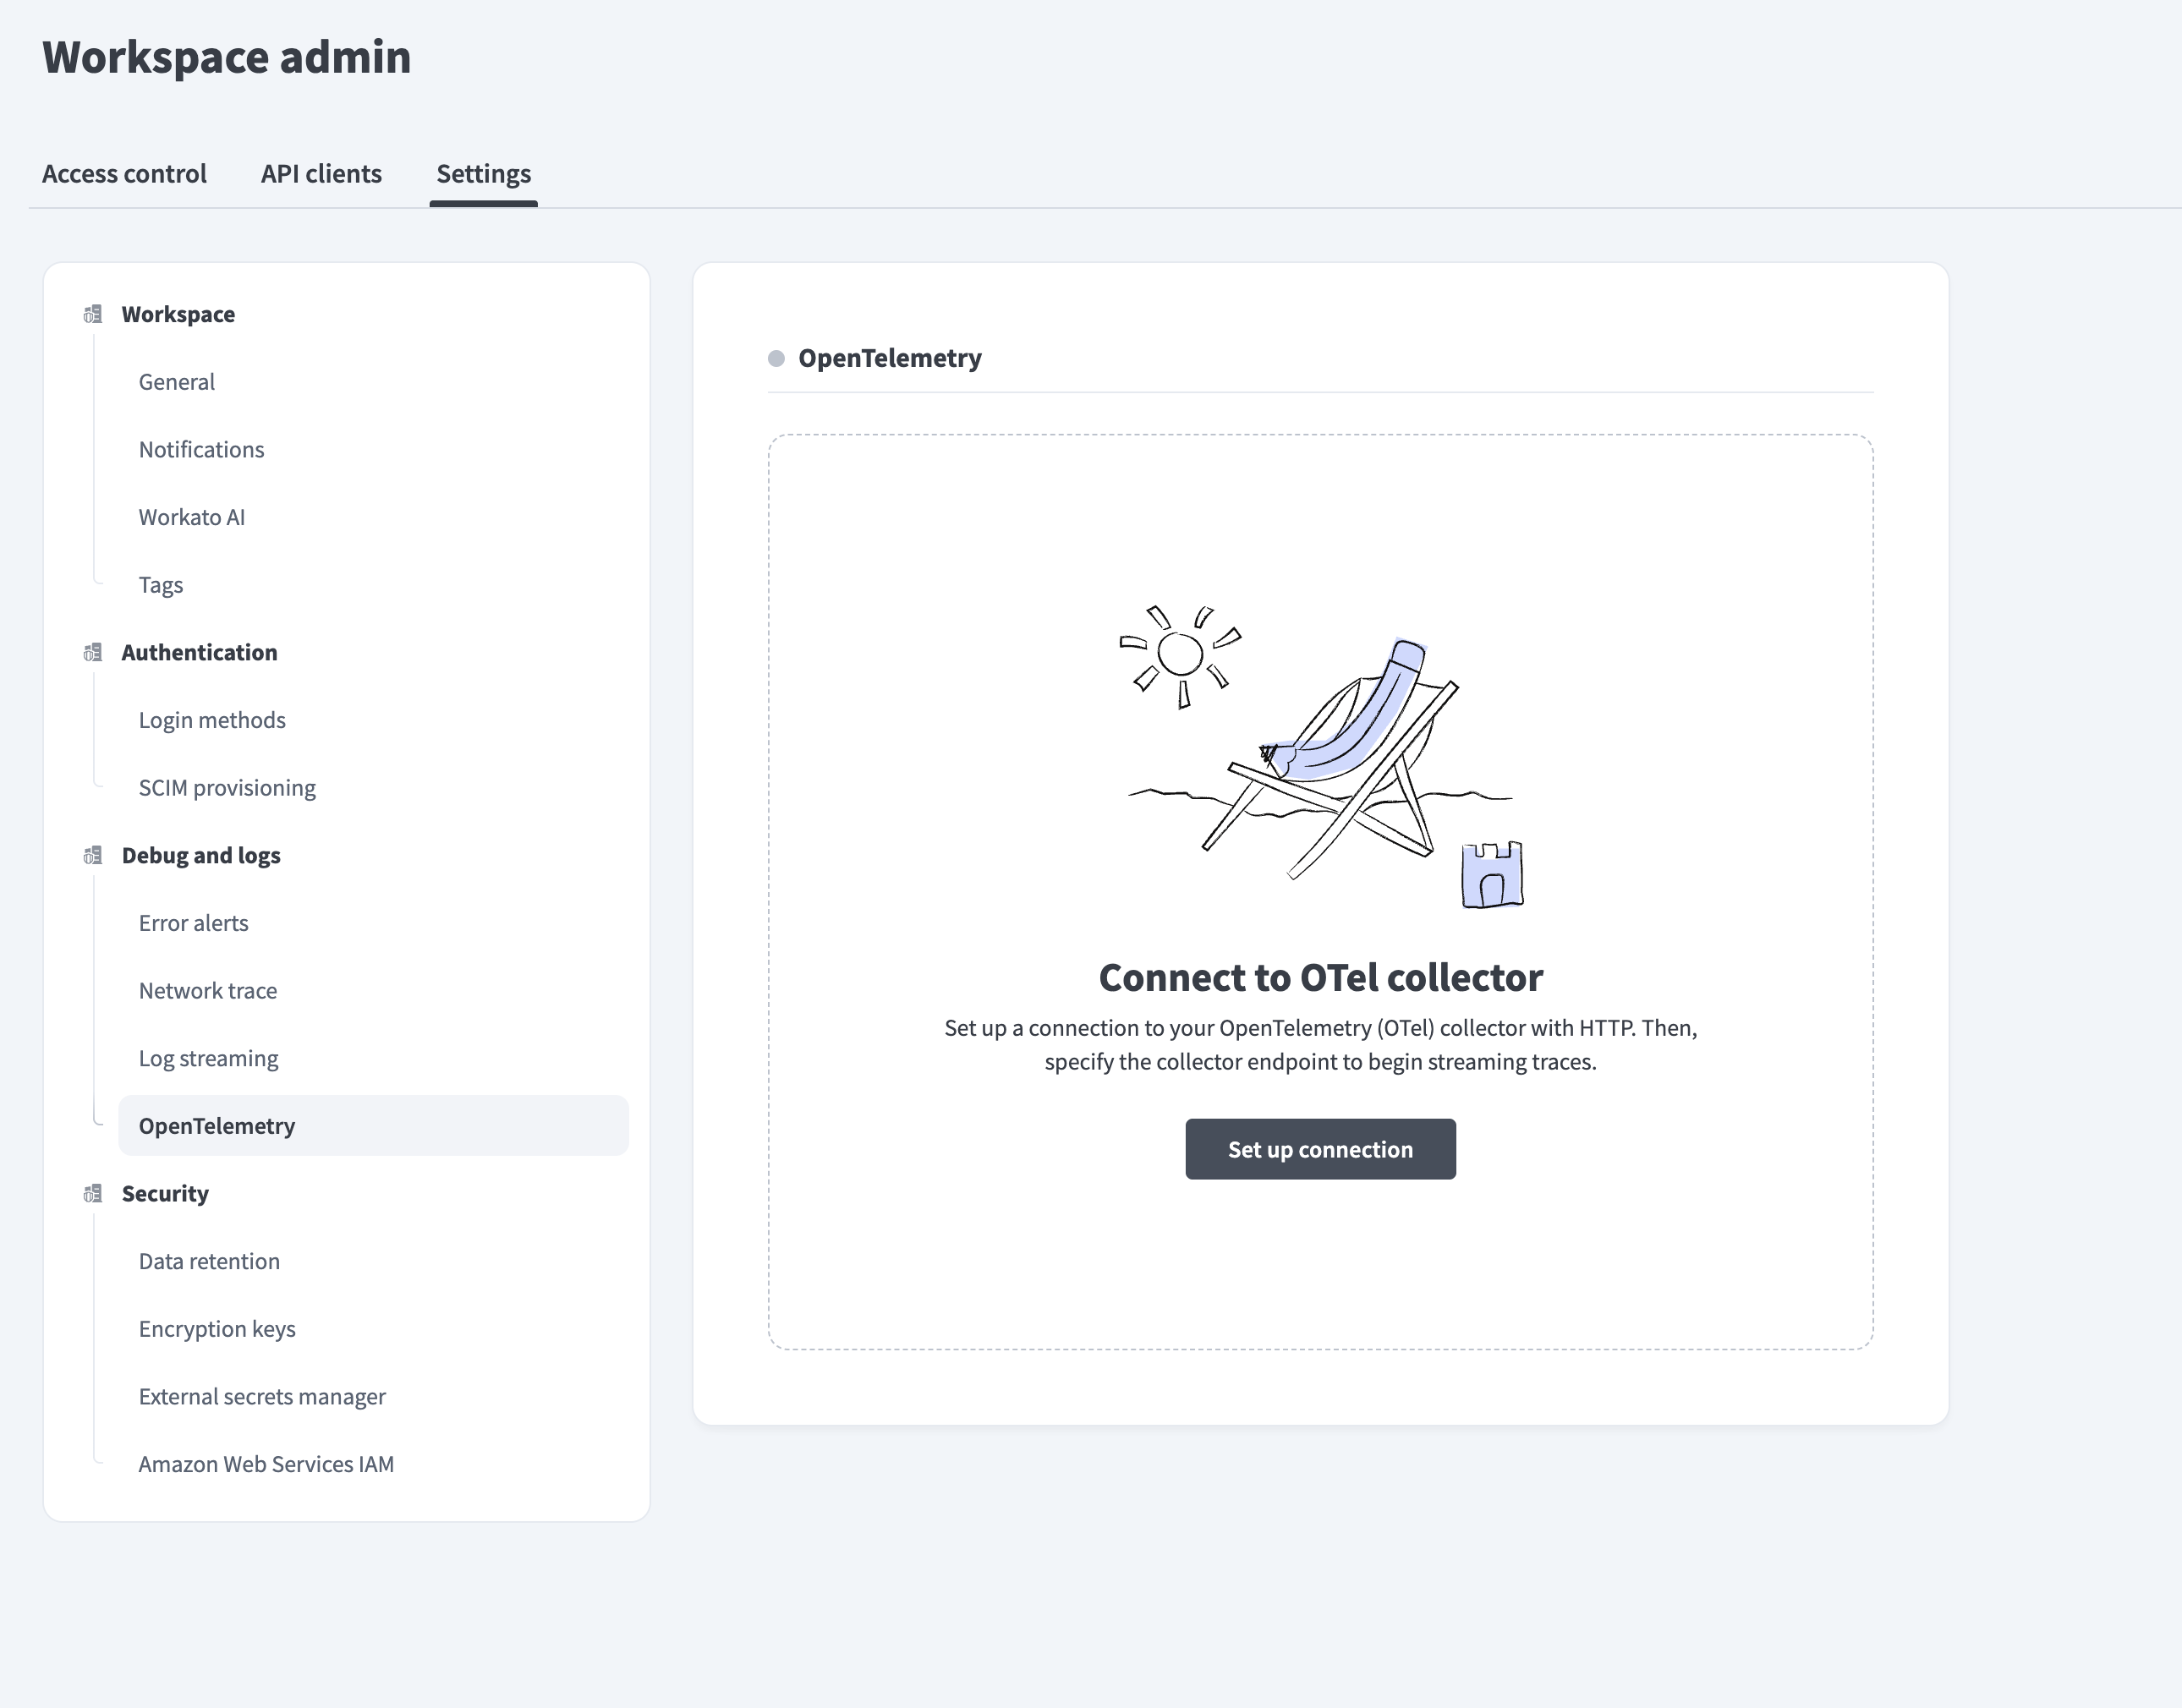 OpenTelemetry settings
Click Set up connection. This opens the Connect to HTTP dialog.
Select an existing HTTP connection from the list, or click New connection to create a connection. OpenTelemetry trace streaming supports HTTP connections that use header authentication.
Click Save and go to the step where you enter the OTEL Collector URL if you select an existing connection.
Enter a Connection name.
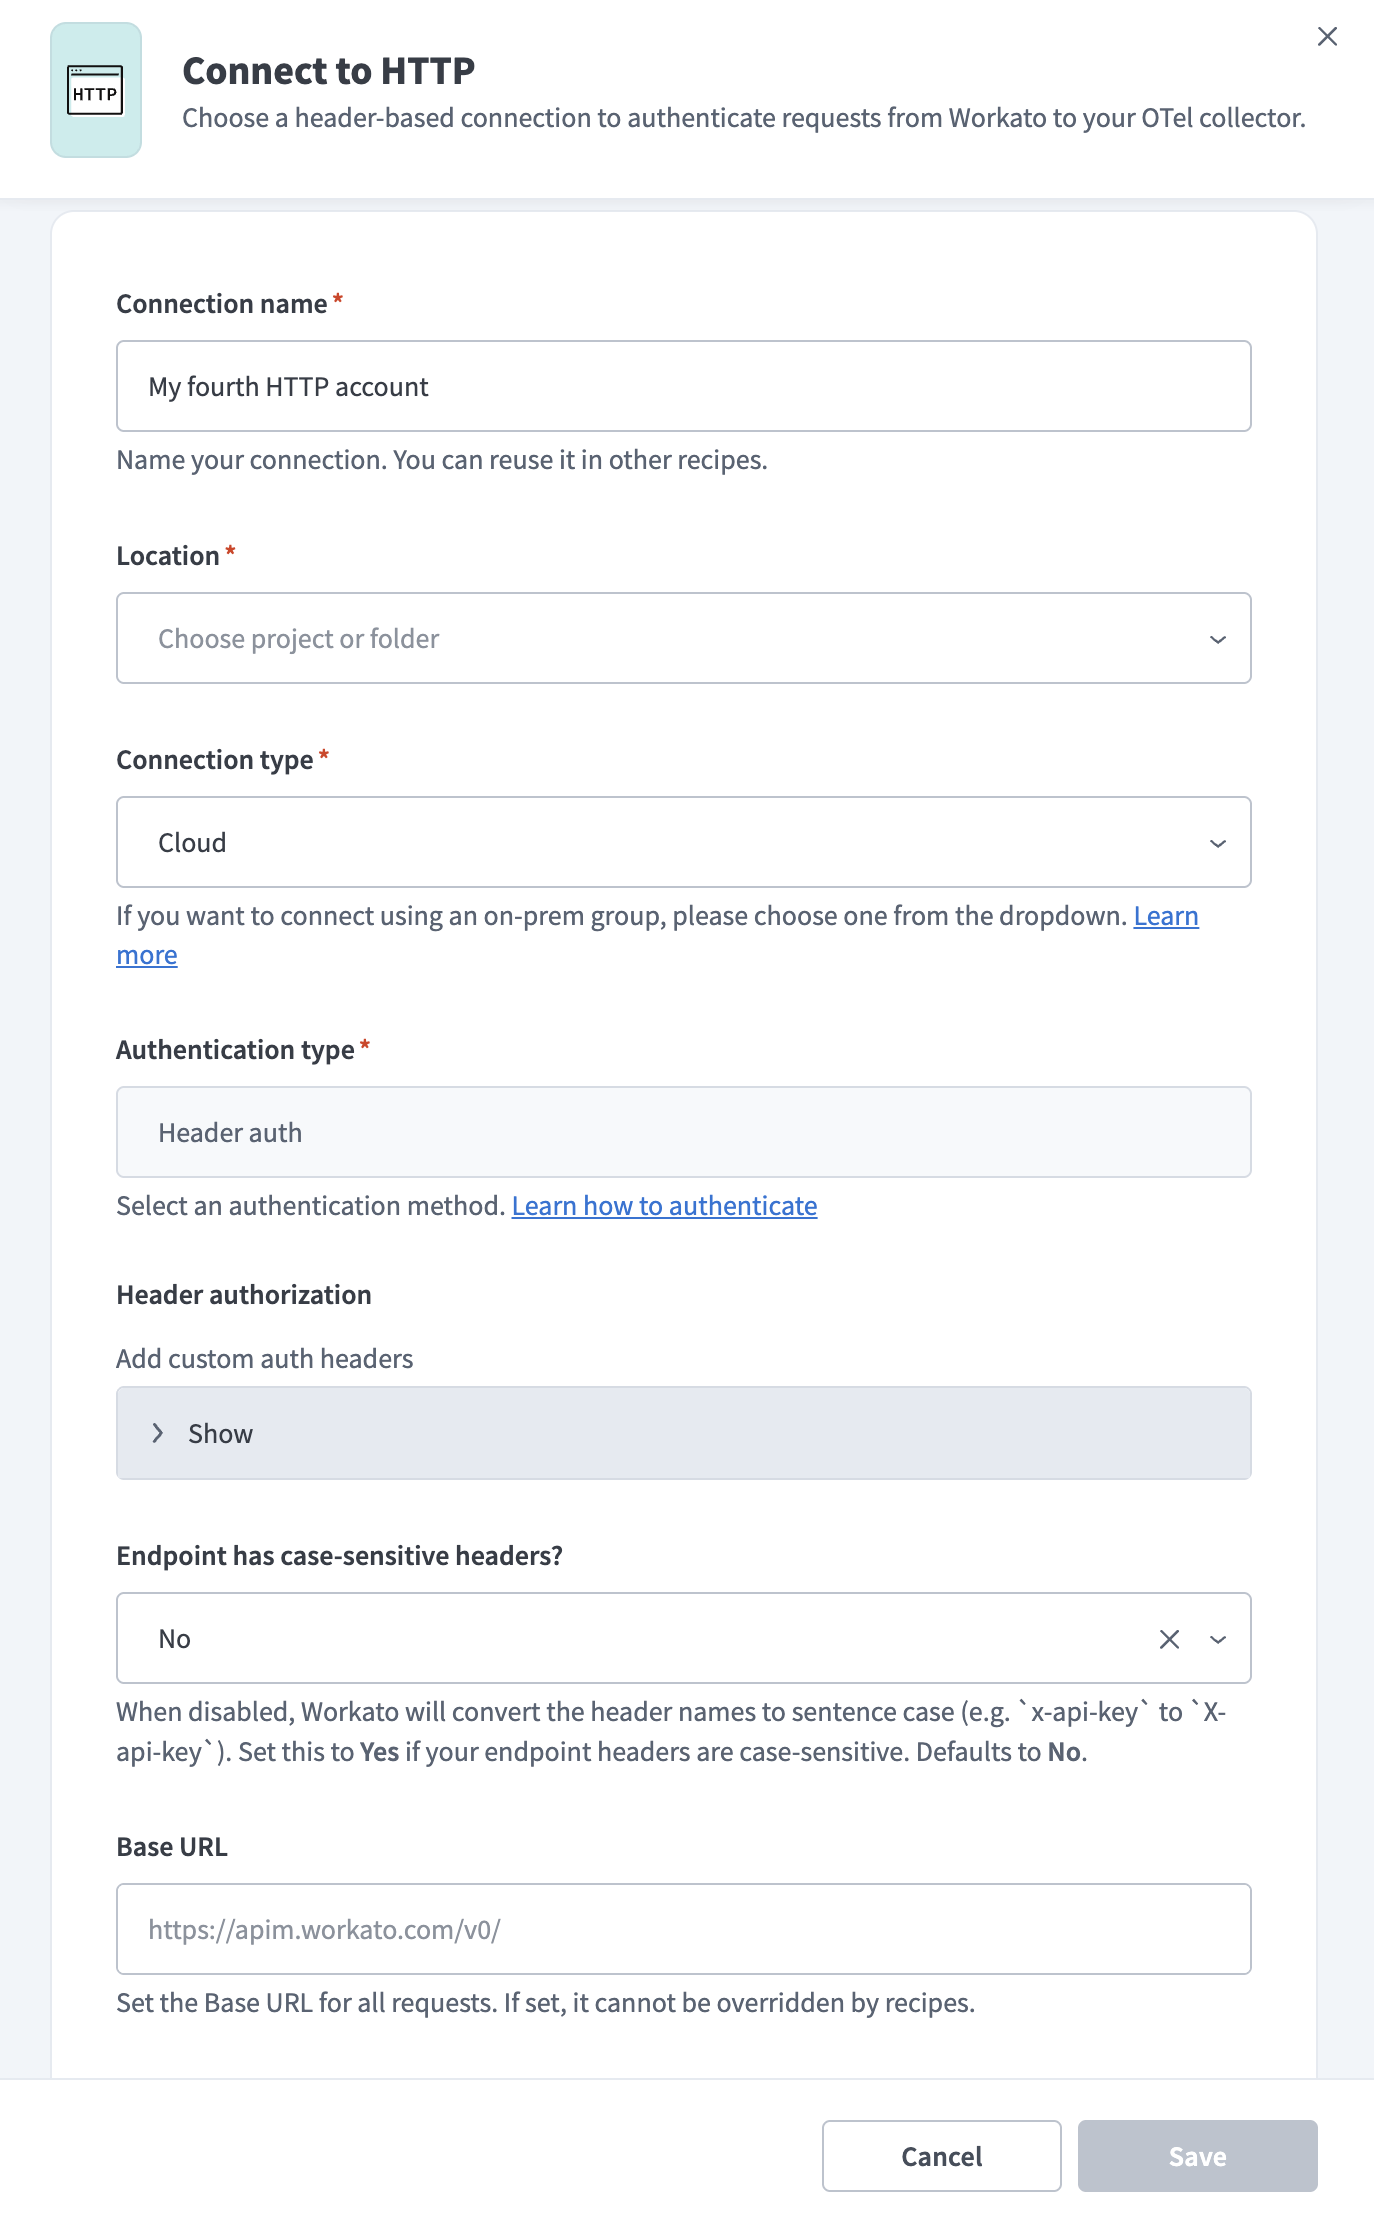 Create an HTTP connection
Use the Location drop-down menu to select the project or folder where Workato stores the connection.
Use the Connection type drop-down menu to select Cloud.
Confirm that Authentication type is set to Header auth. This is the only supported authentication type, and the field can't be changed.
Expand Header authorization and click + Add headers to add each header your platform requires. Enter the header name in the Key field and the header value in the Value field. Refer to Platform settings for the headers to add.
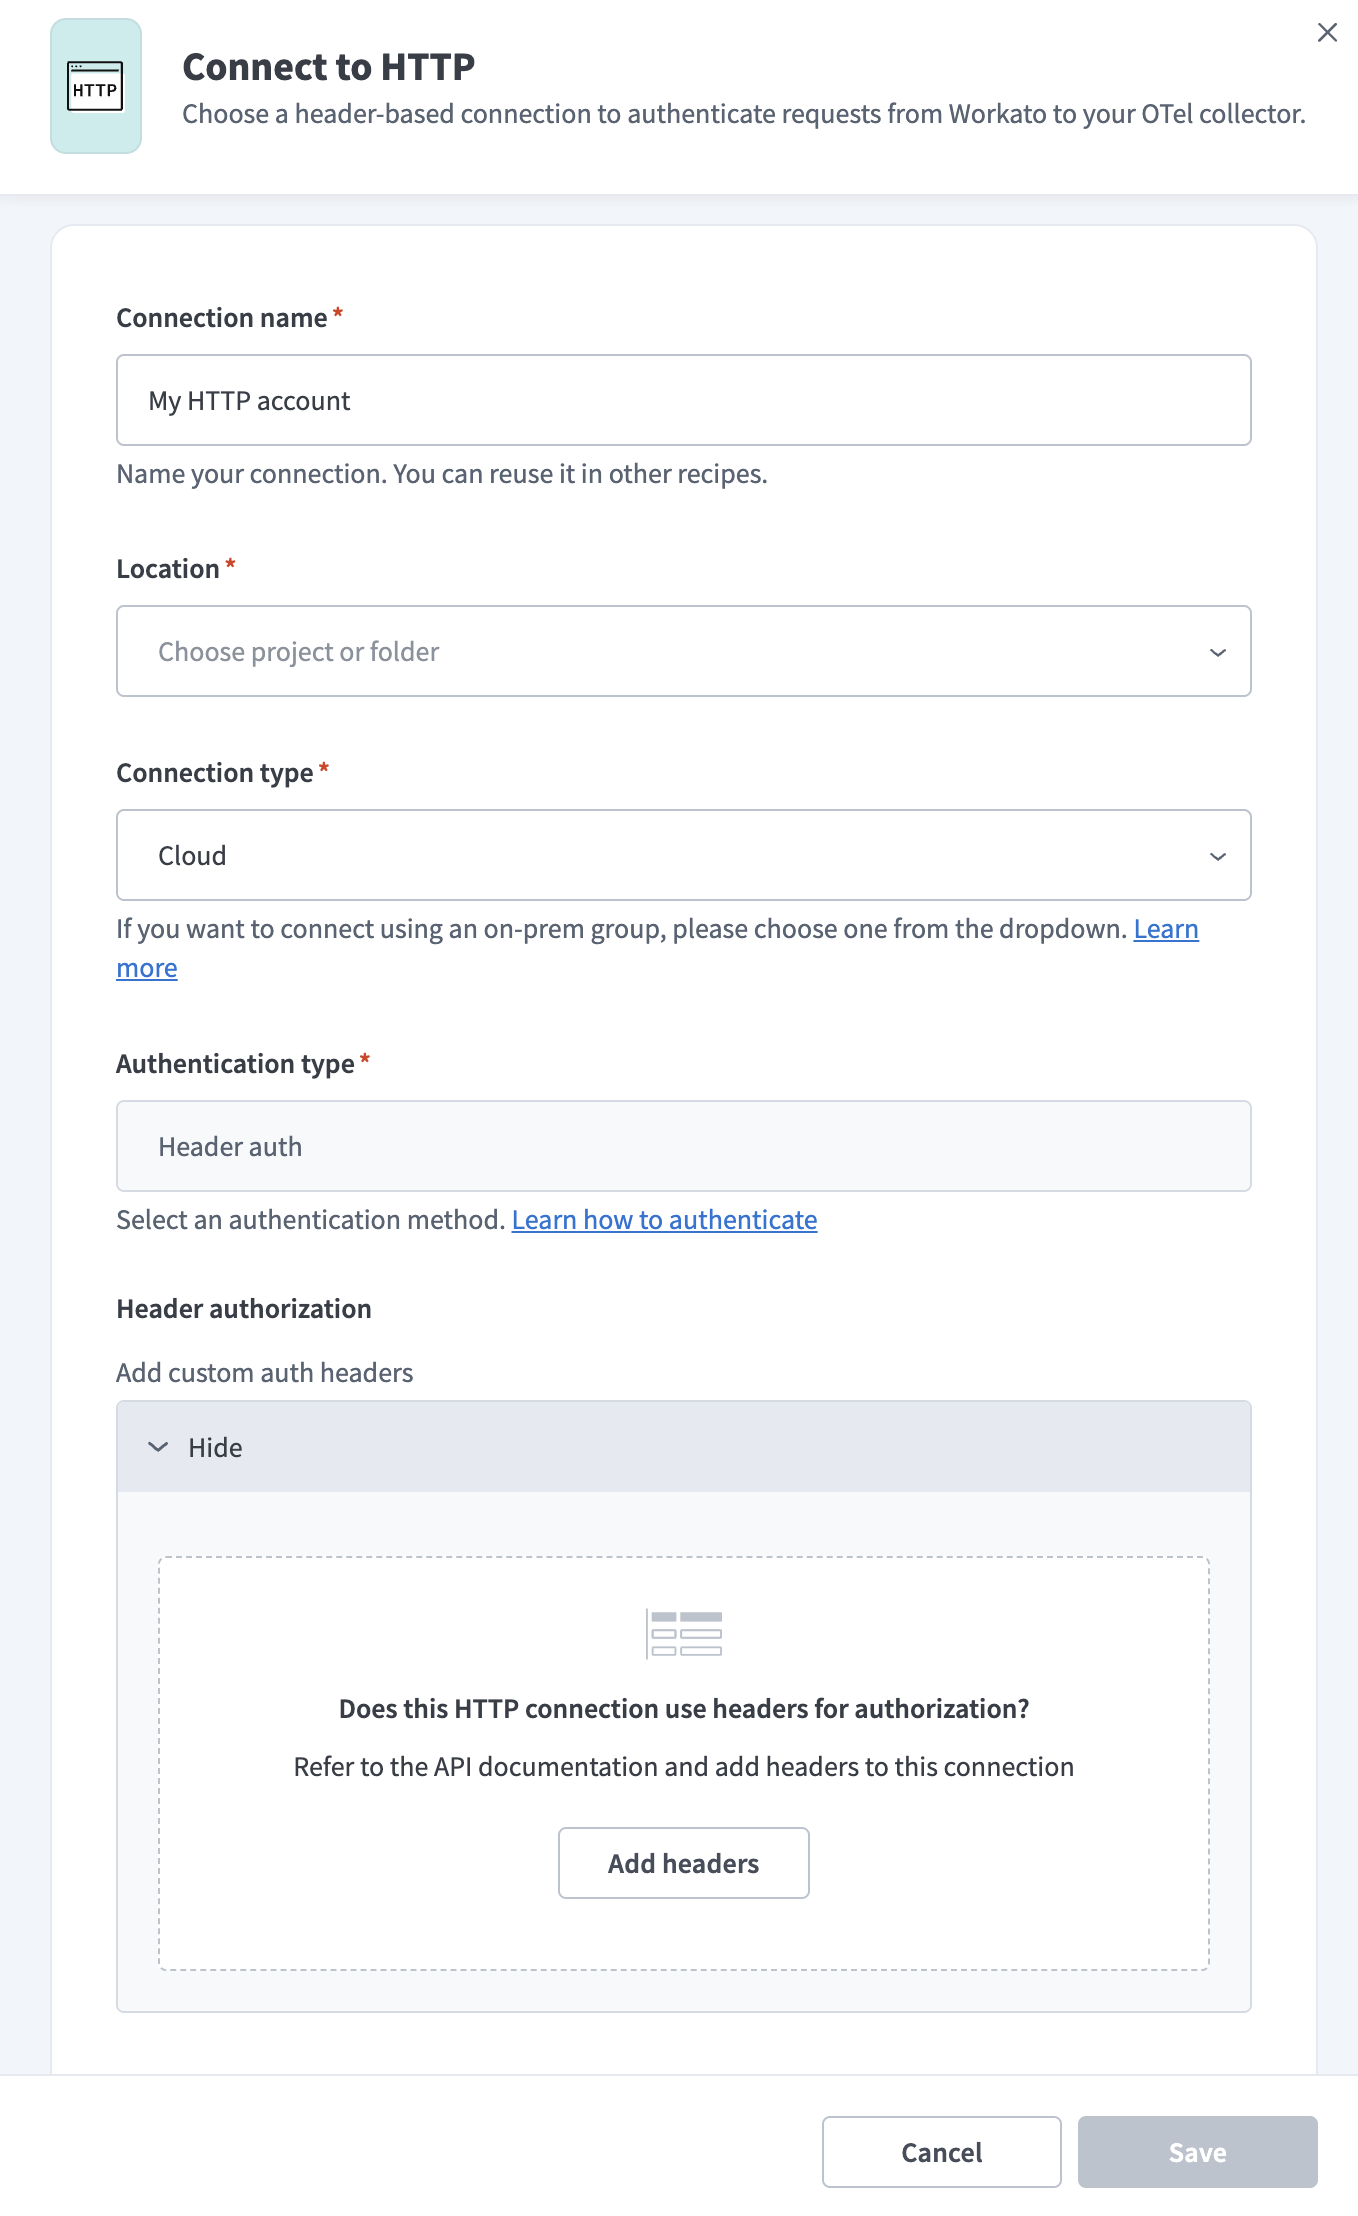 Add authentication headers
Optional. Use the Endpoint has case-sensitive headers? drop-down menu to select Yes if your platform requires exact header-name casing. Workato converts header names to sentence case when this is set to No, for example x-api-key to X-api-key. The default is No.
Click Connect.
Confirm that the new connection is selected in the list, and then click Save.
Enter your platform's trace endpoint in the OTEL Collector URL field. Enter the full URL, including the path. Refer to Platform settings for the endpoint to use.
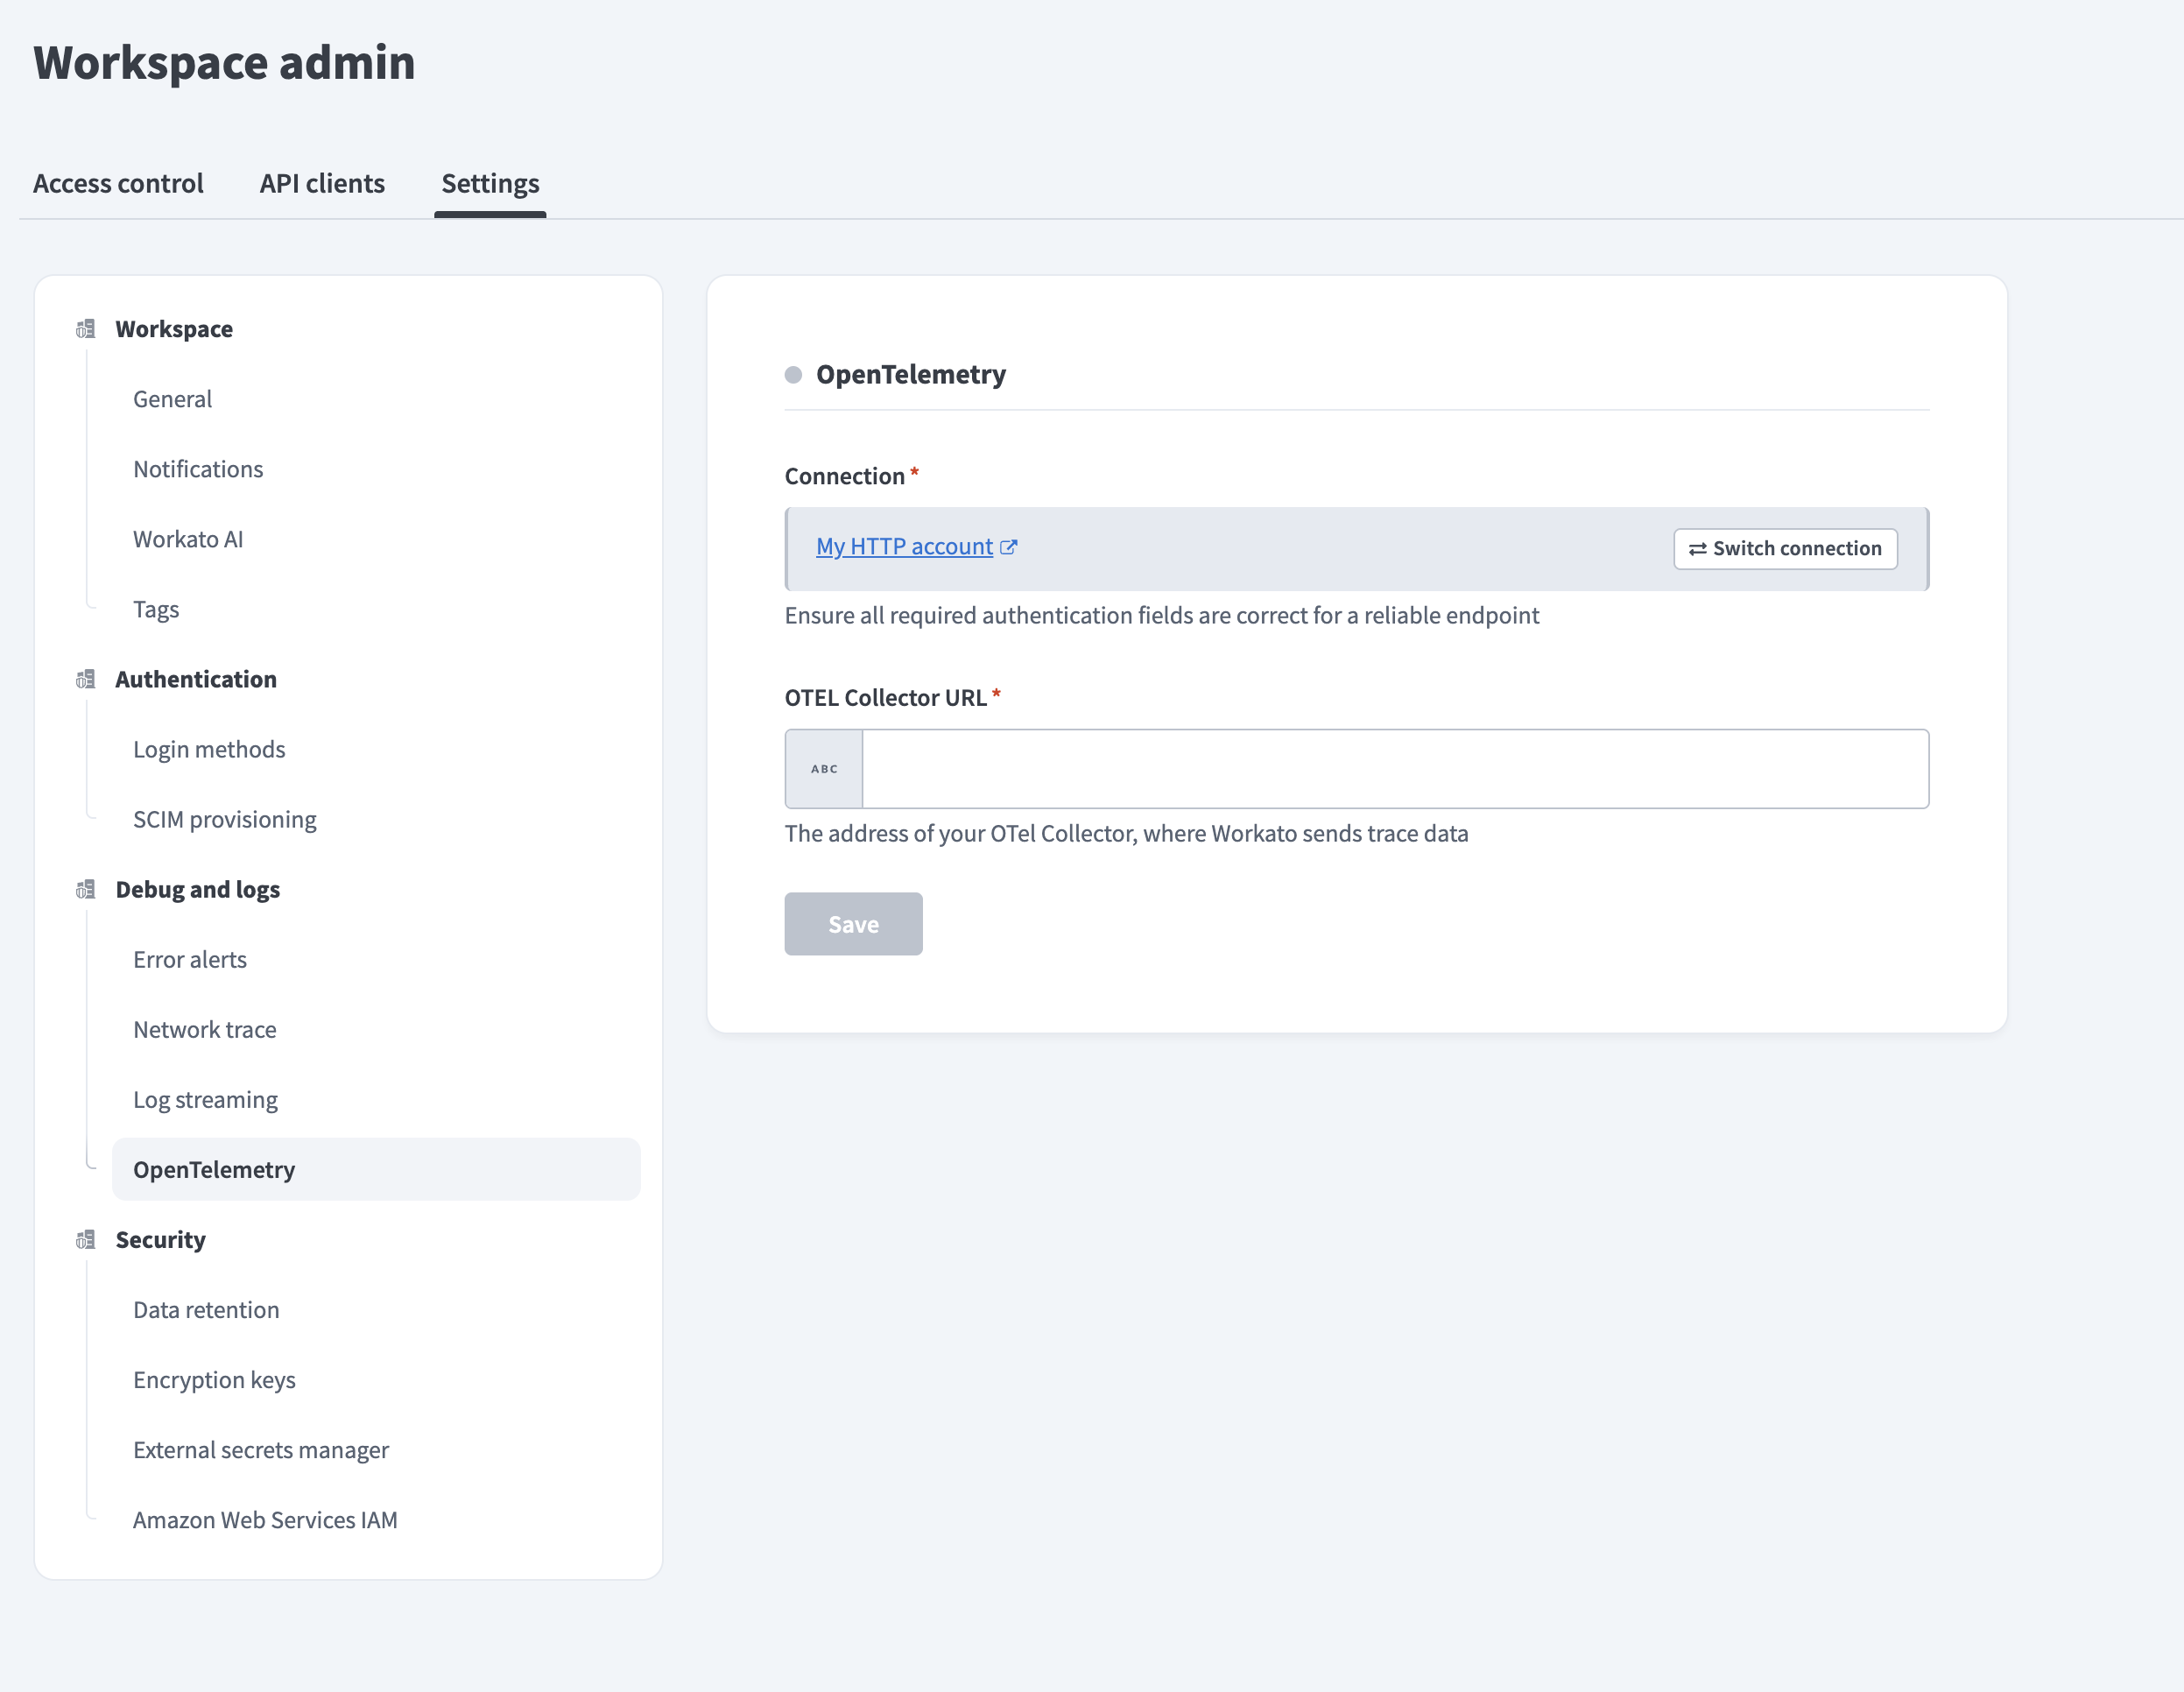 Enter the collector URL
HTTPS REQUIRED
The OTEL Collector URL must use https. Workato doesn't send traces to http endpoints.
Click Save.
Workato displays a Successfully saved! message, and the status indicator next to OpenTelemetry turns green. Workato starts sending traces for new jobs in this environment.
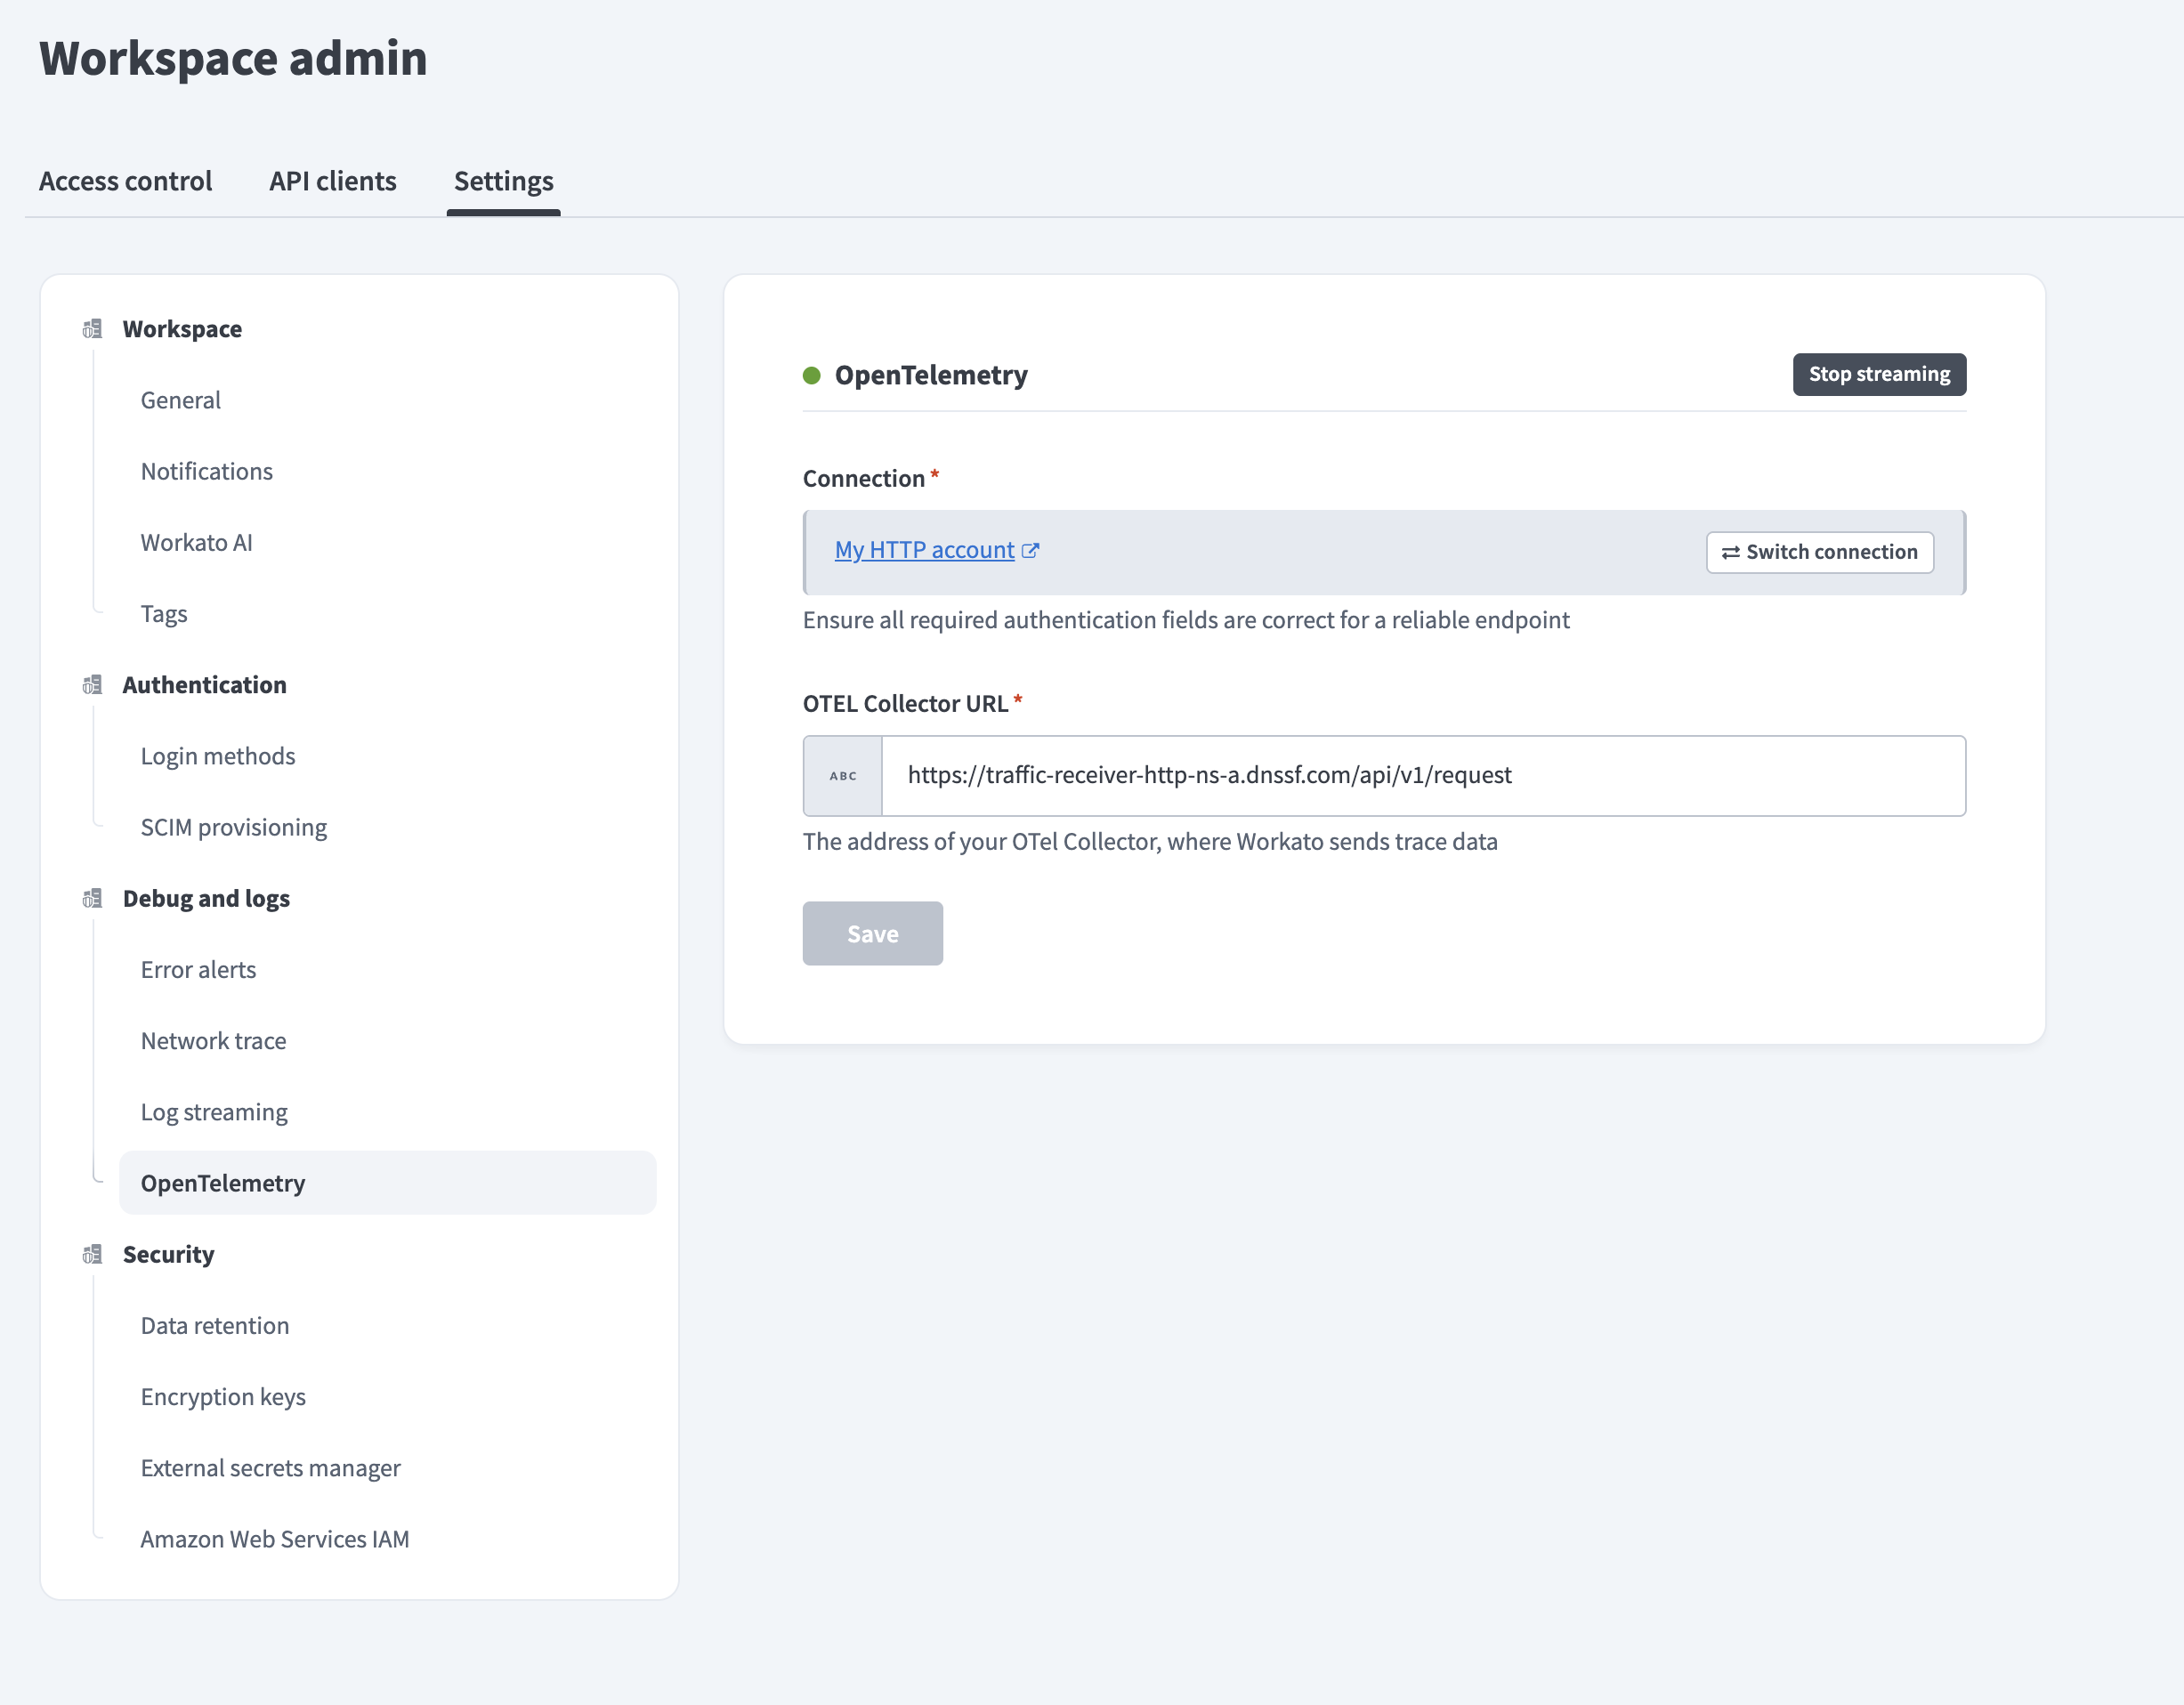 Trace streaming active
Platform settings
Use the following settings for your observability platform:
| Platform | OTEL Collector URL | Headers |
|---|---|---|
| Datadog | The OTLP traces endpoint for your Datadog site, for example https://otlp.datadoghq.com/v1/traces for the US1 site | dd-api-key: Your Datadog API keycompute_stats: true |
Datadog doesn't compute trace metrics, such as request count, error rate, and latency, for traces sent directly to its OTLP intake endpoint unless you add the compute_stats header. The Datadog OTLP intake endpoint doesn't accept gRPC. Refer to the Datadog OTLP traces intake documentation for more information.
Verify trace streaming
Complete the following steps to confirm Workato is sending traces to your platform:
Go to Workspace admin > Settings > Debug and logs > OpenTelemetry and confirm that the status indicator next to OpenTelemetry is green.
Run a recipe in the environment you configured.
Search your platform's trace explorer for the workato_customers_tracing service.
Connect API calls to your own traces
API recipe spans can join your client's existing trace, so one request reads through your application and Workato in a single trace. Send your client's W3C trace context in the X-Workato-Customer-Traceparent header when you call an API platform endpoint. Workato reads the X-Workato-Customer-Traceparent header, not the standard traceparent header.
The header value uses the W3C traceparent format: version-traceid-parentid-flags, with a 32-character hexadecimal trace ID and a 16-character hexadecimal span ID. For example:
curl -X POST 'https://<your API endpoint URL>' \
  -H '<your API auth header>' \
  -H 'X-Workato-Customer-Traceparent: 00-4bf92f3577b34da6a3ce929d0e0e4736-00f067aa0ba902b7-01' \
  -d '{"order_id": "A-1001"}'
The apim.call span appears under your client's span and uses your client's trace ID. Each API call starts a new trace if you don't send the header.
Workato doesn't add trace context headers to outbound connector requests.
Change the connection or collector URL
Complete the following steps to stream traces to a different connection or collector URL:
Go to Workspace admin > Settings > Debug and logs > OpenTelemetry.
Click Switch connection to select a different HTTP connection, and then click Save in the Connect to HTTP dialog.
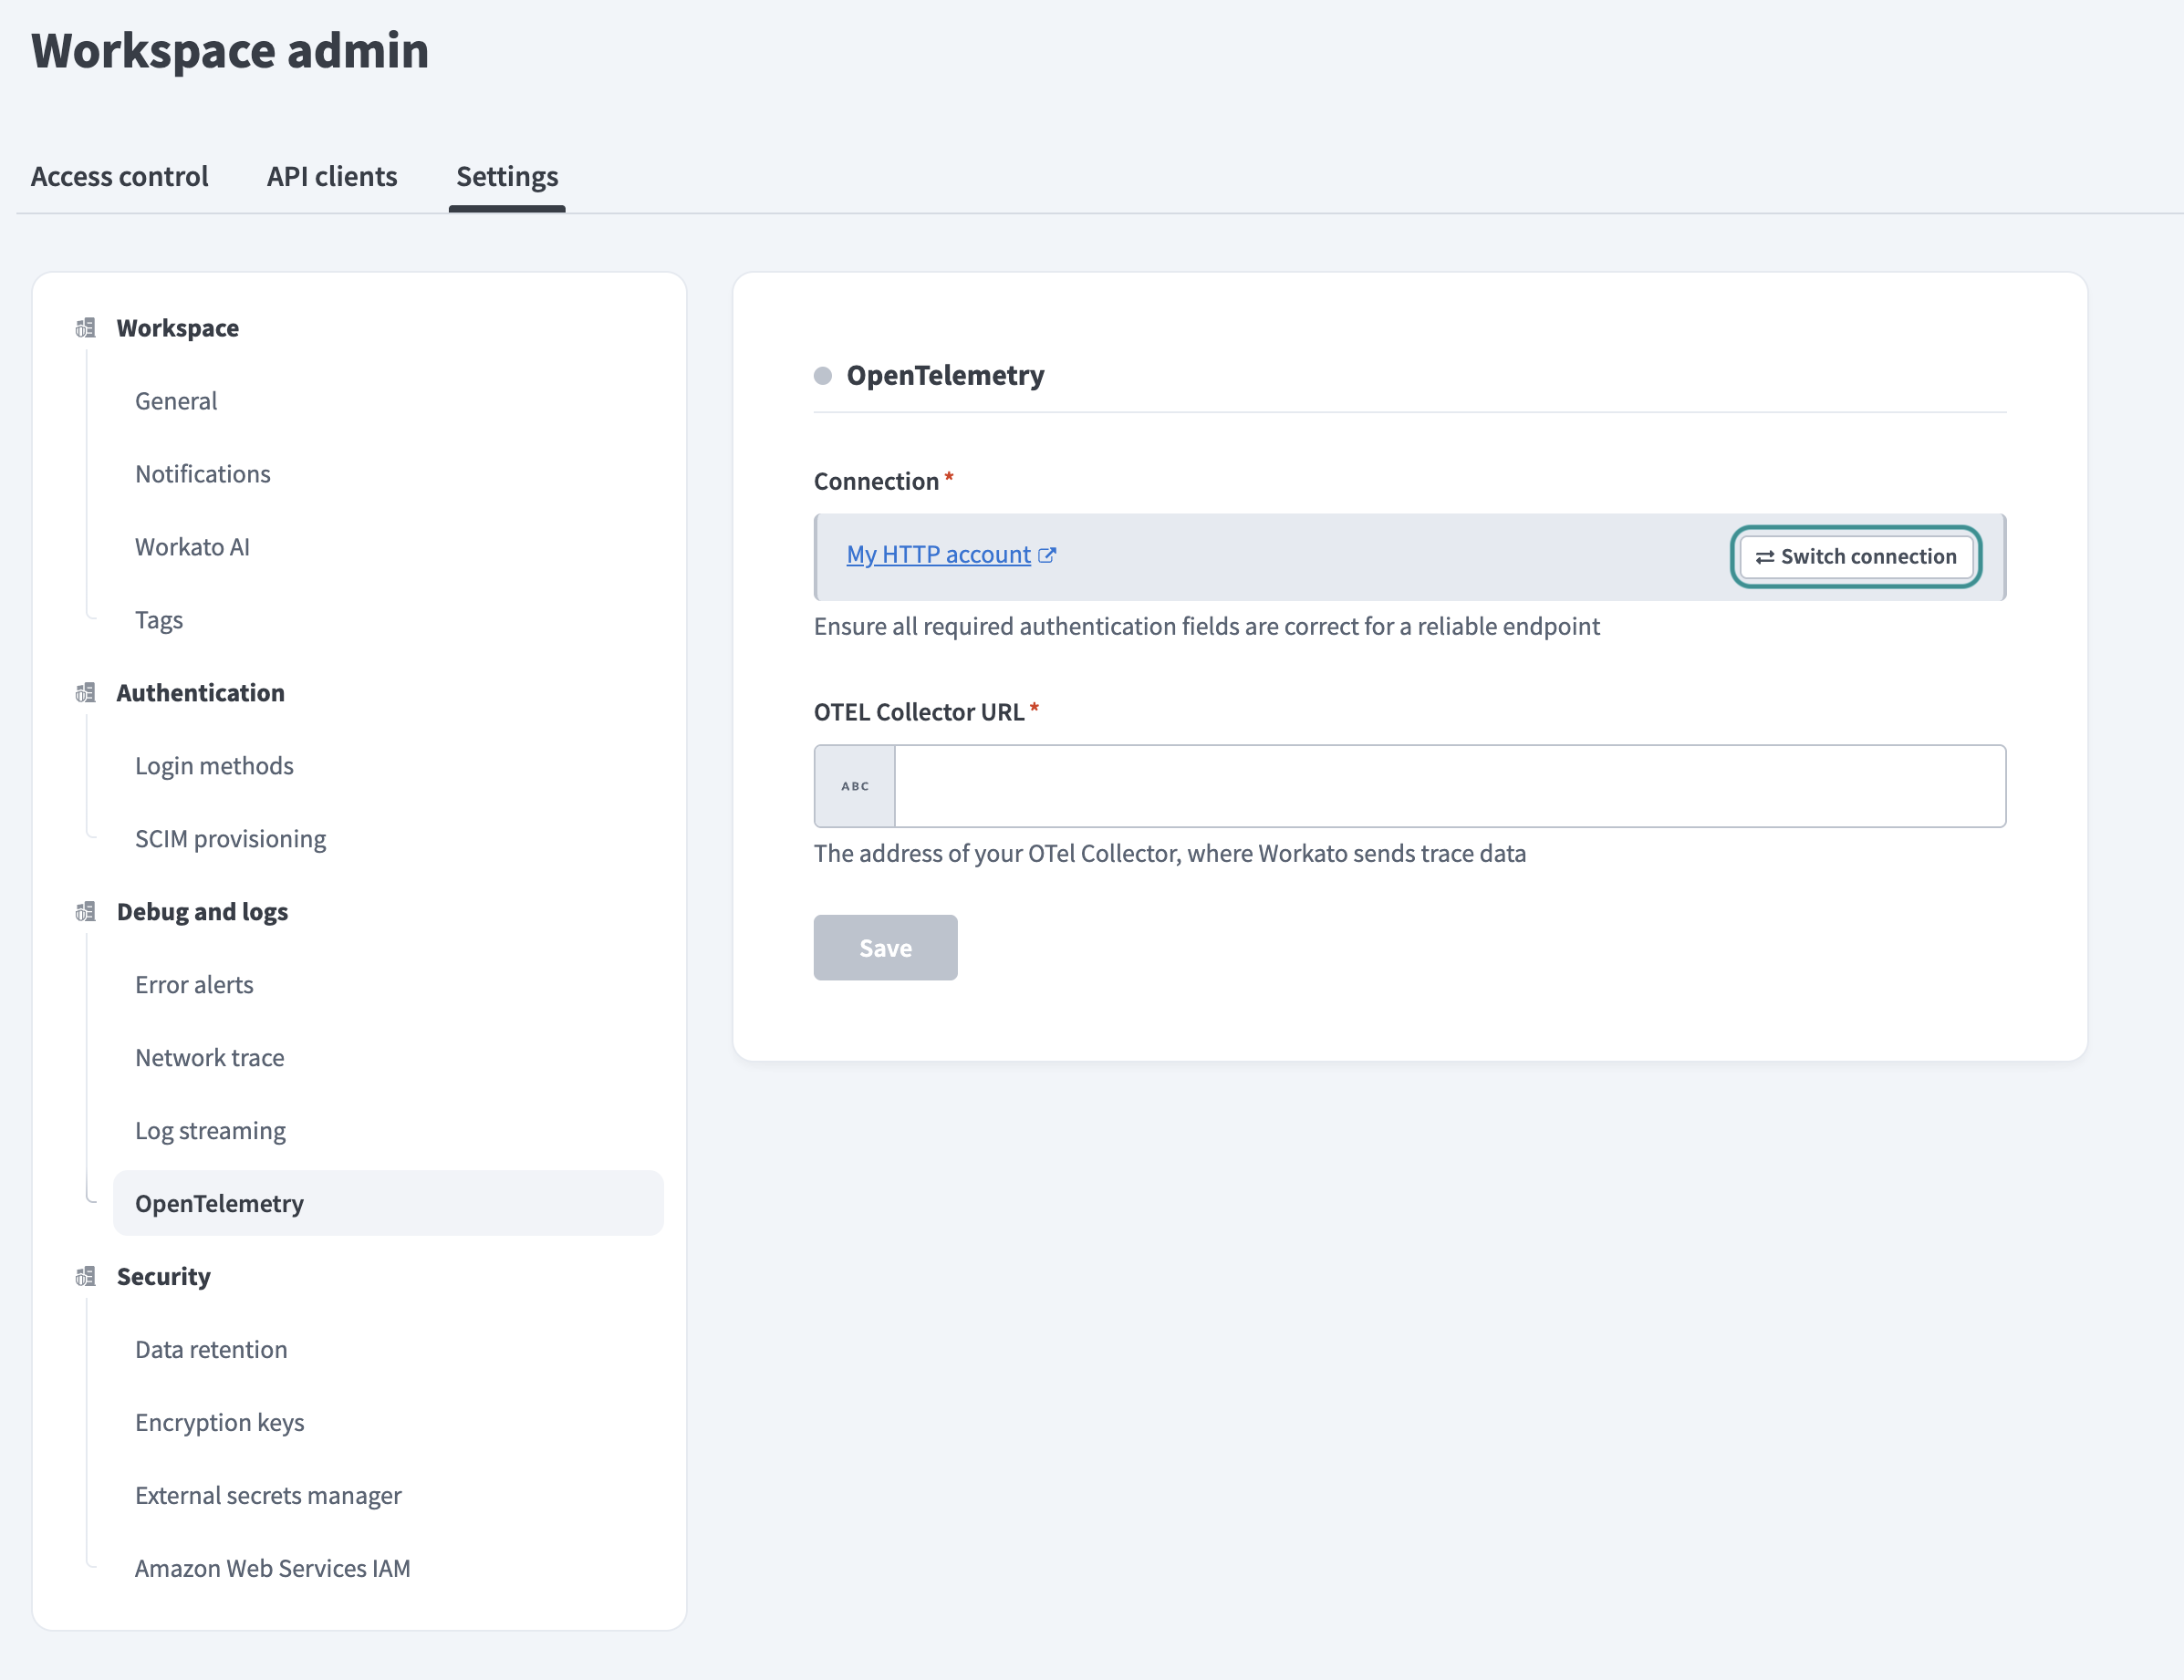 Switch the connection
Update the OTEL Collector URL if the new connection uses a different endpoint.
COLLECTOR URL ISN'T RESET
Switching the connection doesn't change the OTEL Collector URL. Update the URL before you save if the new connection points to a different platform, otherwise Workato sends traces to the previous URL with the new connection's headers.
Click Save.
Stop trace streaming
Stopping trace streaming removes the connection and OTEL Collector URL from your OpenTelemetry settings and returns the page to its initial state. The HTTP connection itself isn't deleted and remains available in your workspace, so you can select it again when you set up streaming later.
Complete the following steps to stop trace streaming:
Go to Workspace admin > Settings > Debug and logs > OpenTelemetry.
Click Stop streaming.
Click Stop streaming in the confirmation message to confirm. Workato stops sending traces to your platform.
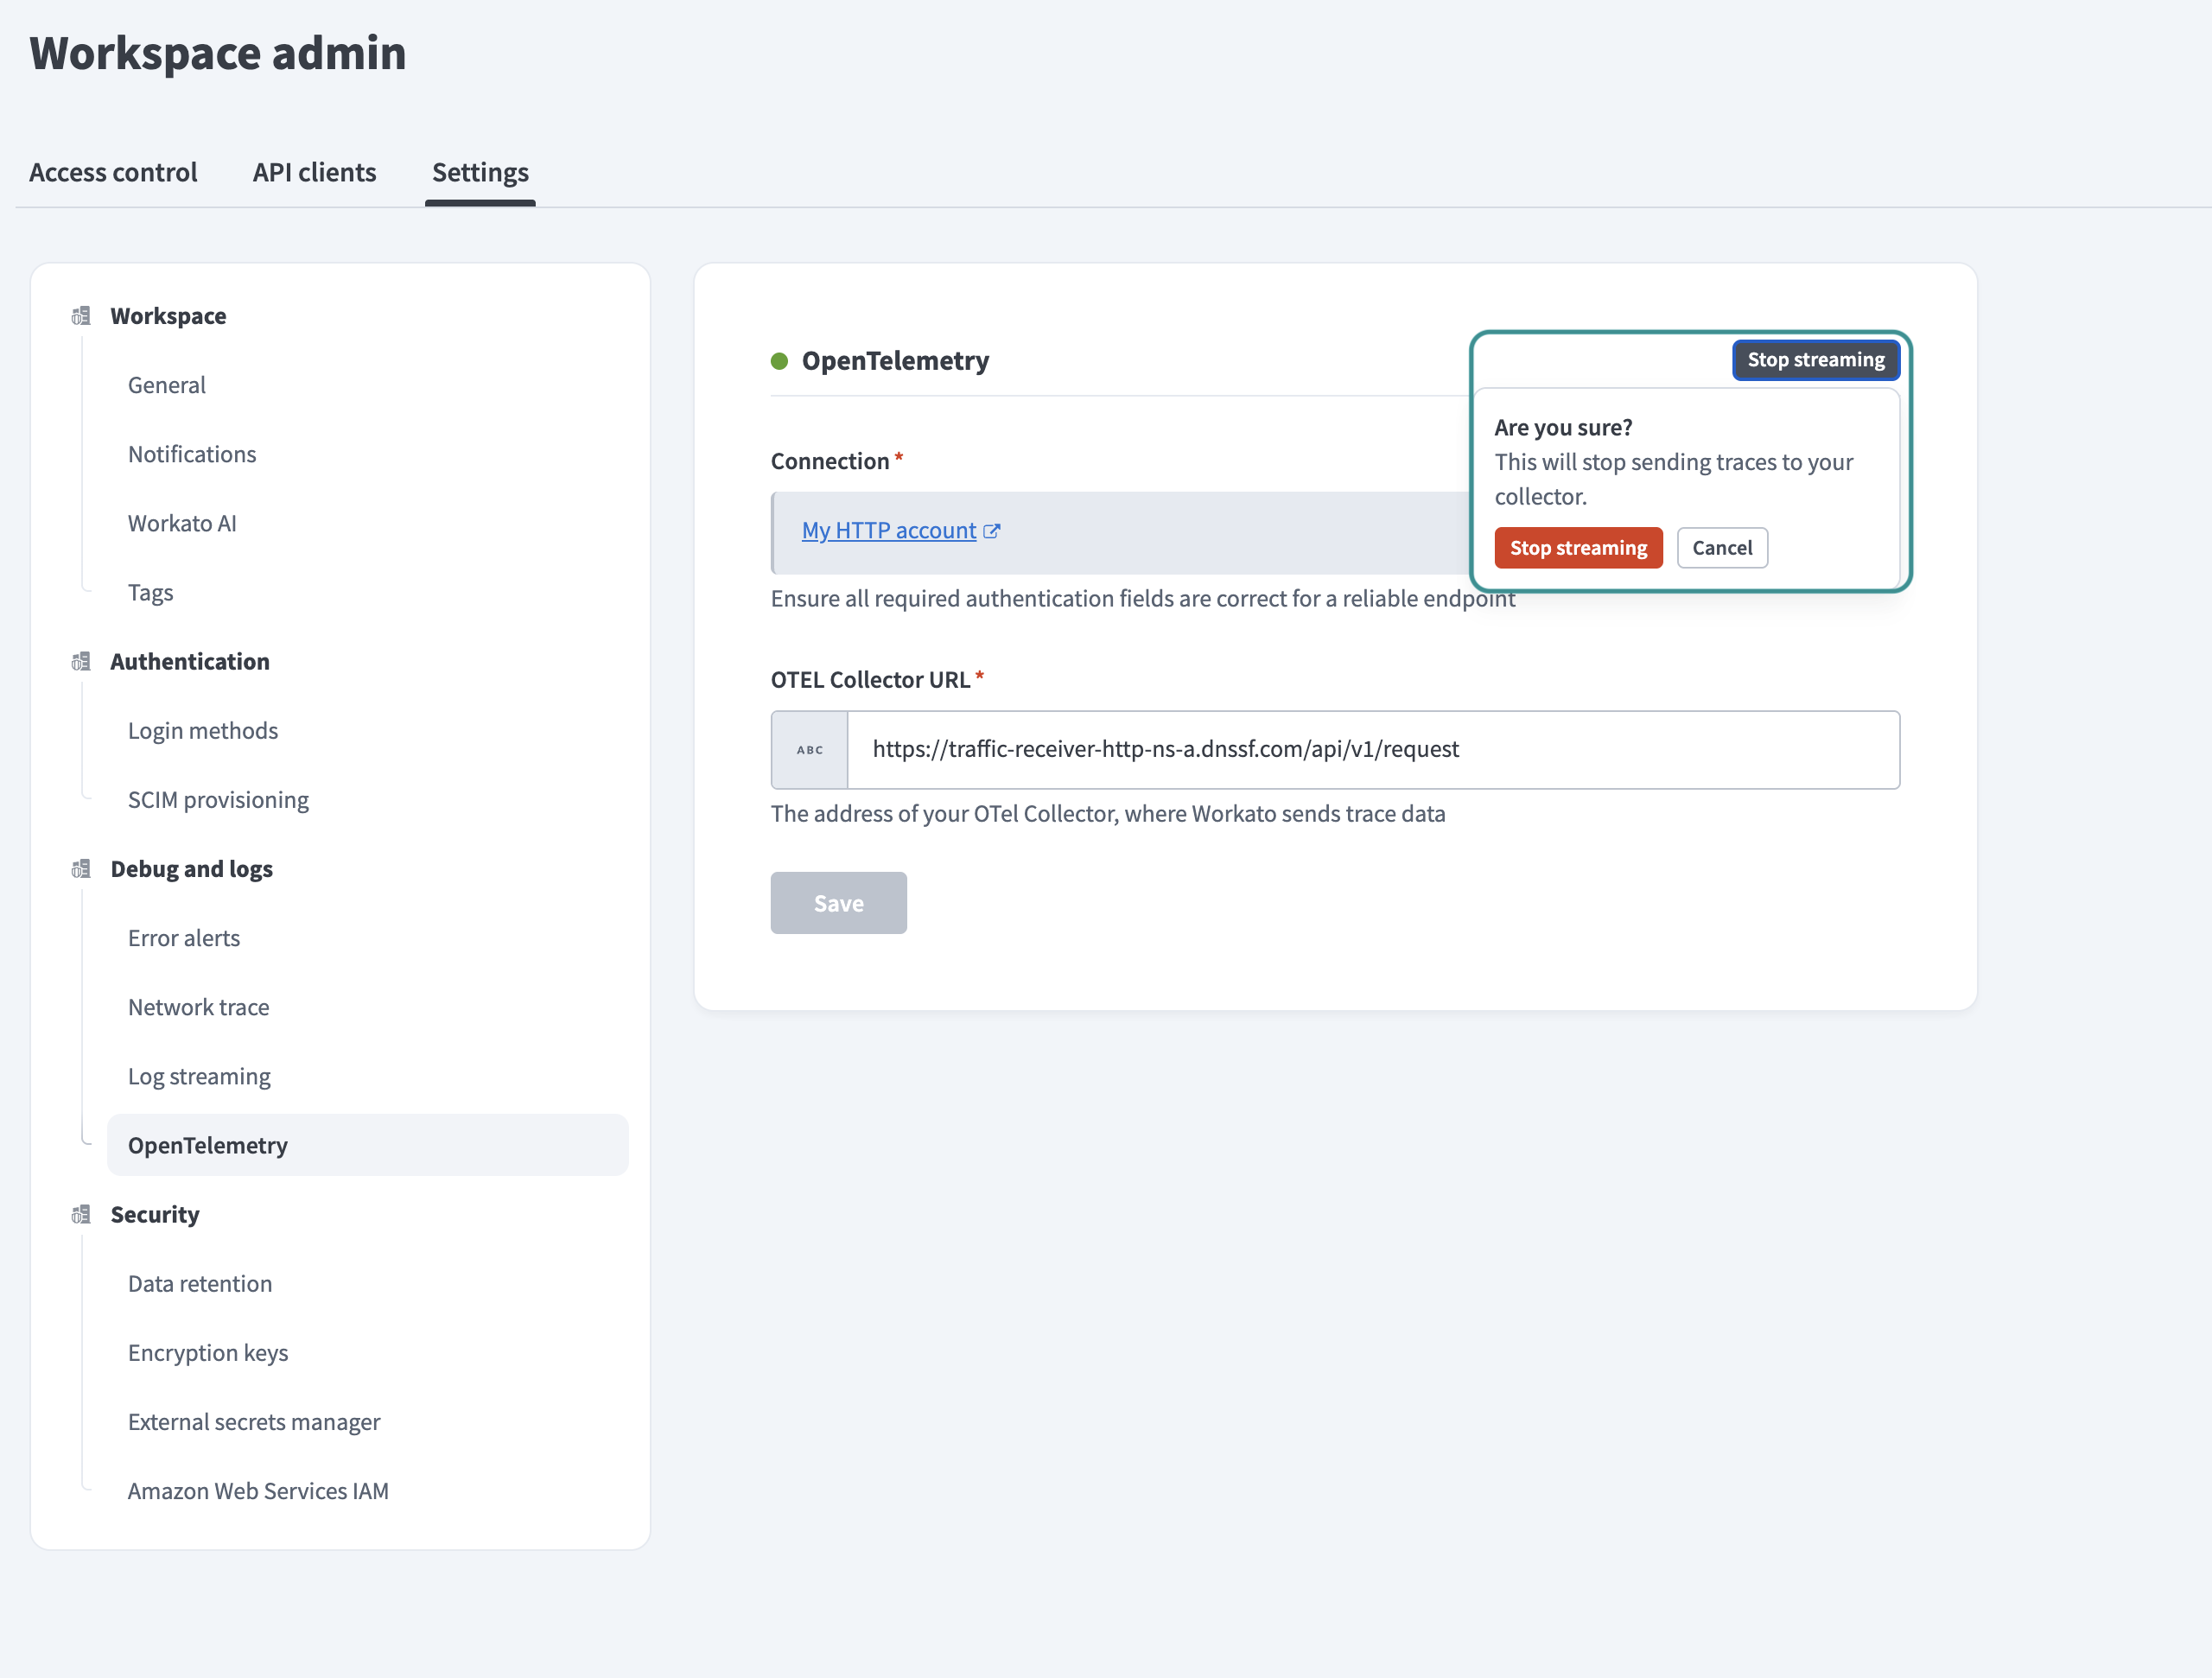 Stop streaming
Trace payload
Each span has a name, start and end timestamps, a status, and attributes. Your platform uses the attributes as tags you can search, filter, and group by.
The startTimeUnixNano and endTimeUnixNano fields contain each span's start and end times, in nanoseconds since the Unix epoch, as unsigned 64-bit integers. These values are strings in OTLP/JSON. The span's duration is the end time minus the start time. Observability platforms might rename these fields. For example, Datadog displays them as startTime, endTime, and duration.
Spans are nested to match how the work ran. The first span in a trace depends on what started the work, and the job and step spans follow under it.
Example traces
The following example shows a trace for an API recipe that runs an action inside a repeat for each block:
apim.call
└── job.fragment
    └── foreach
        └── action.call
The apim.call span covers the full API call. The job.fragment span covers the job the call started, and the foreach and action.call spans cover the loop and the step inside it. Each iteration of the loop adds its own spans to the trace.
The following example shows a trace for a tool call to a Workato MCP server:
tools/call <tool name>
└── job.fragment
    └── action.call
The tools/call span is named for the tool the MCP client called. The job.fragment span covers the skill's job, and the action.call spans cover each step it ran.
Jobs started by schedules, webhooks, event topics, and asynchronous recipe functions begin at the job.fragment span. Synchronous recipe function calls appear inside the caller's trace.
Spans
The following table describes each span and the attributes it carries in addition to workato.environment.id, which is present on every span:
| Span | When it appears | Attributes |
|---|---|---|
apim.call | When a client calls an API recipe endpoint. This is the first span in the trace, unless you pass X-Workato-Customer-Traceparent to add it to your client's trace. | http.request.method, http.route, http.response.status_code, url.path, url.scheme, workato.workspace.id |
tools/call <tool name> | When an MCP client calls a tool on a Workato MCP server. This is the first span in the trace. | mcp.method.name, gen_ai.tool.name, gen_ai.operation.name, gen_ai.tool.call.id, gen_ai.server.name, workato.tool.id, workato.workspace.id |
job.fragment | Each time a job runs. A job that waits on a recipe function produces one fragment before the call and one fragment after the call. | workato.job.id, workato.recipe.id, workato.recipe.name, workato.environment.type |
action.call | Each action step, including steps that use Workato platform features, such as decision models and data tables. | workato.connector_name, workato.operation_name, workato.full_operation, workato.step_line_number, workato.step_kind |
foreach, repeat, if, try | Each repeat for each, repeat while, IF condition, and error monitor block. These spans contain the spans of the steps inside the block. | workato.step_kind, workato.step_line_number |
Attributes
The following tables describe span attributes, grouped by what they identify.
Environment and workspace
Use the following attributes to separate traces by environment, for example to view only production traces:
| Attribute | Description |
|---|---|
workato.environment.id | The ID of the environment where the work ran. Present on every span. |
workato.environment.type | The environment type, such as dev. |
workato.workspace.id | The workspace ID. |
Recipes and jobs
Use the following attributes to find the trace for a specific job, or to compare runs of the same recipe over time:
| Attribute | Description |
|---|---|
workato.job.id | The job ID. |
workato.recipe.id | The recipe ID. |
workato.recipe.name | The recipe name. |
Steps
Use the following attributes to determine which step and which connector operation took the most time, or to locate a step in the recipe:
| Attribute | Description |
|---|---|
workato.connector_name | The connector the step uses. |
workato.operation_name | The connector operation the step runs. |
workato.full_operation | The connector and operation combined, such as logger.log_message, workato_decision_engine.execute_model, or workato_db_table.get_records. |
workato.step_line_number | The step's line number in the recipe. |
workato.step_kind | The type of step. Action steps have the value action. |
API platform
API platform spans carry the following attributes:
| Attribute | Description |
|---|---|
url.path | The path of the API recipe endpoint the client called. |
url.scheme | The protocol the client used, for example https. |
http.route | The endpoint's path template, with path parameters as placeholders, for example /orders/{order_id}. Requests to the same endpoint share one value. |
http.request.method | The HTTP method of the request, for example POST. |
http.response.status_code | The HTTP status code returned to the client, for example 200. |
MCP tool calls
The gen_ai.* attributes follow the OpenTelemetry GenAI semantic conventions. Use the following attributes to trace an AI agent's tool call to the job it started:
| Attribute | Description |
|---|---|
mcp.method.name | The MCP method. Tool calls have the value tools/call. |
gen_ai.operation.name | The GenAI operation. Tool calls have the value execute_tool. |
gen_ai.tool.name | The name of the tool the MCP client called. |
gen_ai.tool.call.id | The ID of the tool call. |
gen_ai.server.name | The name of the MCP server. |
workato.tool.id | The Workato ID of the MCP server. |
Event topics
Subscriber jobs start a separate trace that isn't linked to the publisher's trace. Steps that publish to an event topic include the following attributes:
| Attribute | Description |
|---|---|
workato.pub_sub.topic_id | The event topic ID. |
workato.pub_sub.message_id | The ID of the published message. |
Errors
A failed span has the status Error and an exception event with an exception.message attribute that contains the error message. Workato also sets the Error status on each block that contains the failed step and on the job span.
Troubleshooting
Use this section to resolve issues when traces don't arrive or don't appear as expected in your platform:
- No trace metrics in Datadog: Add the
compute_statsheader with the valuetrueto the HTTP connection. envshowsnonein Datadog:noneis Datadog's defaultenvtag. Filter onworkato.environment.typeto tell environments apart.- An API call starts a new trace instead of joining yours: Send your trace context in the
X-Workato-Customer-Traceparentheader, not thetraceparentheader. - Some tools report a missing root span: Jobs started by schedules and webhooks have a parent span that Workato doesn't export. Refer to Limitations.
Limitations
OpenTelemetry trace streaming has the following limitations:
- Trace time can differ from job time: A trace's total execution time can differ from the job's execution time in Workato because internal handovers between Workato services aren't included in the trace.
- Queue time isn't included: Traces start when a job begins to run, not when its trigger fires. Workato doesn't export the job span's parent for scheduled and webhook-triggered recipes, so some tools report that the trace has no root span.
- Event topic subscribers aren't linked: Publisher and subscriber recipes produce separate traces with no link between them.
- Asynchronous recipe functions run in their own trace: A span link connects them to the caller instead of showing them in the caller's trace.
- Large loops produce large traces: Loops produce one span for each iteration, so a loop with thousands of iterations produces a very large trace. Retention filters that you configure on your observability platform might aggregate these spans automatically.
- One collector URL: Each environment can stream to one collector URL.
- OTLP over HTTP only: Workato sends traces over OTLP/HTTP. gRPC isn't supported.
- Header authentication only: HTTP connections must use header authentication.
- Traces only: Workato doesn't send logs or metrics through OpenTelemetry trace streaming.
- Not traced: Data pipeline runs, MFT, and genie workloads.
Last updated: