# Insights
PRIVATE PREVIEW
Workato Insights is in private preview.
Private preview features are those that have passed the development phase and are now ready for customer testing. Our goal is to gather your input to ensure their reliable release in upcoming enhancements.
In the private preview release, Workato does not support import/export capabilities or deployments for Insights dashboards.
Insights is a data visualization and manipulation engine built into Workato and Workflow apps' no-code environment. It enables business users, IT professionals, and citizen developers alike to connect, manipulate, and visualize data, and make data-driven decisions, all within Workato.
You can build custom dashboards based on your automation data. This provides visibility to the value created by automation and bridges the gap between automation and analytics. Insights always displays data in real time, without a need for expensive ETL/ELT and BI (business intelligence) practices.
App analytics: Workato Insights can provide analytics on user-centric processes implemented as a Workflow app.
Sample metrics include:
- Of open tasks:
- Average user processing time
- The time a task spends in a certain status
- Of approval processes:
- Average time to approve
- Of employees onboarded last month:
- Average time to complete processing
- Of open tasks:
Usage analytics: Workato Insights can track how a Workato workspace is used, display recipe/task consumption, break down data by projects and environments, and show full job history for the workspace.
Sample metrics include:
Of recipes/jobs/tasks:
- The number of tasks consumed by a recipe
- The number of tasks consumed by each environment
- The number of active recipes in an environment
Full job history
- The total number of tasks consumed in a workspace
- The total number of active recipes in a workspace
Workflow performance: Workato Insights can provide analytics on how well your automated workflows perform.
Sample metrics include:
- Total amount of orders processed last month in an automated Order-to-Cash process
- Breakdown of orders by region
- Average order processing time
Data flow: Analyze the flow of data between connected applications and highlight trends, data volumes, and potential areas where you can improve your processes.
Operational analytics: Workato Insights can display how your workspace is used, including recipe success rates, and errors.
Sample metrics include:
- Error rates
- Job execution time
Automation impact: This feature can provide insights into how automation impacts your business processes and calculate ROI. This can include time/money saved, reduced manual errors, and increased operational efficiency.
Sample metrics include:
- Total amount saved ($)
- Hours saved last month by a specific process
- Savings by process or department
# How it works
Insights works in three main steps:
Select your main data source: Connect data from Workflow apps, data tables, recipe job history, or workspace usage.
Transform your data: Filter, sort, summarize the data sets, join them with other data sources, and perform other transformations using a no-code query builder.
Visualize your data: Display your data as interactive charts and organize them in dashboards using a WYSIWYG (what-you-see-is-what-you-get) editor.
# Example flow
Adding an Insights Dashboard to your Workflow app consists of two main steps:
- Add a new tab to your Workflow app.
- Create an Insights dashboard or assign an existing dashboard to your Workflow app.
To add an Insights dashboard to your Workflow app:
Select a project that contains an existing Workflow app.
In the App tab, navigate to the Interface section of the page and click + (plus) to add one or more additional tabs to your app.
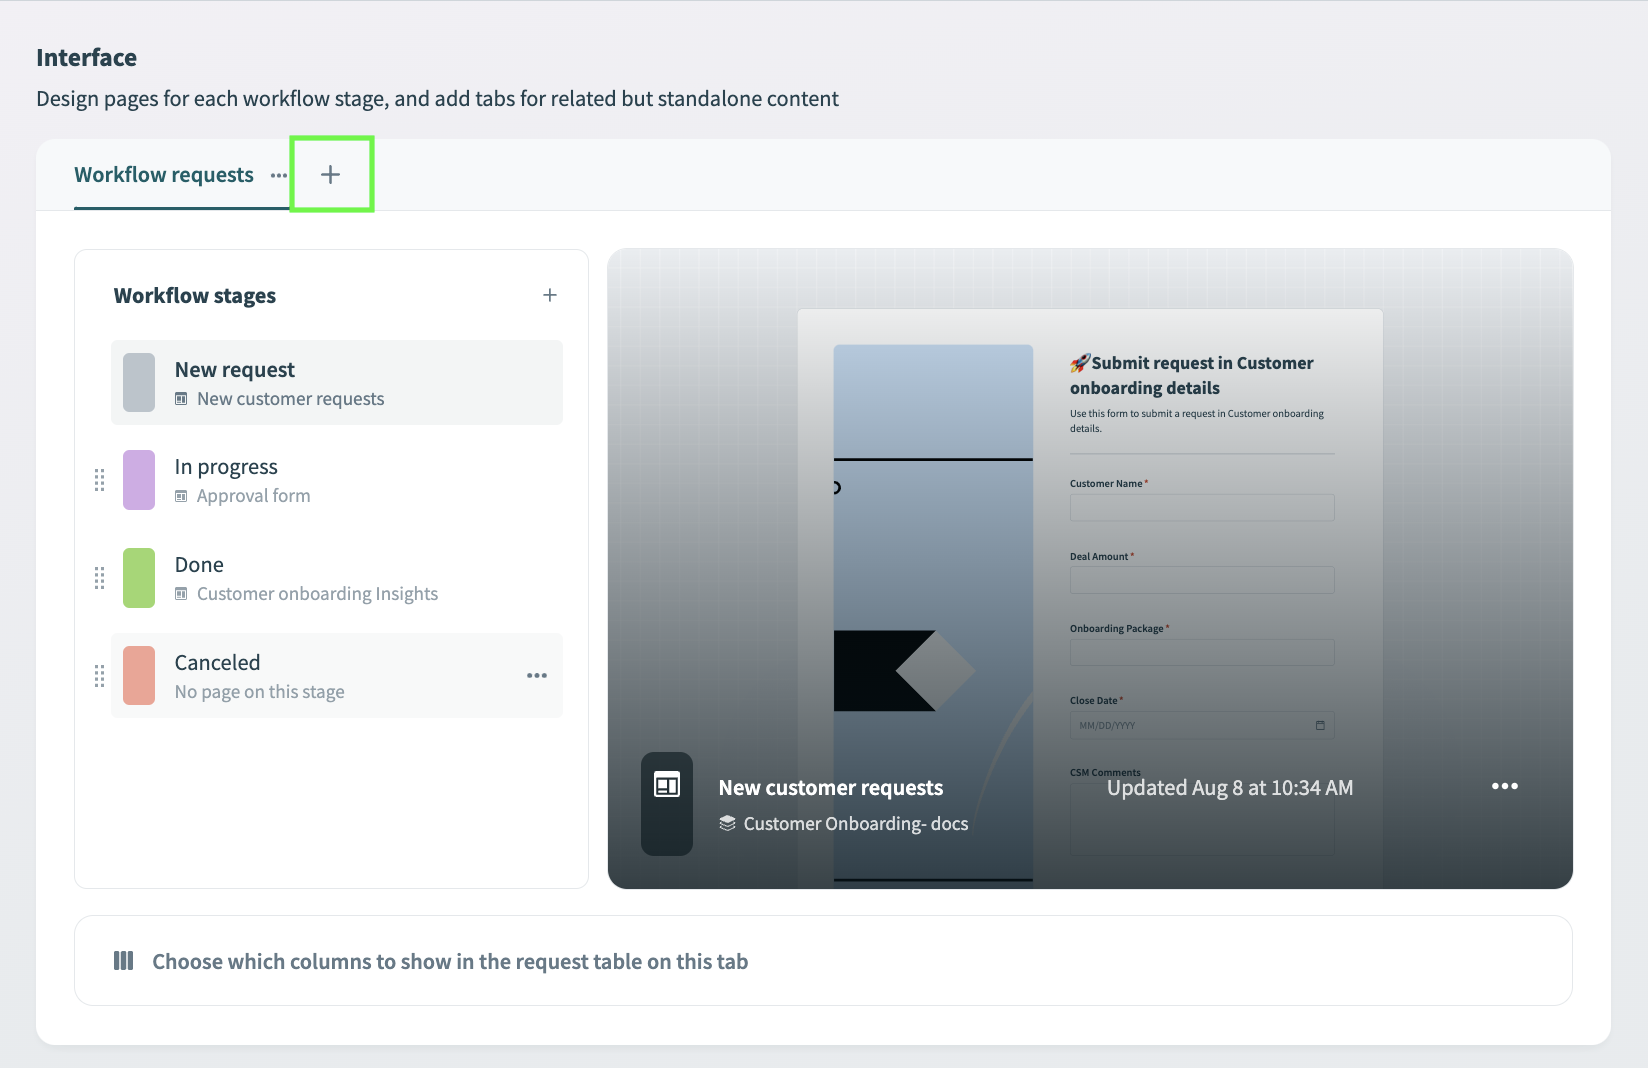 Add tabs
Name your tab and configure which users can view this tab in the Workflow apps portal by filling out the Tab name and Display column to fields.
Reference our tabs documentation to learn more.
Click Create page to add a new Insights dashboard to your new tab.
Alternatively, click assign existing pages to assign an existing dashboard to your tab.
Select Dashboard from the list of page templates.
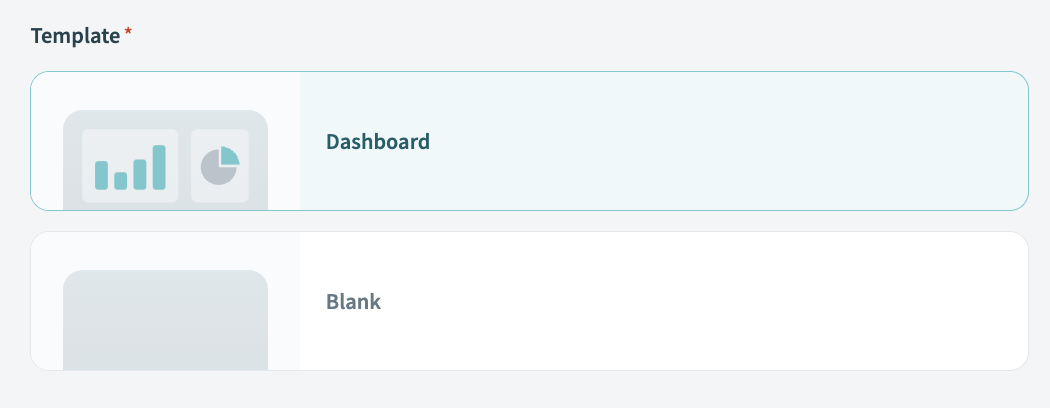 Select the dashboard template
Drag and drop chart components to your page in the page editor.
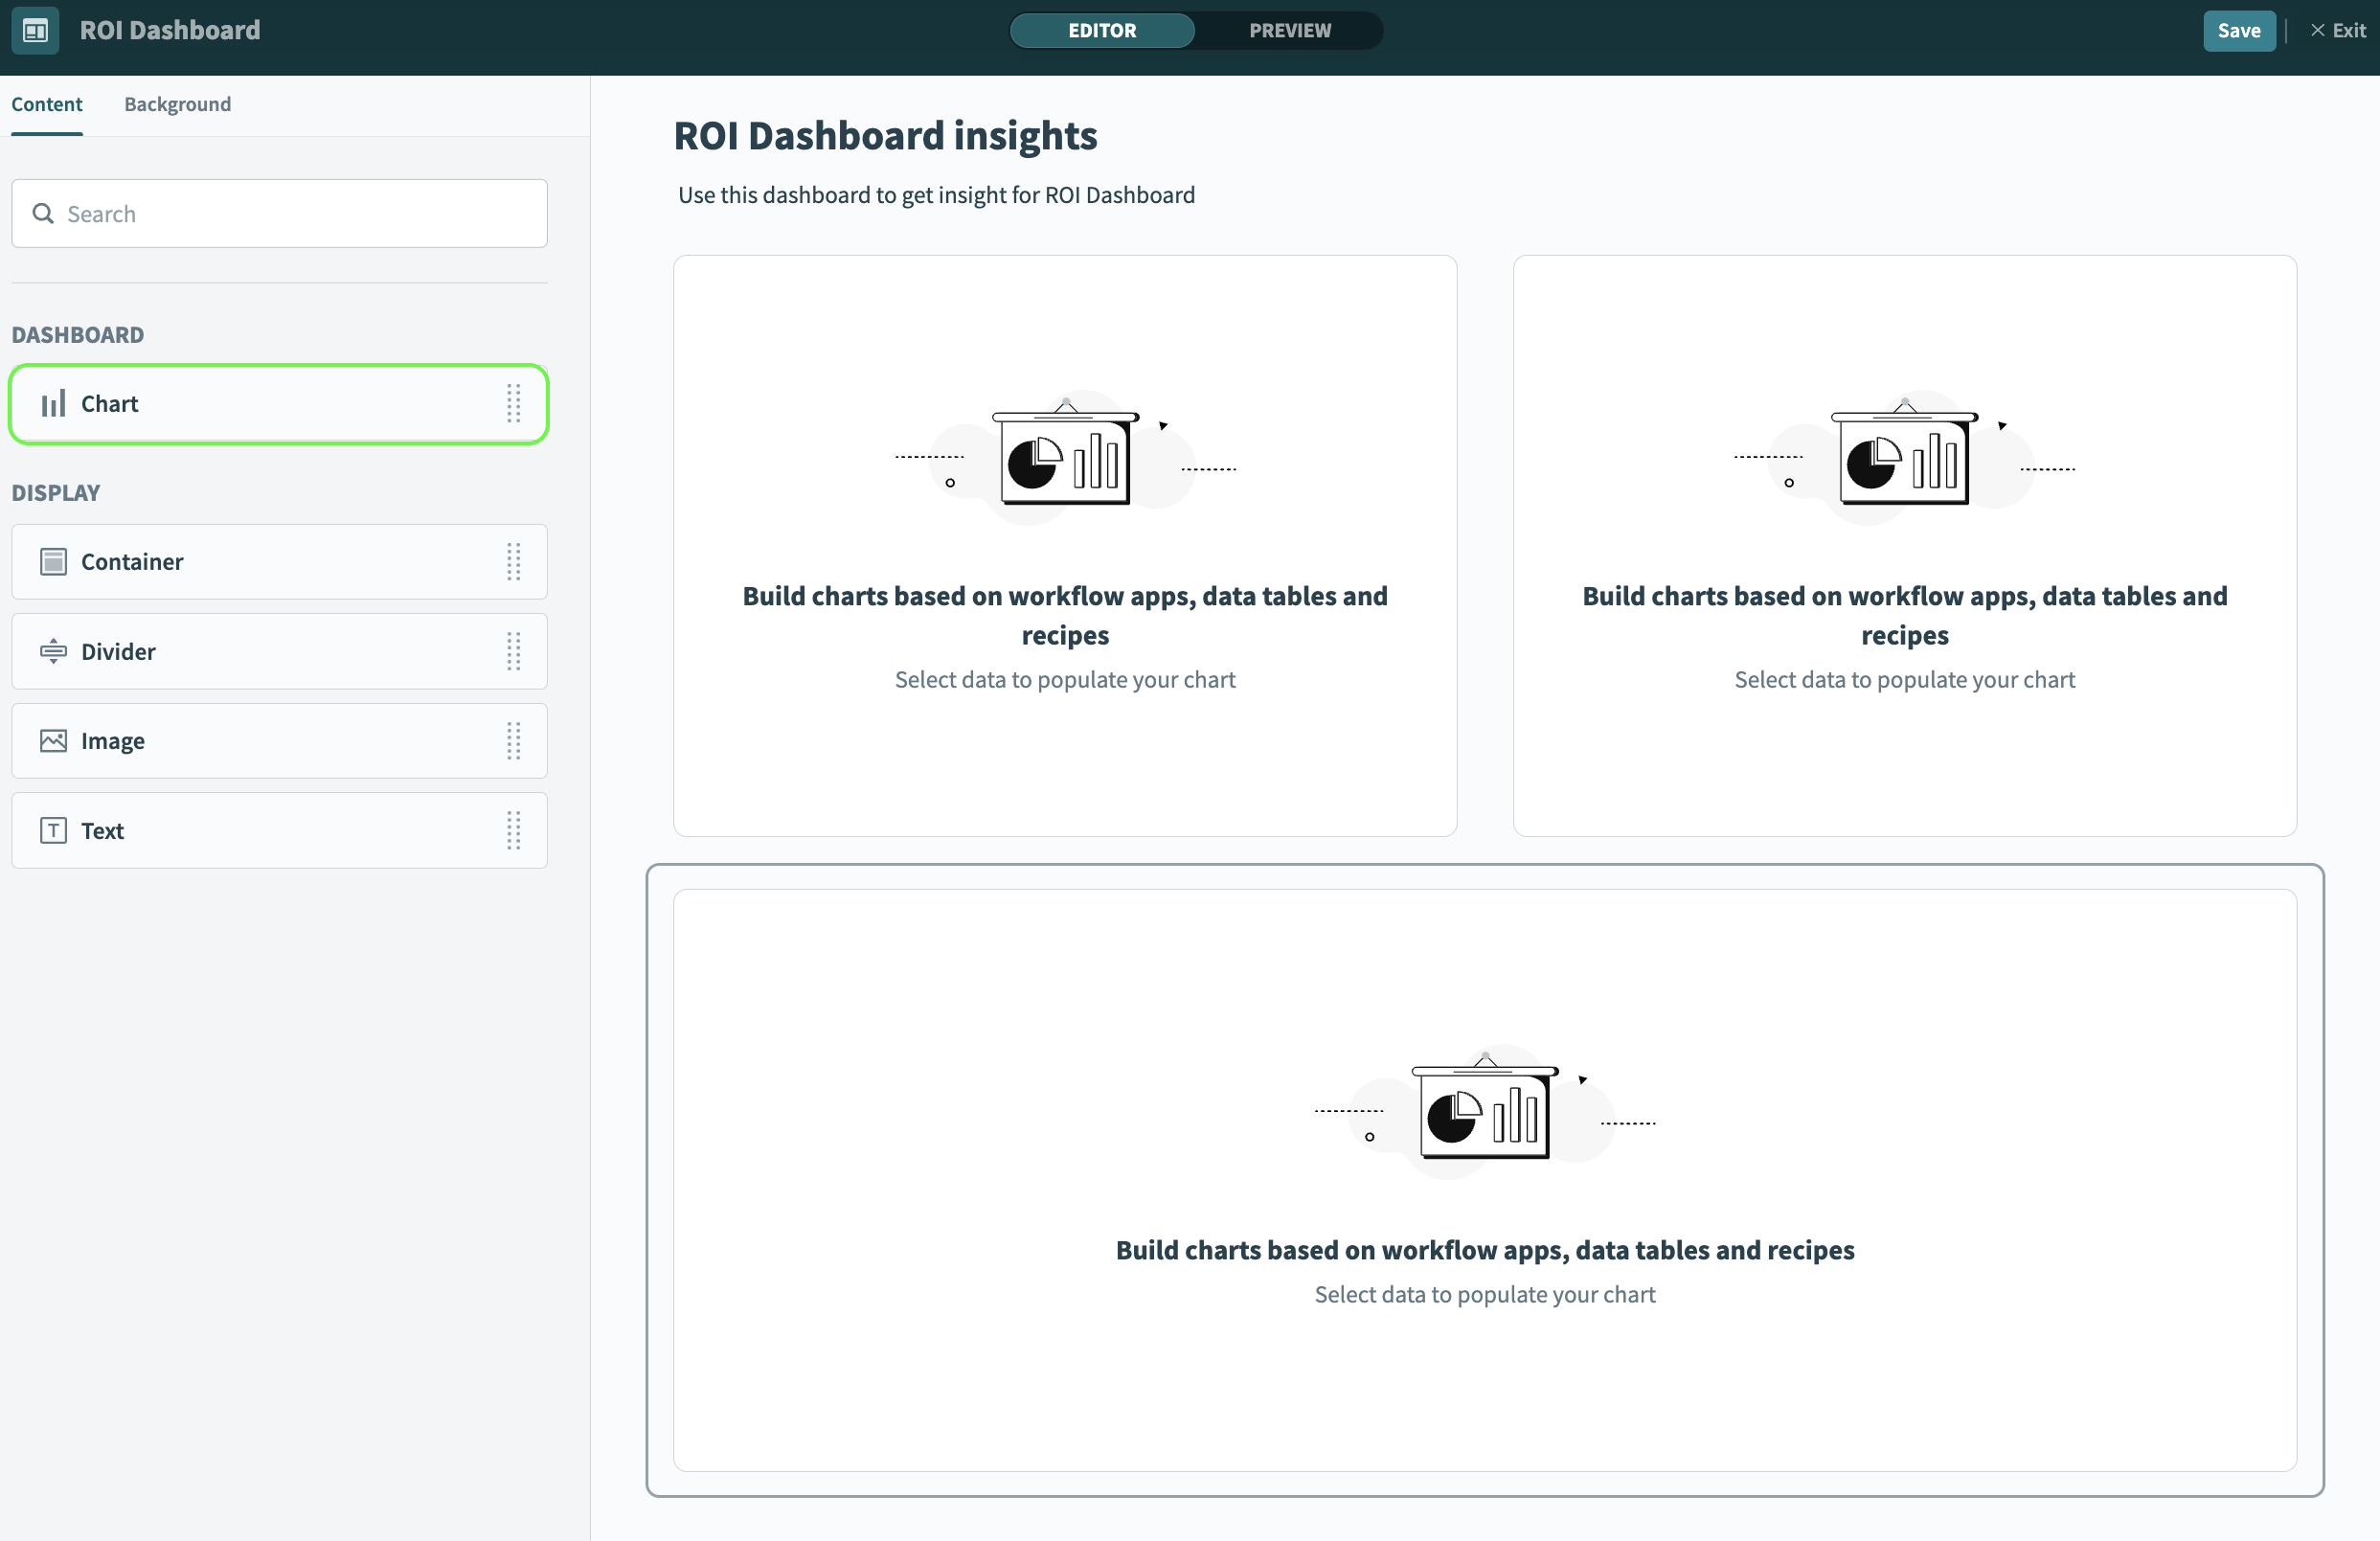 Add chart components
Select a data source from the list of supported sources.
After you select your data source, Workato displays your data as a table by default.
Perform queries on your data. Workato previews the results table for the query you make.
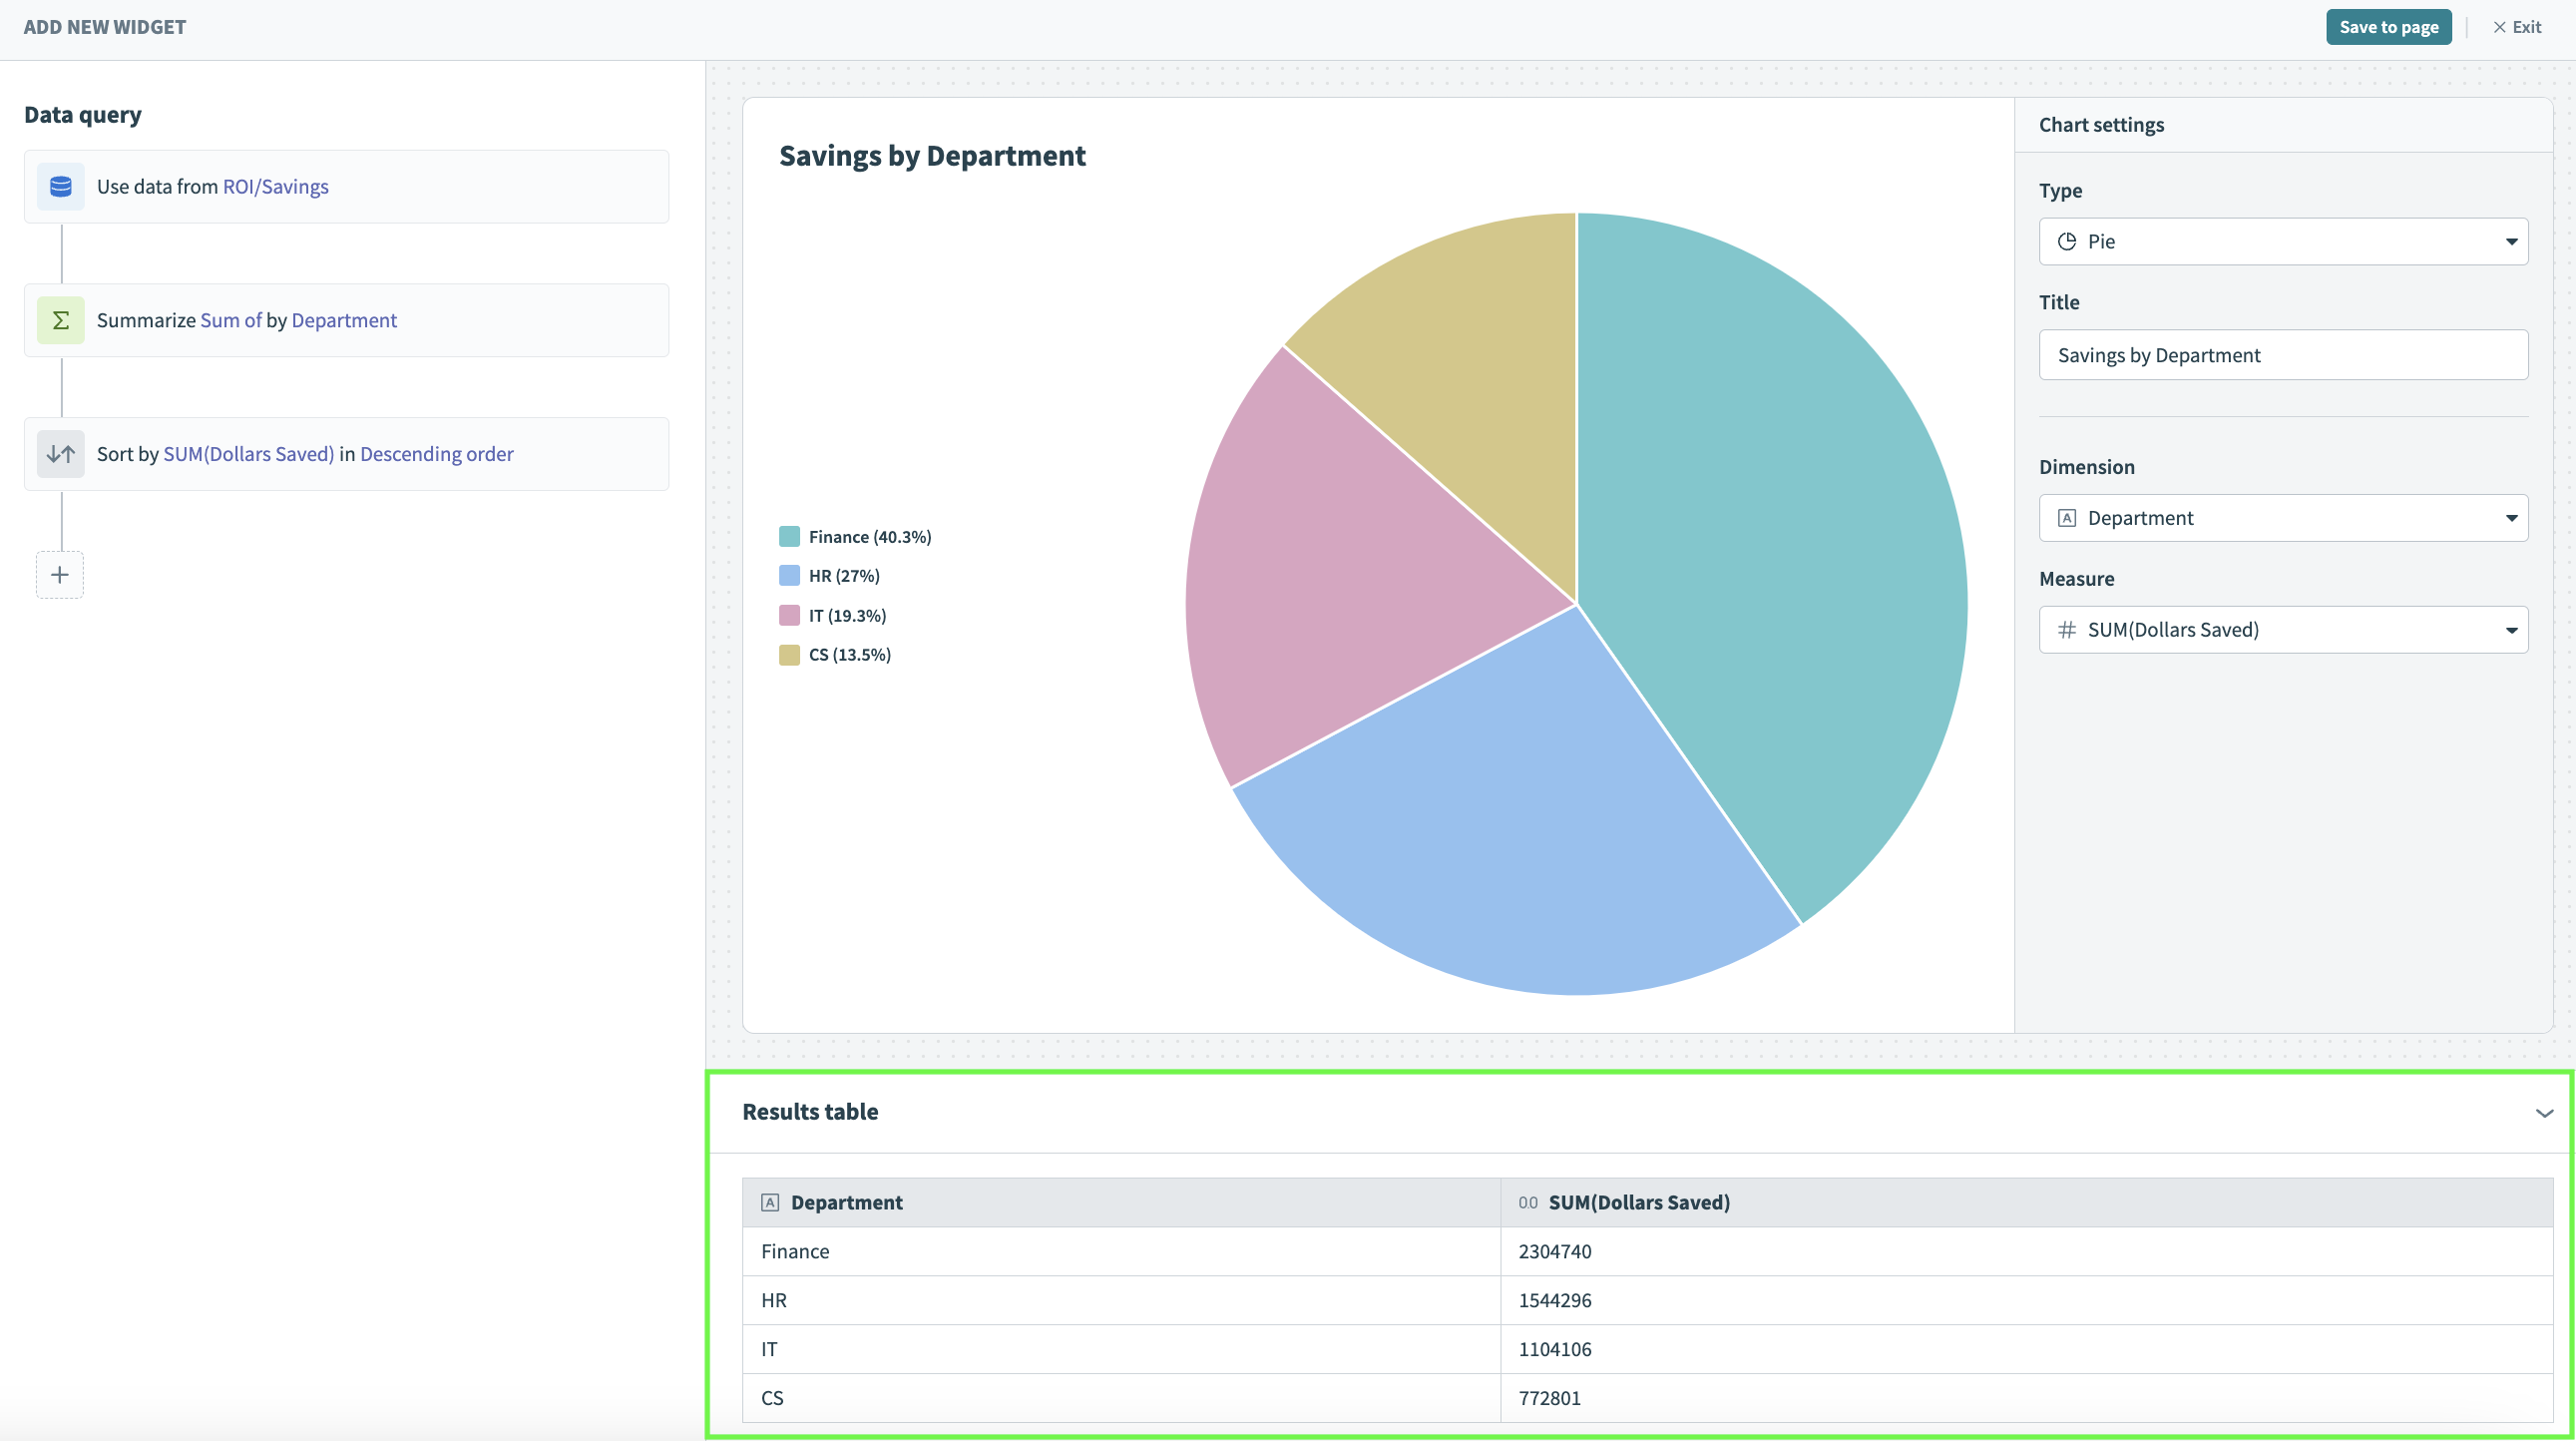 Results table
Determine the type of chart you plan to build. Workato previews the auto-generated chart for the data source you select.
Configure Chart settings to customize your chart. Chart settings are dynamic and depend on the chart type you select.
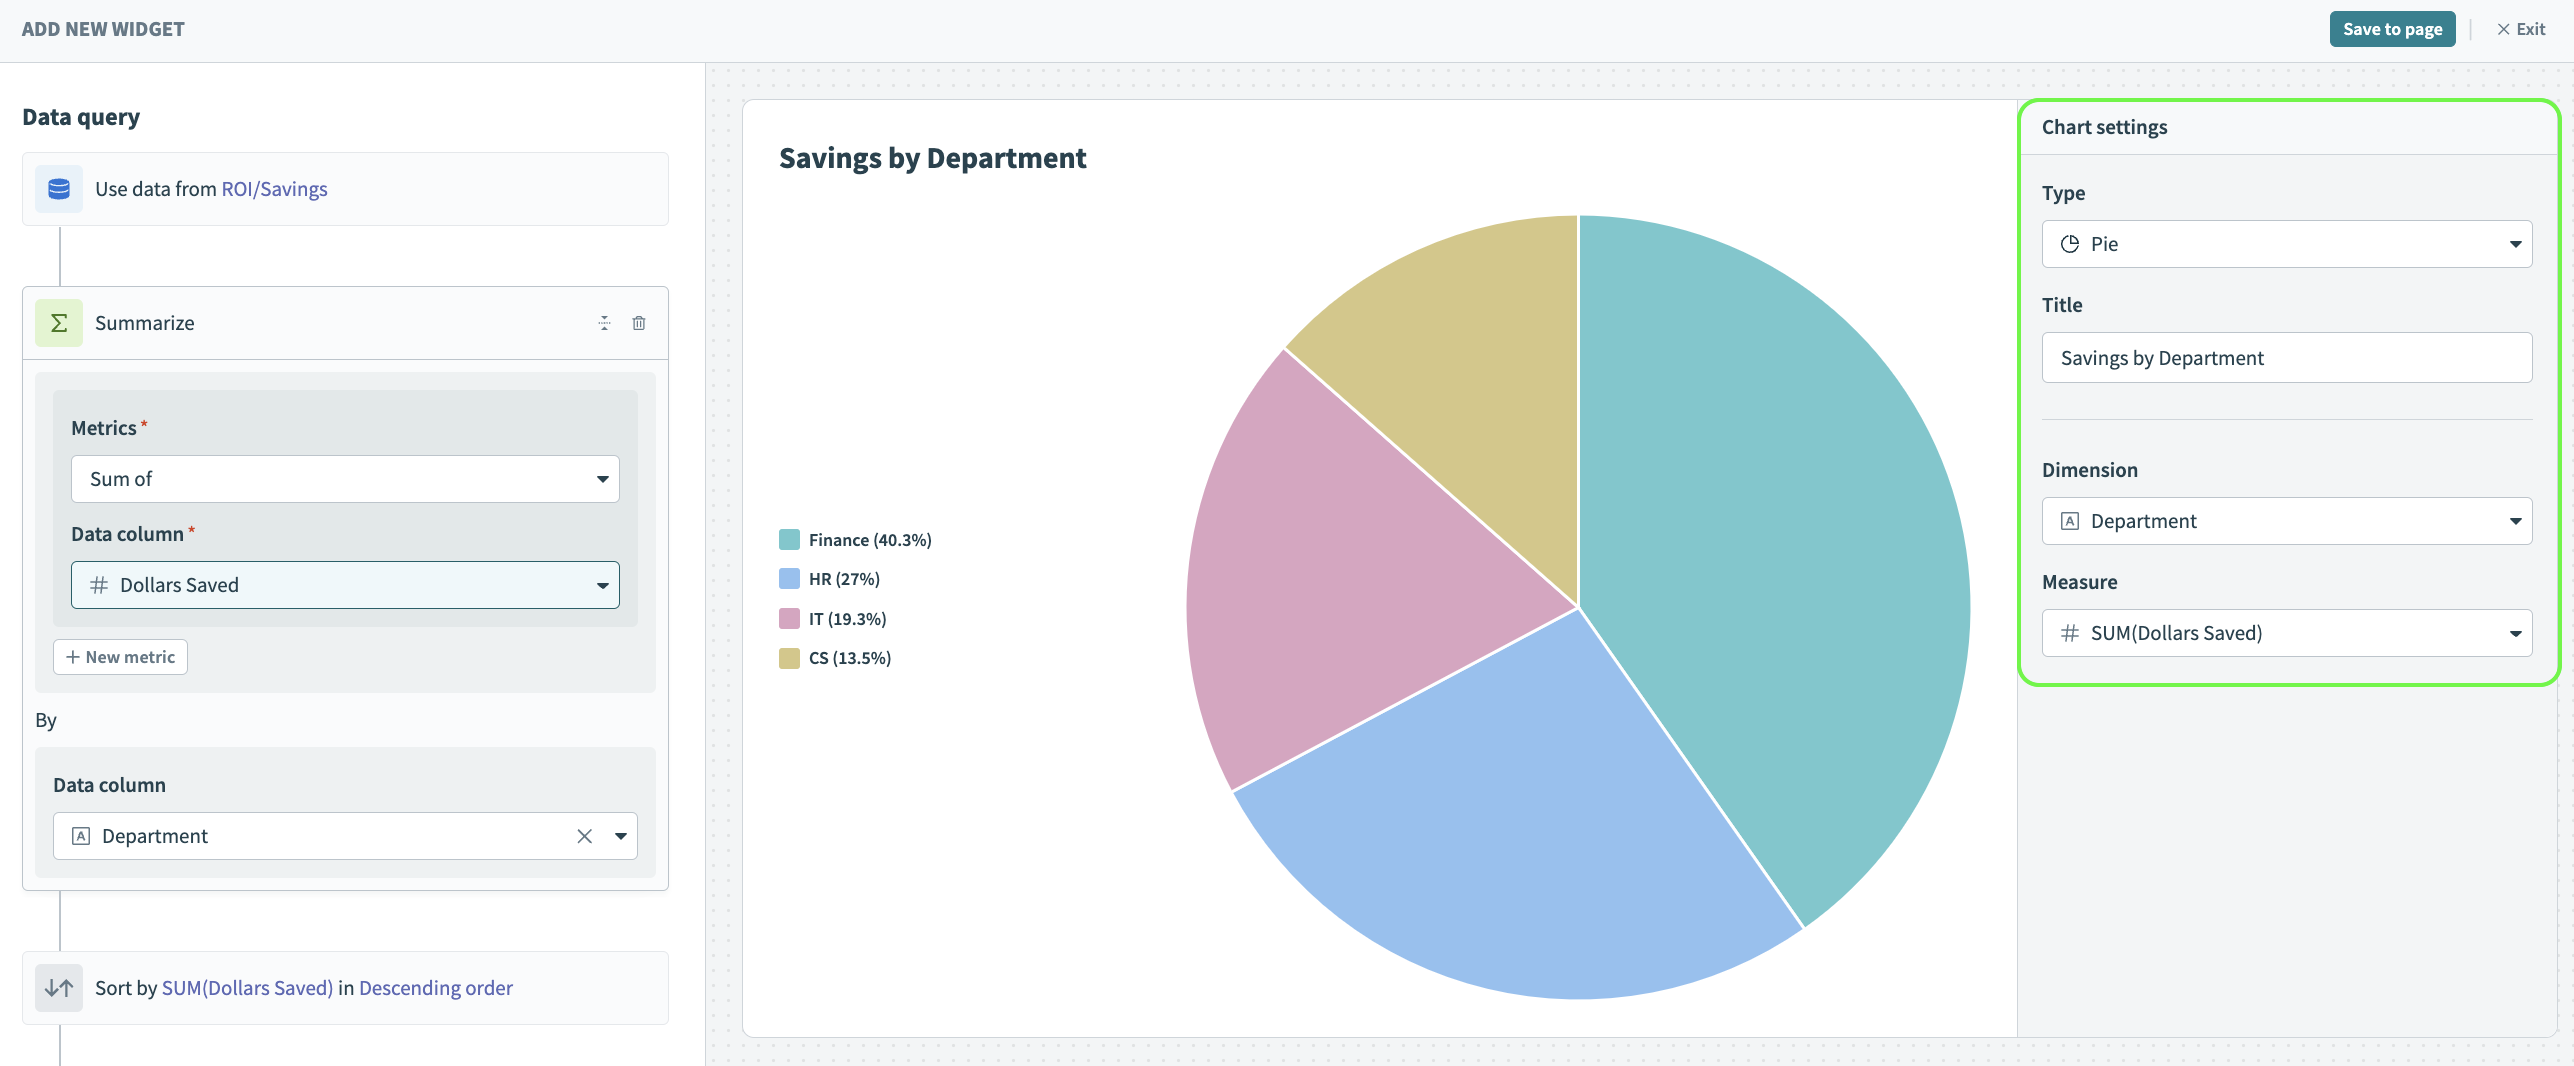 Chart settings
Save your chart to your dashboard.
After you finish editing your page, click Save and Exit to navigate back to the app settings page.
After you have assigned an insights dashboard to your app it appears in the Workflow apps portal as a separate tab.
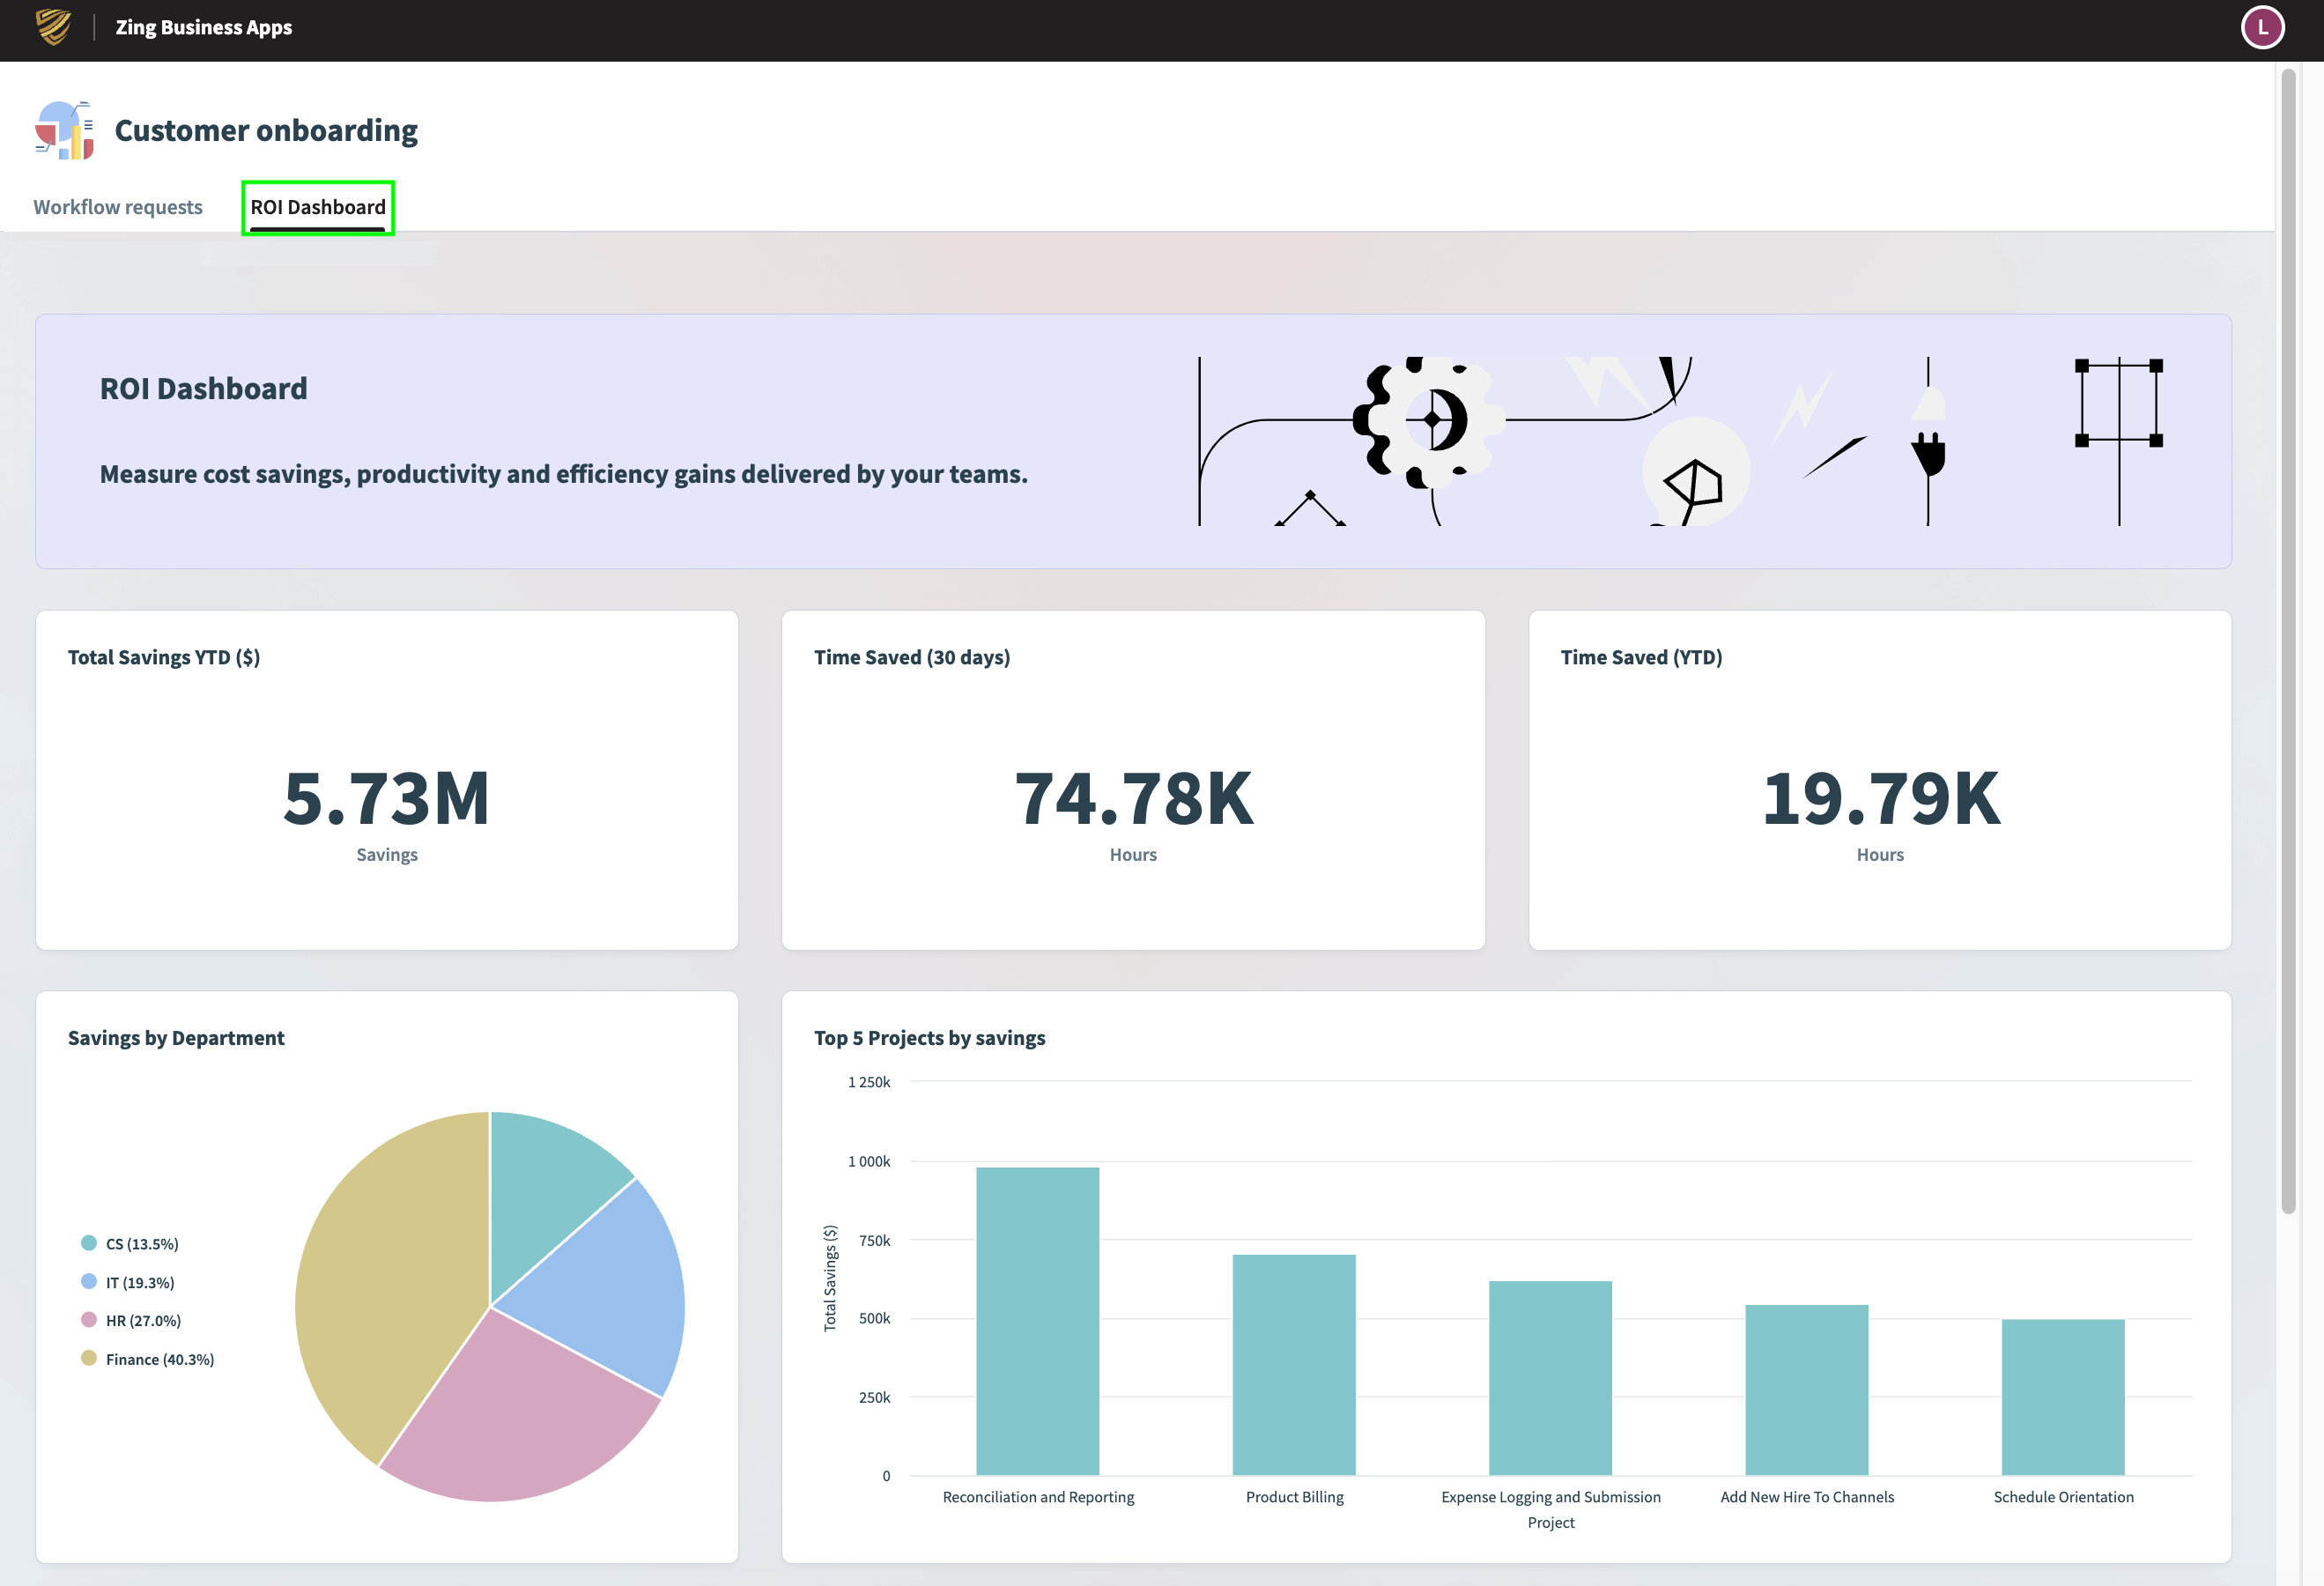 Insights dashboards appear as a separate tab in the Workflow apps portal
# Usage inspiration
Build custom dashboards to visualize your data for a variety of scenarios. Insights is particularly useful in performing the following automation analytics:
Usage analytics: How are we using Workato platform?
- The number of active recipes- overall and segmented by project or environment
- Recipes consuming most tasks
- The number of tasks consumed by particular recipe - overall and over time
- The number of tasks consumed broken down by recipe, project, or environment - overall and over time
- Recent errors in recipes
Process analytics: How does my automated business process perform?
- The number of orders processed
- Average user processing time
- Time spent in a certain status
Operational analytics: How does my automation work?
- The number of recipes/jobs/tasks
- Error rate
- Execution time
Efficiency analytics: How efficient is my automation?
- ROI
- Time savings
- Adoption rates
For example, you can build a dashboard to visualize your ROI (return on investment) and provide actionable analytics that helps you understand how your business performs. From here, you can plan corrective actions to increase your operational efficiency and productivity.
Sample ROI dashboard:
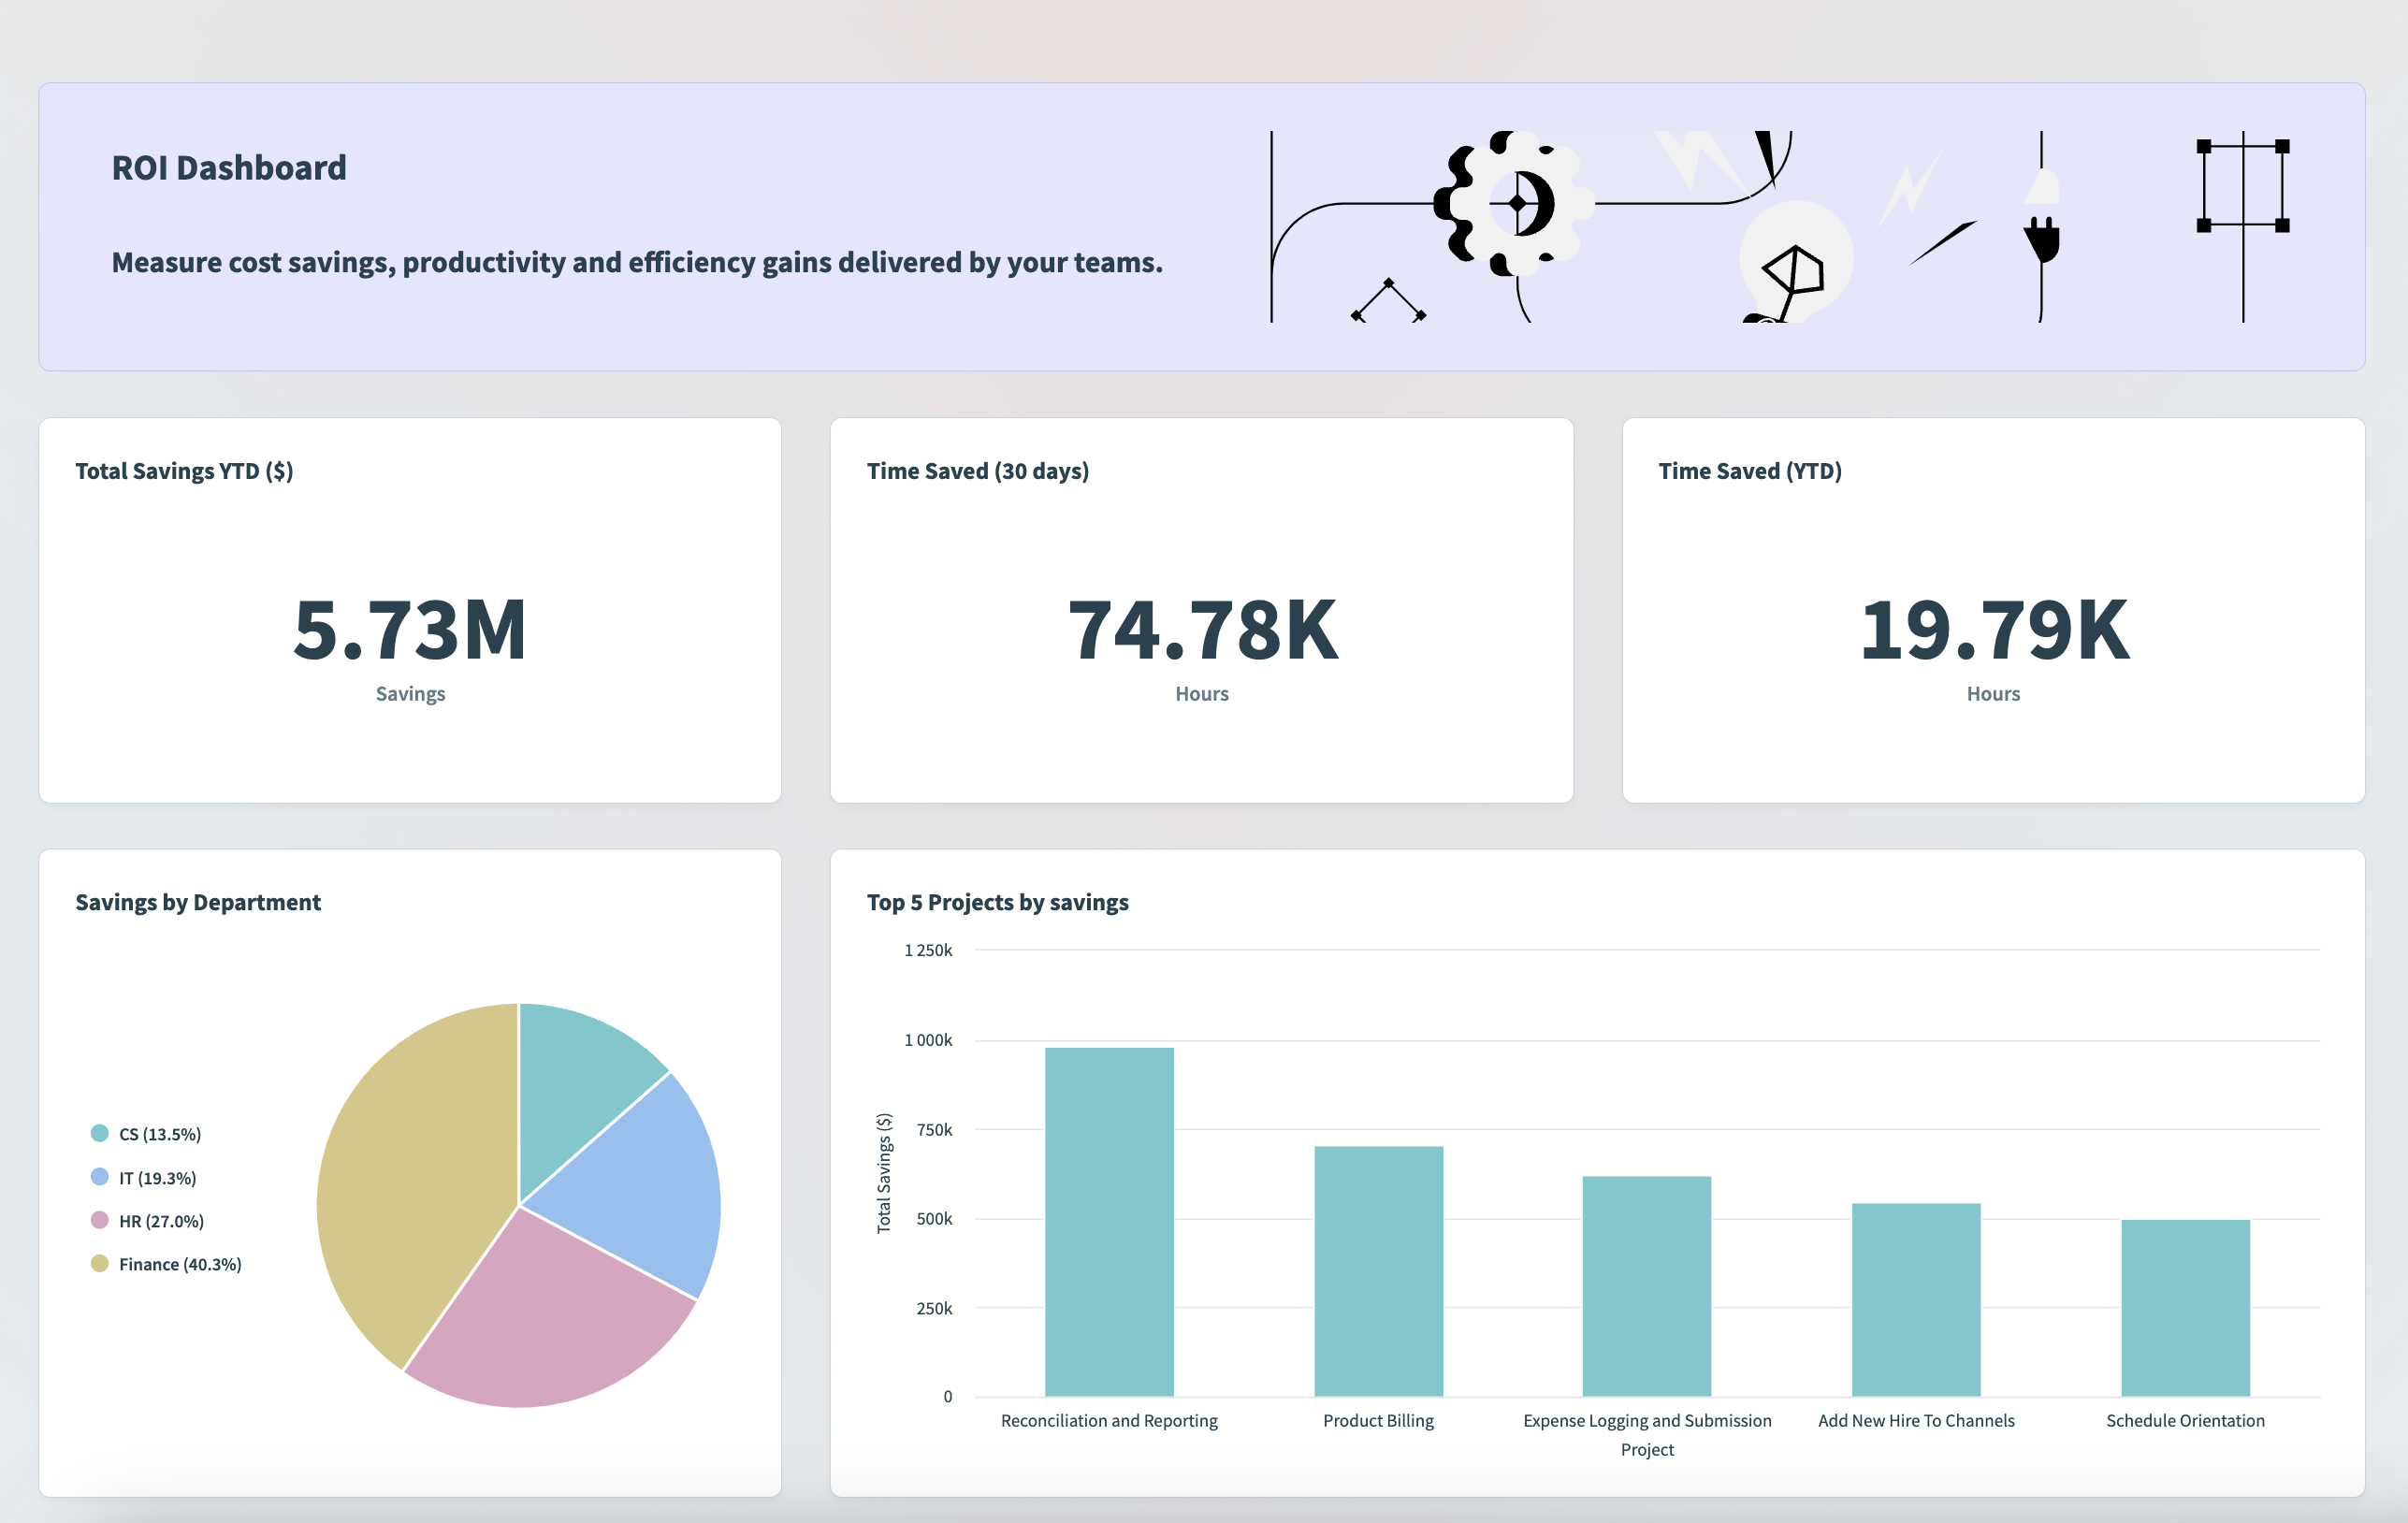 Sample ROI dashboard
# Supported data sources, queries, and charts
# Data sources
Connect your data from the following supported data sources:
- Workspace usage
- Projects in all environments
- Recipes in all environments
- Job history with full job list of your entire workspace
- Individual recipe job history with custom columns
- Data tables
- Workflow apps
# Queries
Transform and prepare your data: Retrieve, analyze, and utilize the information stored in your data sources using the following queries on your data:
- Filter by
- Summarize
- Join to
- Sort by
- Row limit to
# Charts
Visualize your data: Display data points, trends, patterns, and relationships by adding charts to your dashboard.
Insights supports the following chart types:
- Table (default)
- Line graph
- Bar graph
- Pie chart
- Number graph
FURTHER READING
Last updated: 2/13/2024, 6:54:36 PM