Debugging your connector
Defining your connector's actions is one thing, but debugging your connector - like any other software project - is a crucial part of the journey. To facilitate this, our connector SDK has two options, each with its own benefits.
| Tool | Description |
|---|---|
| SDK Test code tab | Available directly on the Workato platform. No setup is required. Test individual actions, triggers, and connections, and debug UI elements for Workato schema. |
| SDK CLI tool | Build and debug directly from your own local machine. Minimal setup needed. Test individual lambdas like object_definitions, pick_lists, and methods or entire actions, triggers, or connections. No UI-level debugging. Ability to write automated unit tests. |
Depending on your situation, both tools may be necessary. For simpler builds, however, the Test code tab should suffice and is the focus of this guide. Refer to our CLI reference to learn more about the SDK CLI.
The Test code tab
Testing your code is an essential step in building a new connector. It's good practice to test frequently as you build various components of your connector, such as after establishing an API connection or when making changes to actions and triggers.
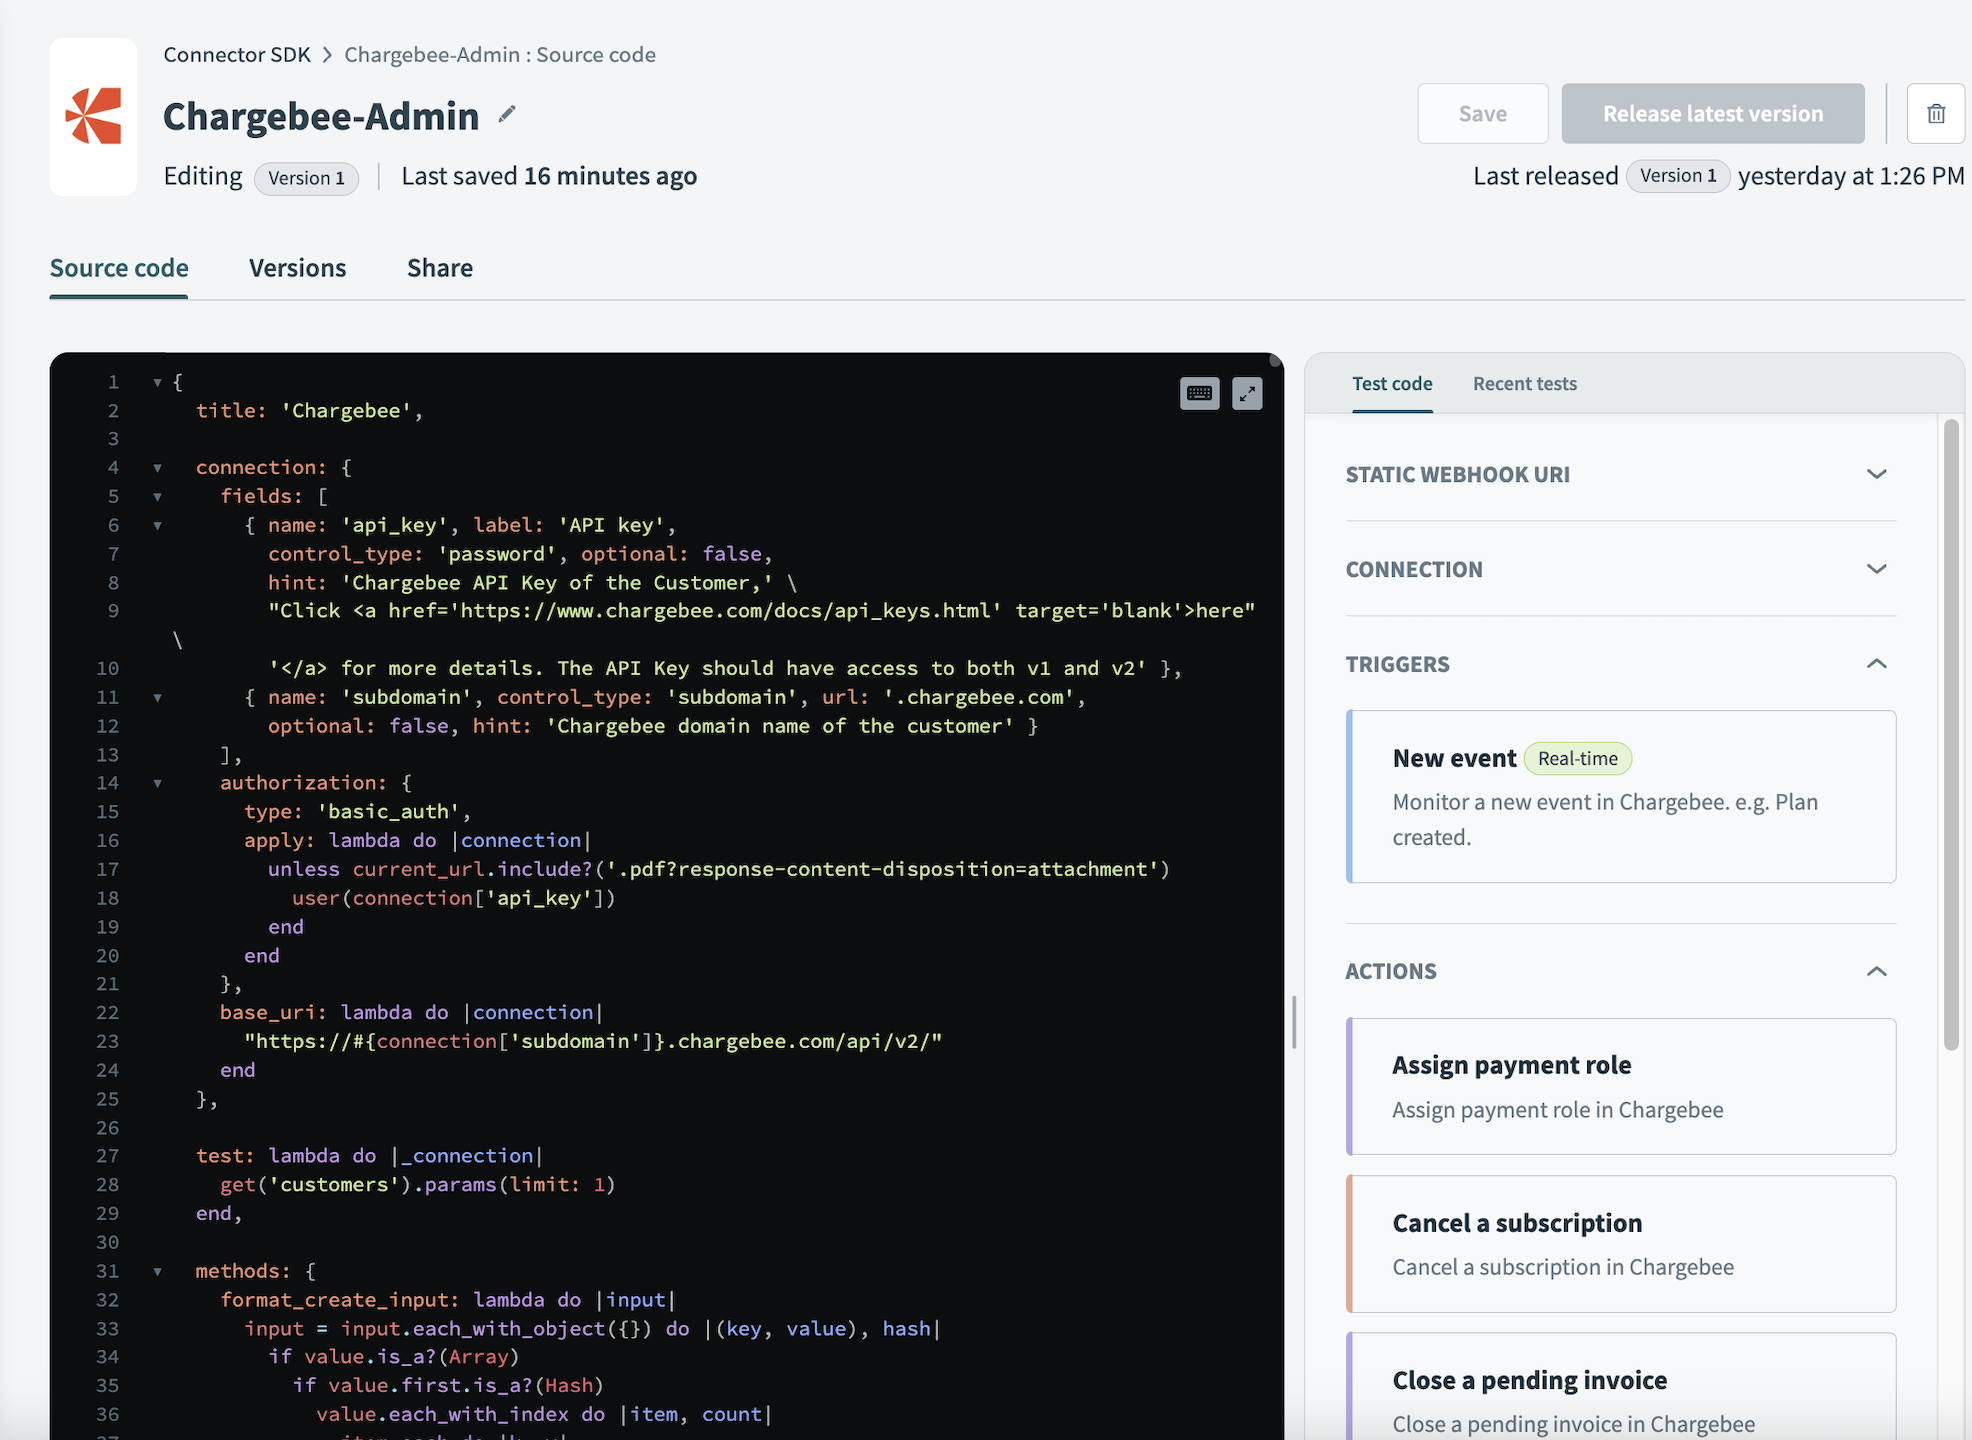 To find the Test code tab navigate to Tools > Connector SDK, select the connector you plan to use, and click on Source code > Test code.
As you make code changes to your connector, our Test code tab helps you debug the most recent code changes. To ensure that we are always working off the latest version, we save your work automatically.
SAVE WITH HOTKEYS
Use cmd + s to save the latest version of your connector.
Debugging connections
All connector builds start with building and debugging your connection to an API. Actions and triggers are not available until a successful connection is made. To establish a connection, navigate to the Connection tab under the Test code tab, select an Auth type, enter the requisite fields, and click Connect.
The Test code tab provides a log of the connection attempt under the Recent tests tab. Logs include the input parameters, the output, and any resulting error messages or HTTP requests.
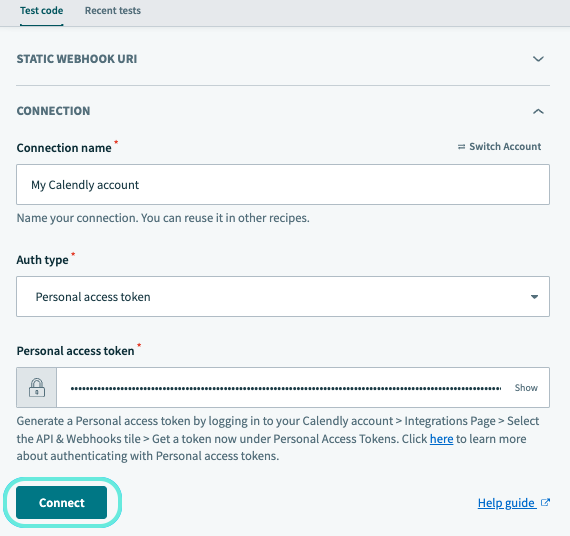 An API connection using Personal access token as the Auth type
Debugging connection fields
Any fields defined in the fields attribute of your connection hash appear when saved.
Logs contain the following tabs:
Input - This tab contains inputs that were passed to the connection from the input fields, formatted as JSON. 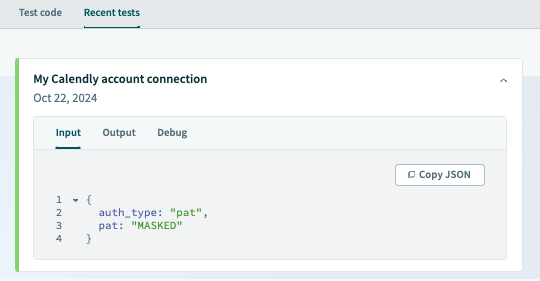
Output - This tab contains the JSON representation of the connection output, which is utilized by various lambda functions within the connector, such as: connection, execute, object_definitions, and more. 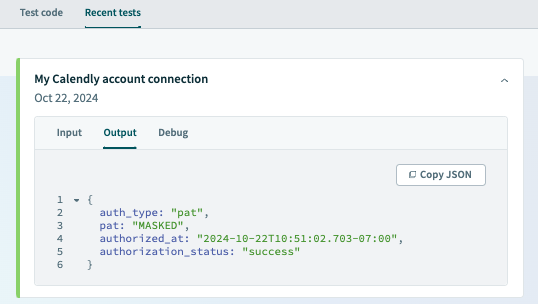
Error - This tab is only shown when the connector encounters an error. Errors occur when you use a method to raise an error or when an API request has responded with a non 2XX response code. Find out more about raising errors manually. 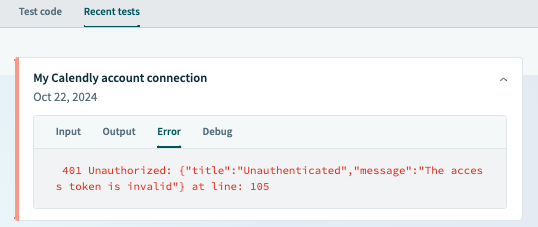
Debug - This tab showcases any HTTP requests made during the authentication flow. HTTP requests are printed in the order they are executed. 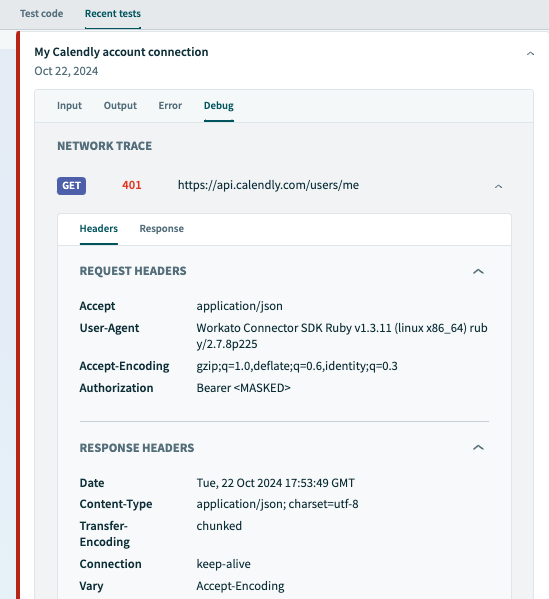
In the preceding image, the debug trace is generated from this request sent within the test block:
test: lambda do |_connection|
    get('/users/me')&.
      after_error_response(/.*/) do |_code, body, _header, message|
        error("#{message}: #{body}")
      end
  end,
Console - This tab contains information regarding puts methods that were executed during the test of your action and trigger. The puts method signals to the console to print a specific variable. These puts can also be printed from code in pick_lists, object_definitions and methods. This can be useful for debugging by printing variables from your code. Console logs are printed in the order they are executed. 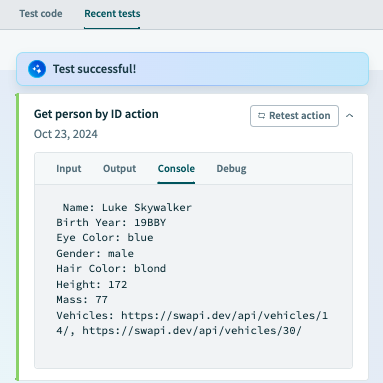 The result of printing several variables using
 puts
Debugging triggers and actions
WARNING
Debugging of webhook triggers is not supported on our Test code tab at this time. To debug webhook triggers, we suggest using the SDK CLI.
Debugging triggers and actions allow you to debug two main portions:
- The UI of the operation as if you were using it in the recipe editor
- The actual execution of the operation
For the UI of the operation, clicking on the action or trigger will display a stub in the recipe editor. This allows you to see all the relevant input fields and output datapills that you have defined in your actions and triggers.
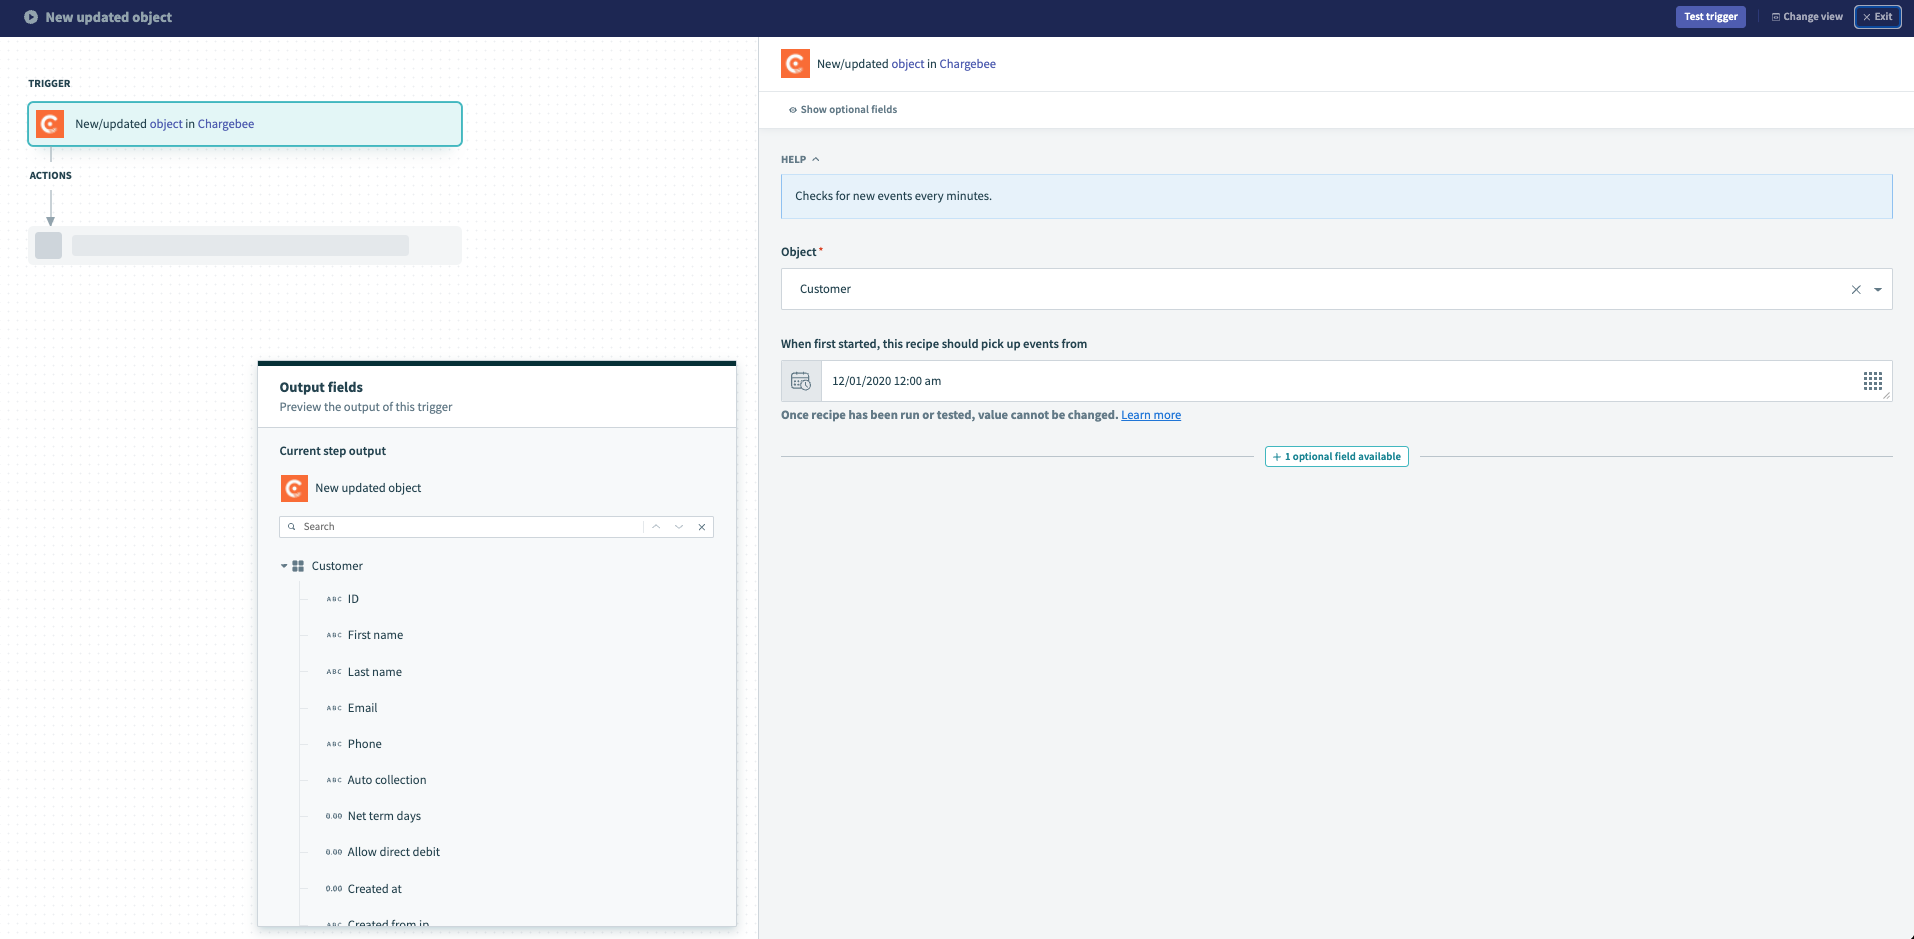
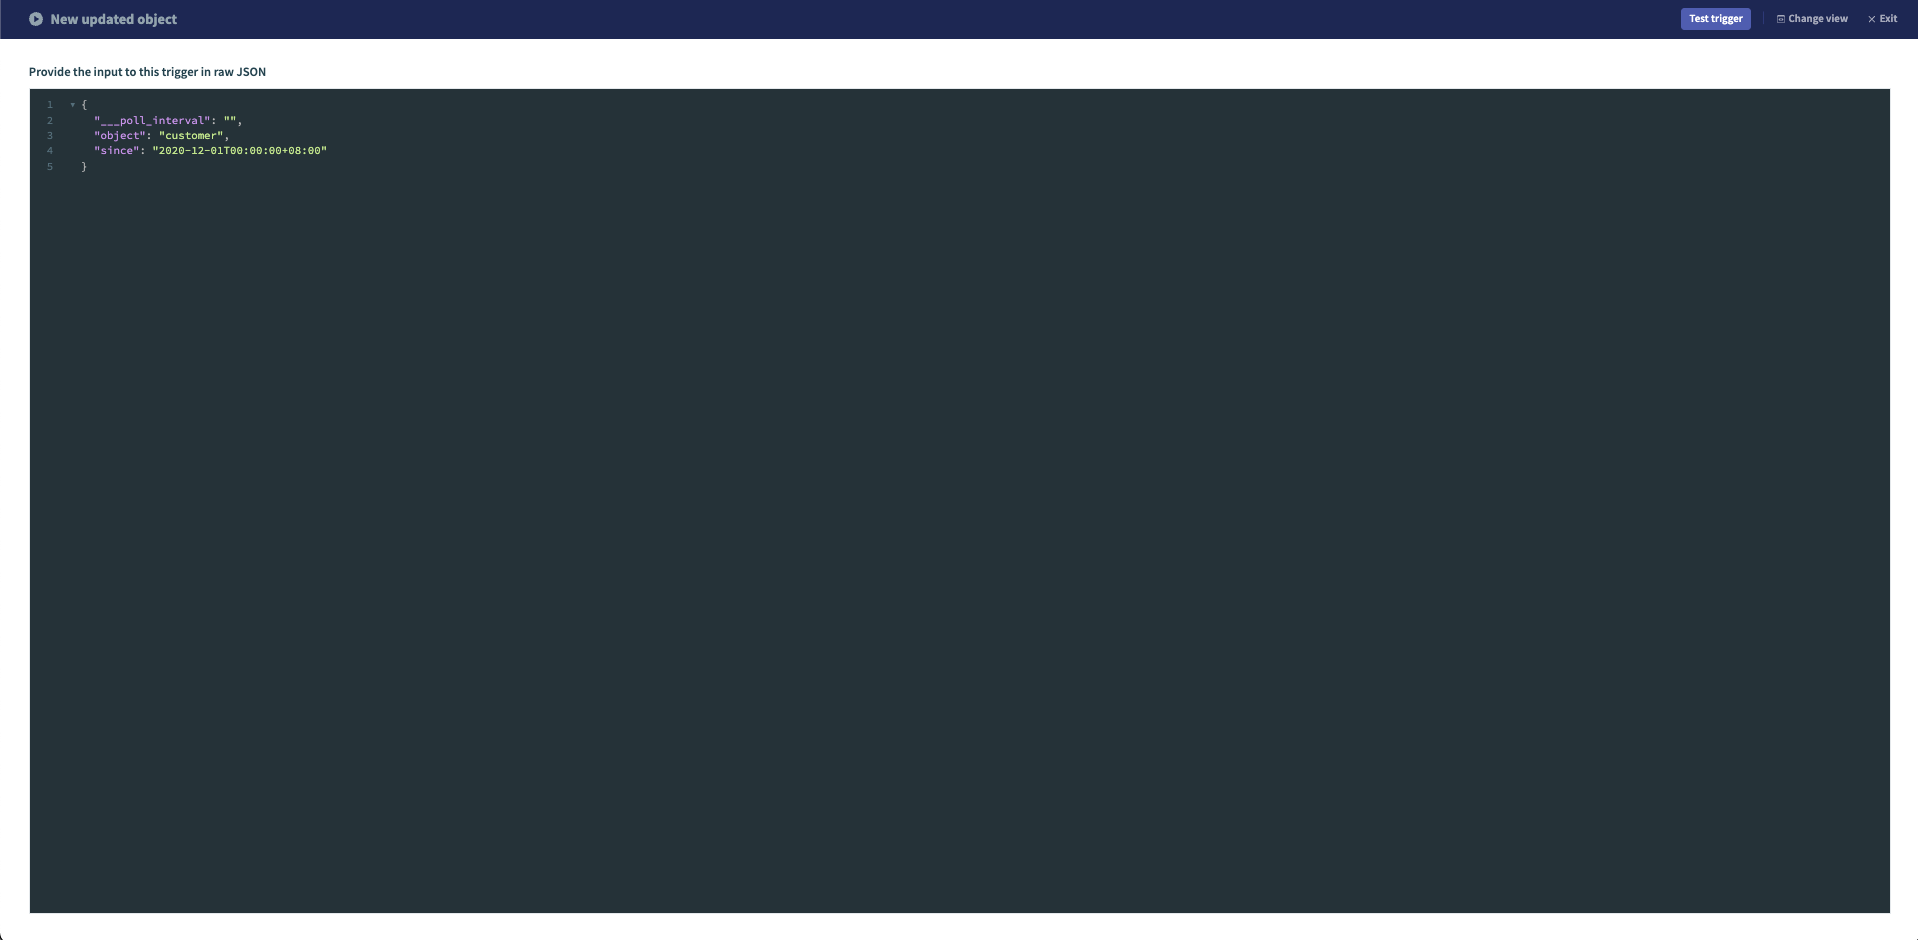
In this view, you'll be able to see any dynamic inputs or output fields as you change the inputs given in the Test code tab's UI. Optionally, you can also switch to the Raw JSON view to provide the input JSON for your action directly. This is useful when you are debugging an action or trigger where you have the inputs from the recipe itself. You can toggle to raw JSON view in the top right-hand corner of the UI popup under Change view.
When you're done, click Test to execute the operation. For polling triggers, this executes the poll block to simulate the first poll of the trigger. For actions, this simulates the execute block. After the code has been executed, the Test code tab displays a log of the test under the Recent tests tab.
Output - There are some slight differences between the output for triggers versus actions:
- Actions: This will be the normal output which is naturally passed as the output of the job. It is further matched with the
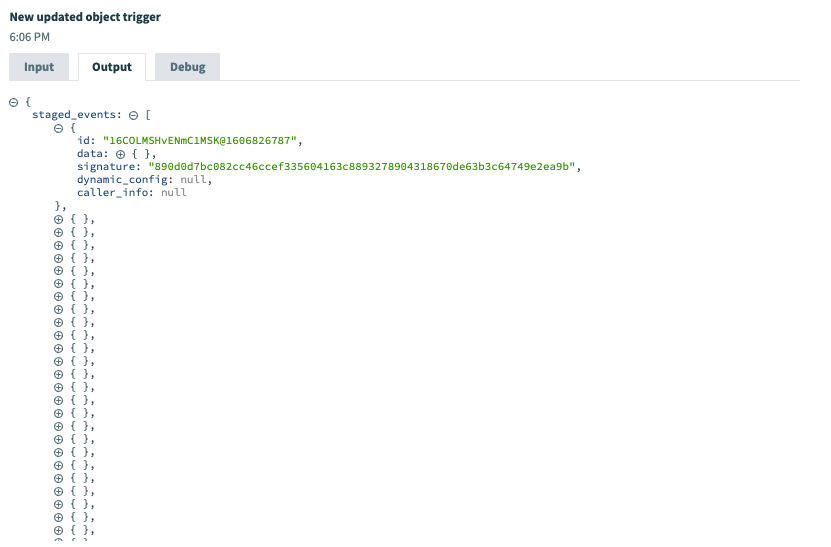
namevalue in each datapill you have defined so users can map datapills to further downstream actions. - Triggers: An important distinction for triggers is that a single trigger poll may produce multiple jobs. If this sounds unfamiliar, please read our guides on polling triggers. As such, the output of a trigger test will highlight a few things, such as the
eventsandstaged_eventswhich are synonymous with the array of records that are turned into individual jobs. Each index in the array corresponds to a single job. Aside from that, you will also be able to see the outcome ofcan_poll_moreas well as theclosurewhich is passed to the next iteration of the poll.
Limitations
Picklists, methods, and object_definitions
Testing individual pick_lists, methods and object_definitions are not supported in the Test code tab. However, a simple workaround is to create a sample test action that can tests these pick_lists before you use them in your intended actions/trigger.
For example:
actions: {
    test: {
      execute: lambda do |connection, input|
        # Print the output of the sample method to see if it works as intended
        puts call(:sample_method)
      end
    },
}
Formula mode and arrays of primitive types
Formula mode does not work in the UI popup today and this feature is disabled. However, in some cases, you can see some fields that use formula mode by default such as arrays of primitive types. For example
input_fields: lambda do
    [
        {
            name: "customer_ids",
            label: "Array of customer IDs",
            type: "array",
            of: "string"
        }
    ]
end
In situations like this, you must use the raw JSON view of the Test code tab to provide your inputs manually.
Last updated: