Use the Test code tab
The SDK Test code tab is located within the Source code tab. The Test code tab enables you to test the connections, actions, and triggers in your connector before releasing it. The Test code tab also allows you to run tests on the latest version of your custom connector code.
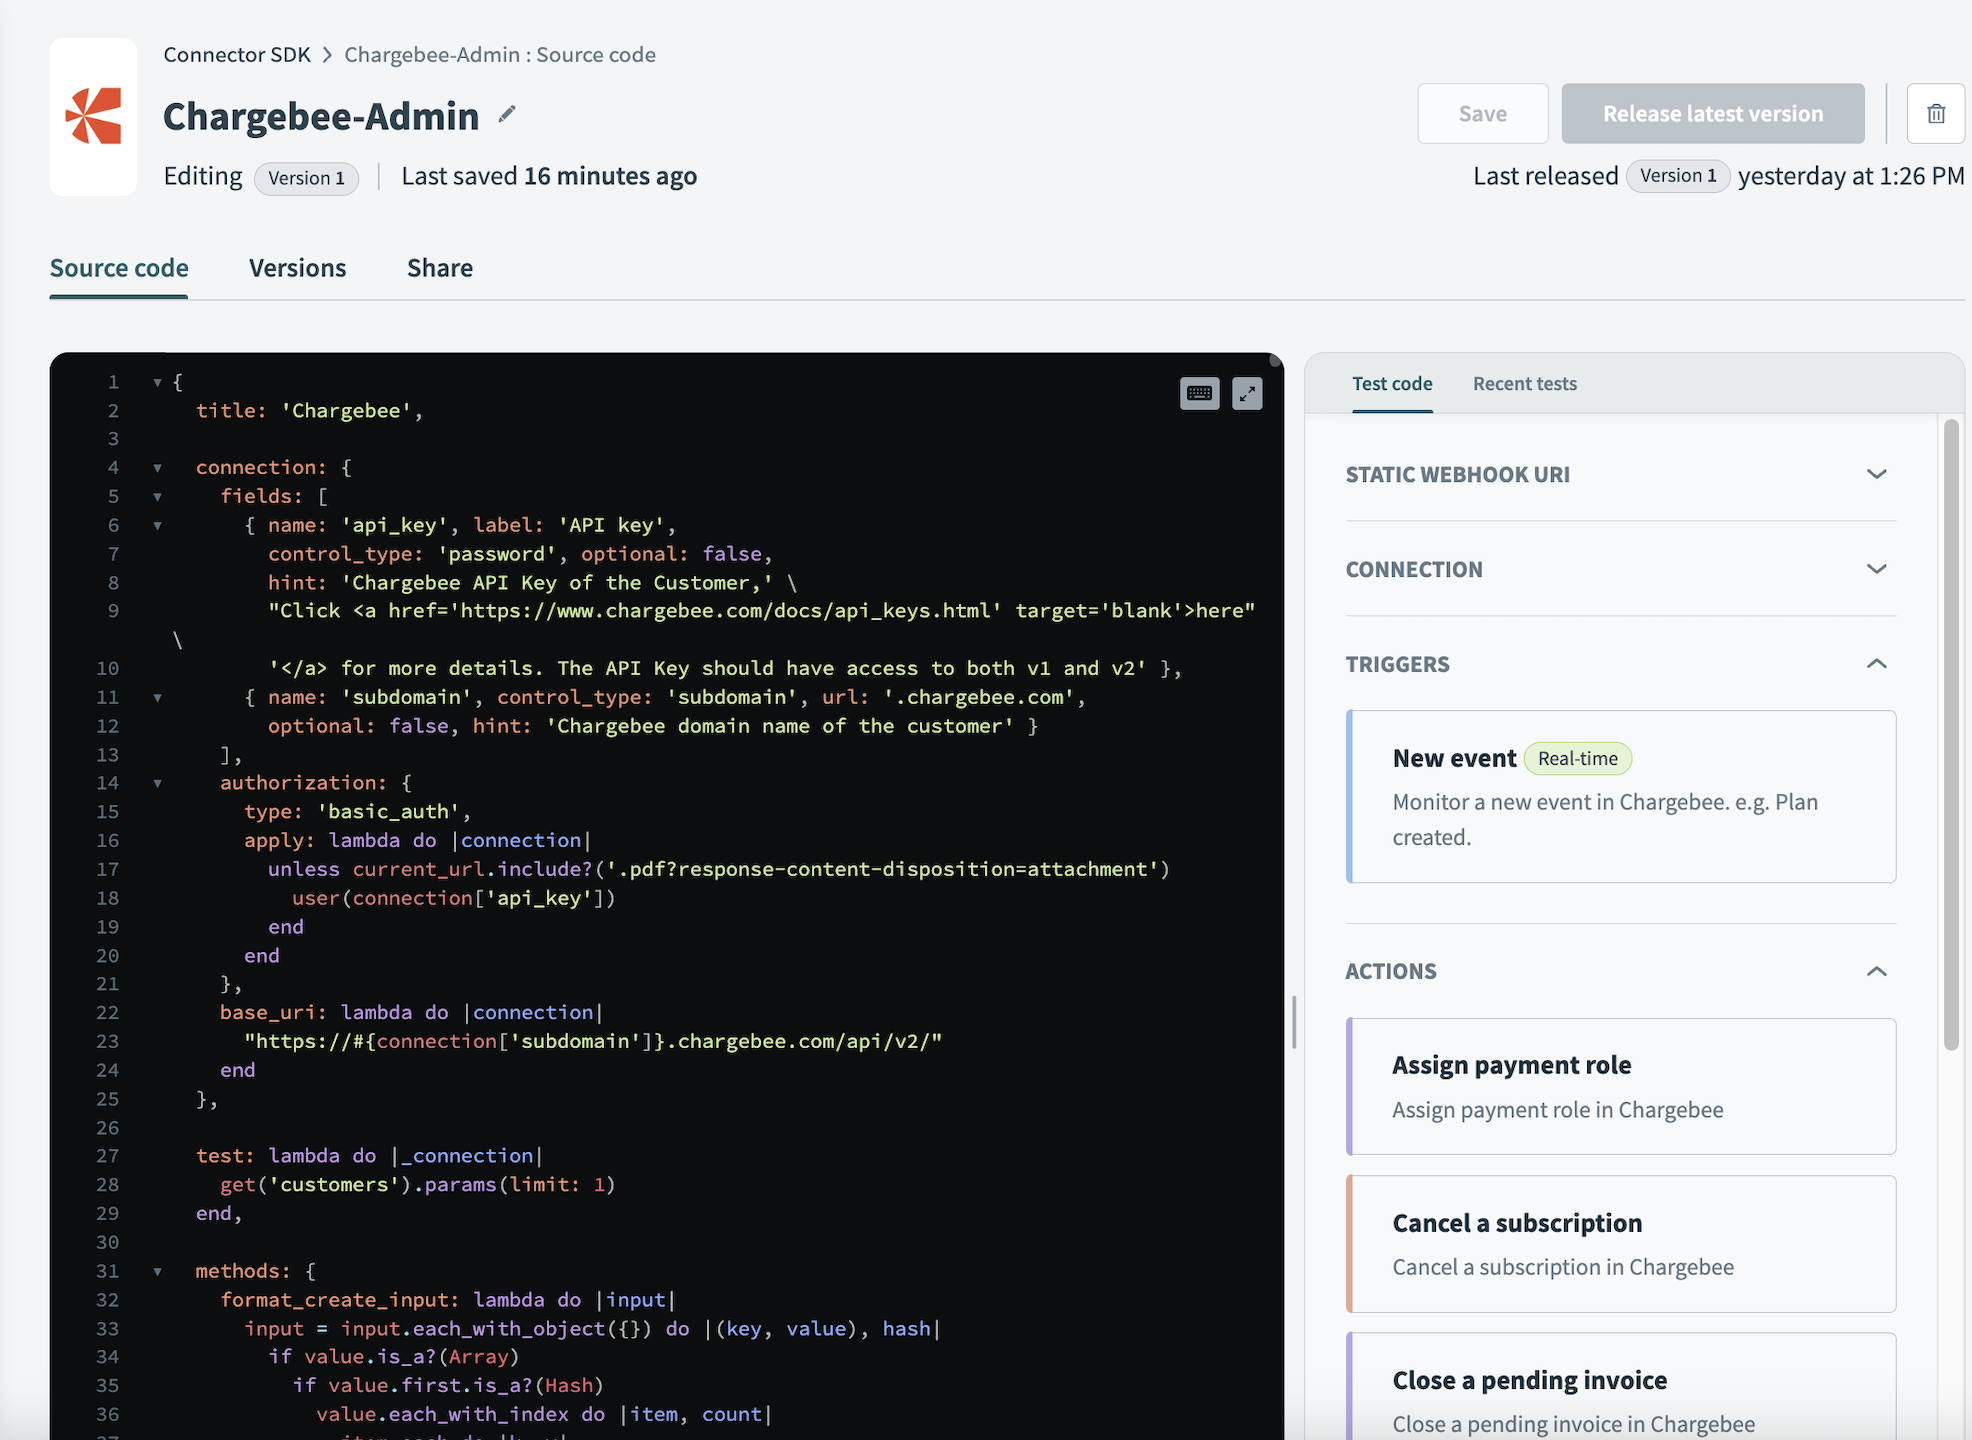 Test code tab
LATEST VERSION
The Test code tab always runs on the latest version of your connector code in your code editor. Any unsaved changes in the code editor result in the custom connector creating a new latest version before running any tests. A notification informs you when this happens.
Connections, actions, and triggers are hidden if there is an error in your latest version. You must correct the error before you can resume testing.
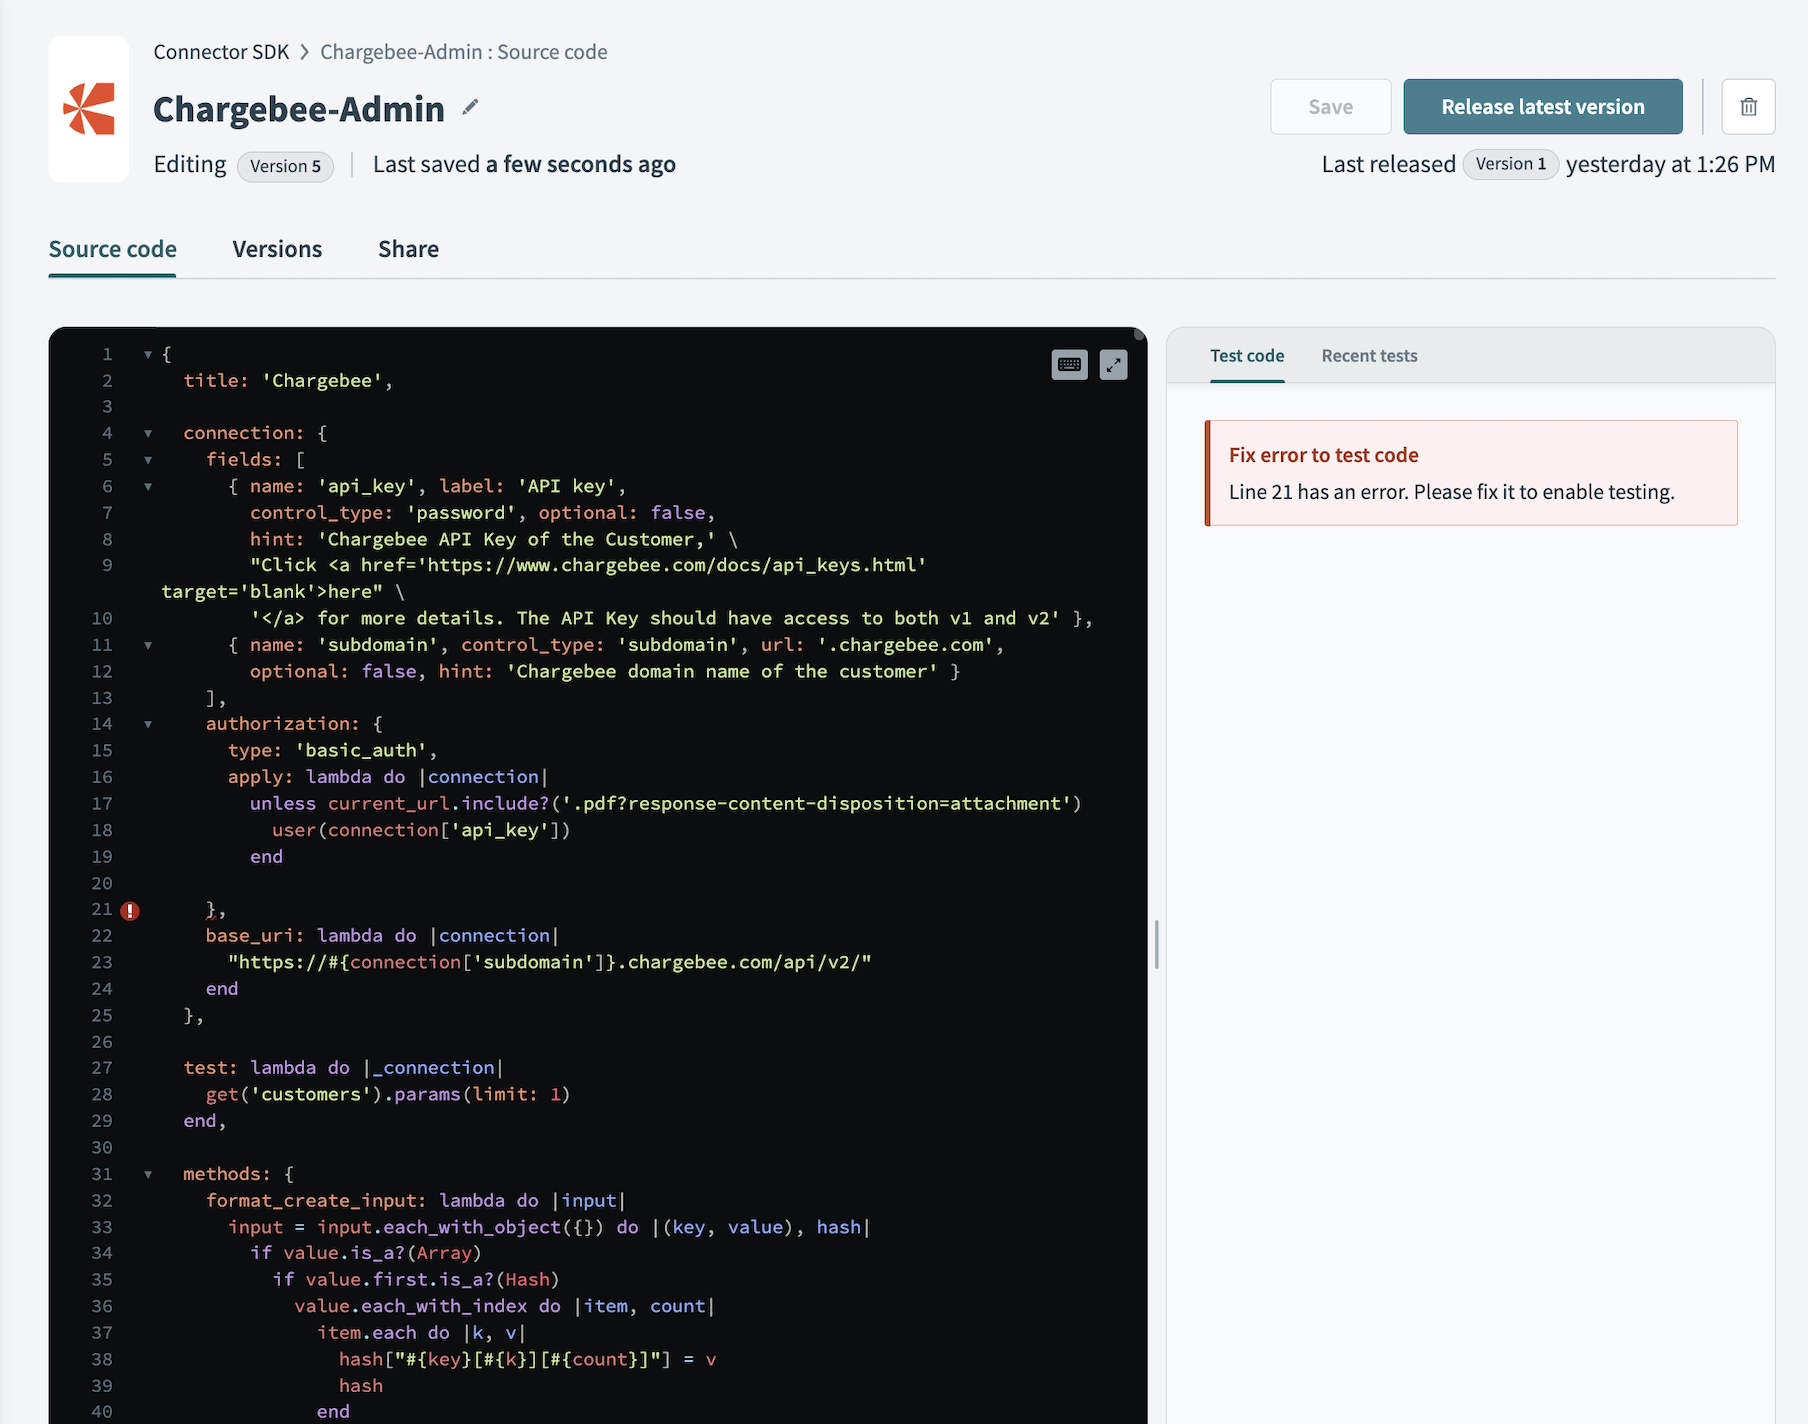 Test code tab when there is an error
Test a connection
You must establish a successful connection before you can use the Test code tab. You can test this connection immediately in the Connection section of the Test code tab, after you define the connection inside the source code.
The Test code tab displays a Connection success message to inform you that the connection is successful. This connection is used for all following tests you execute in the Test code tab.
CREATE A CONNECTION TO TEST ACTIONS AND TRIGGERS
You can't test actions or triggers until a successful connection is made. HTTP requests sent during triggers and actions can't actively authenticate with the API endpoint without a successful connection.
Learn more about configuring a connection in our SDK and the connection types we support.
Test actions and triggers
You can test actions and triggers you have defined using the Test code tab after establishing a successful connection.
USE FULL-SCREEN MODE
Use full-screen mode for an easier experience as you cycle through writing and testing your connector code.
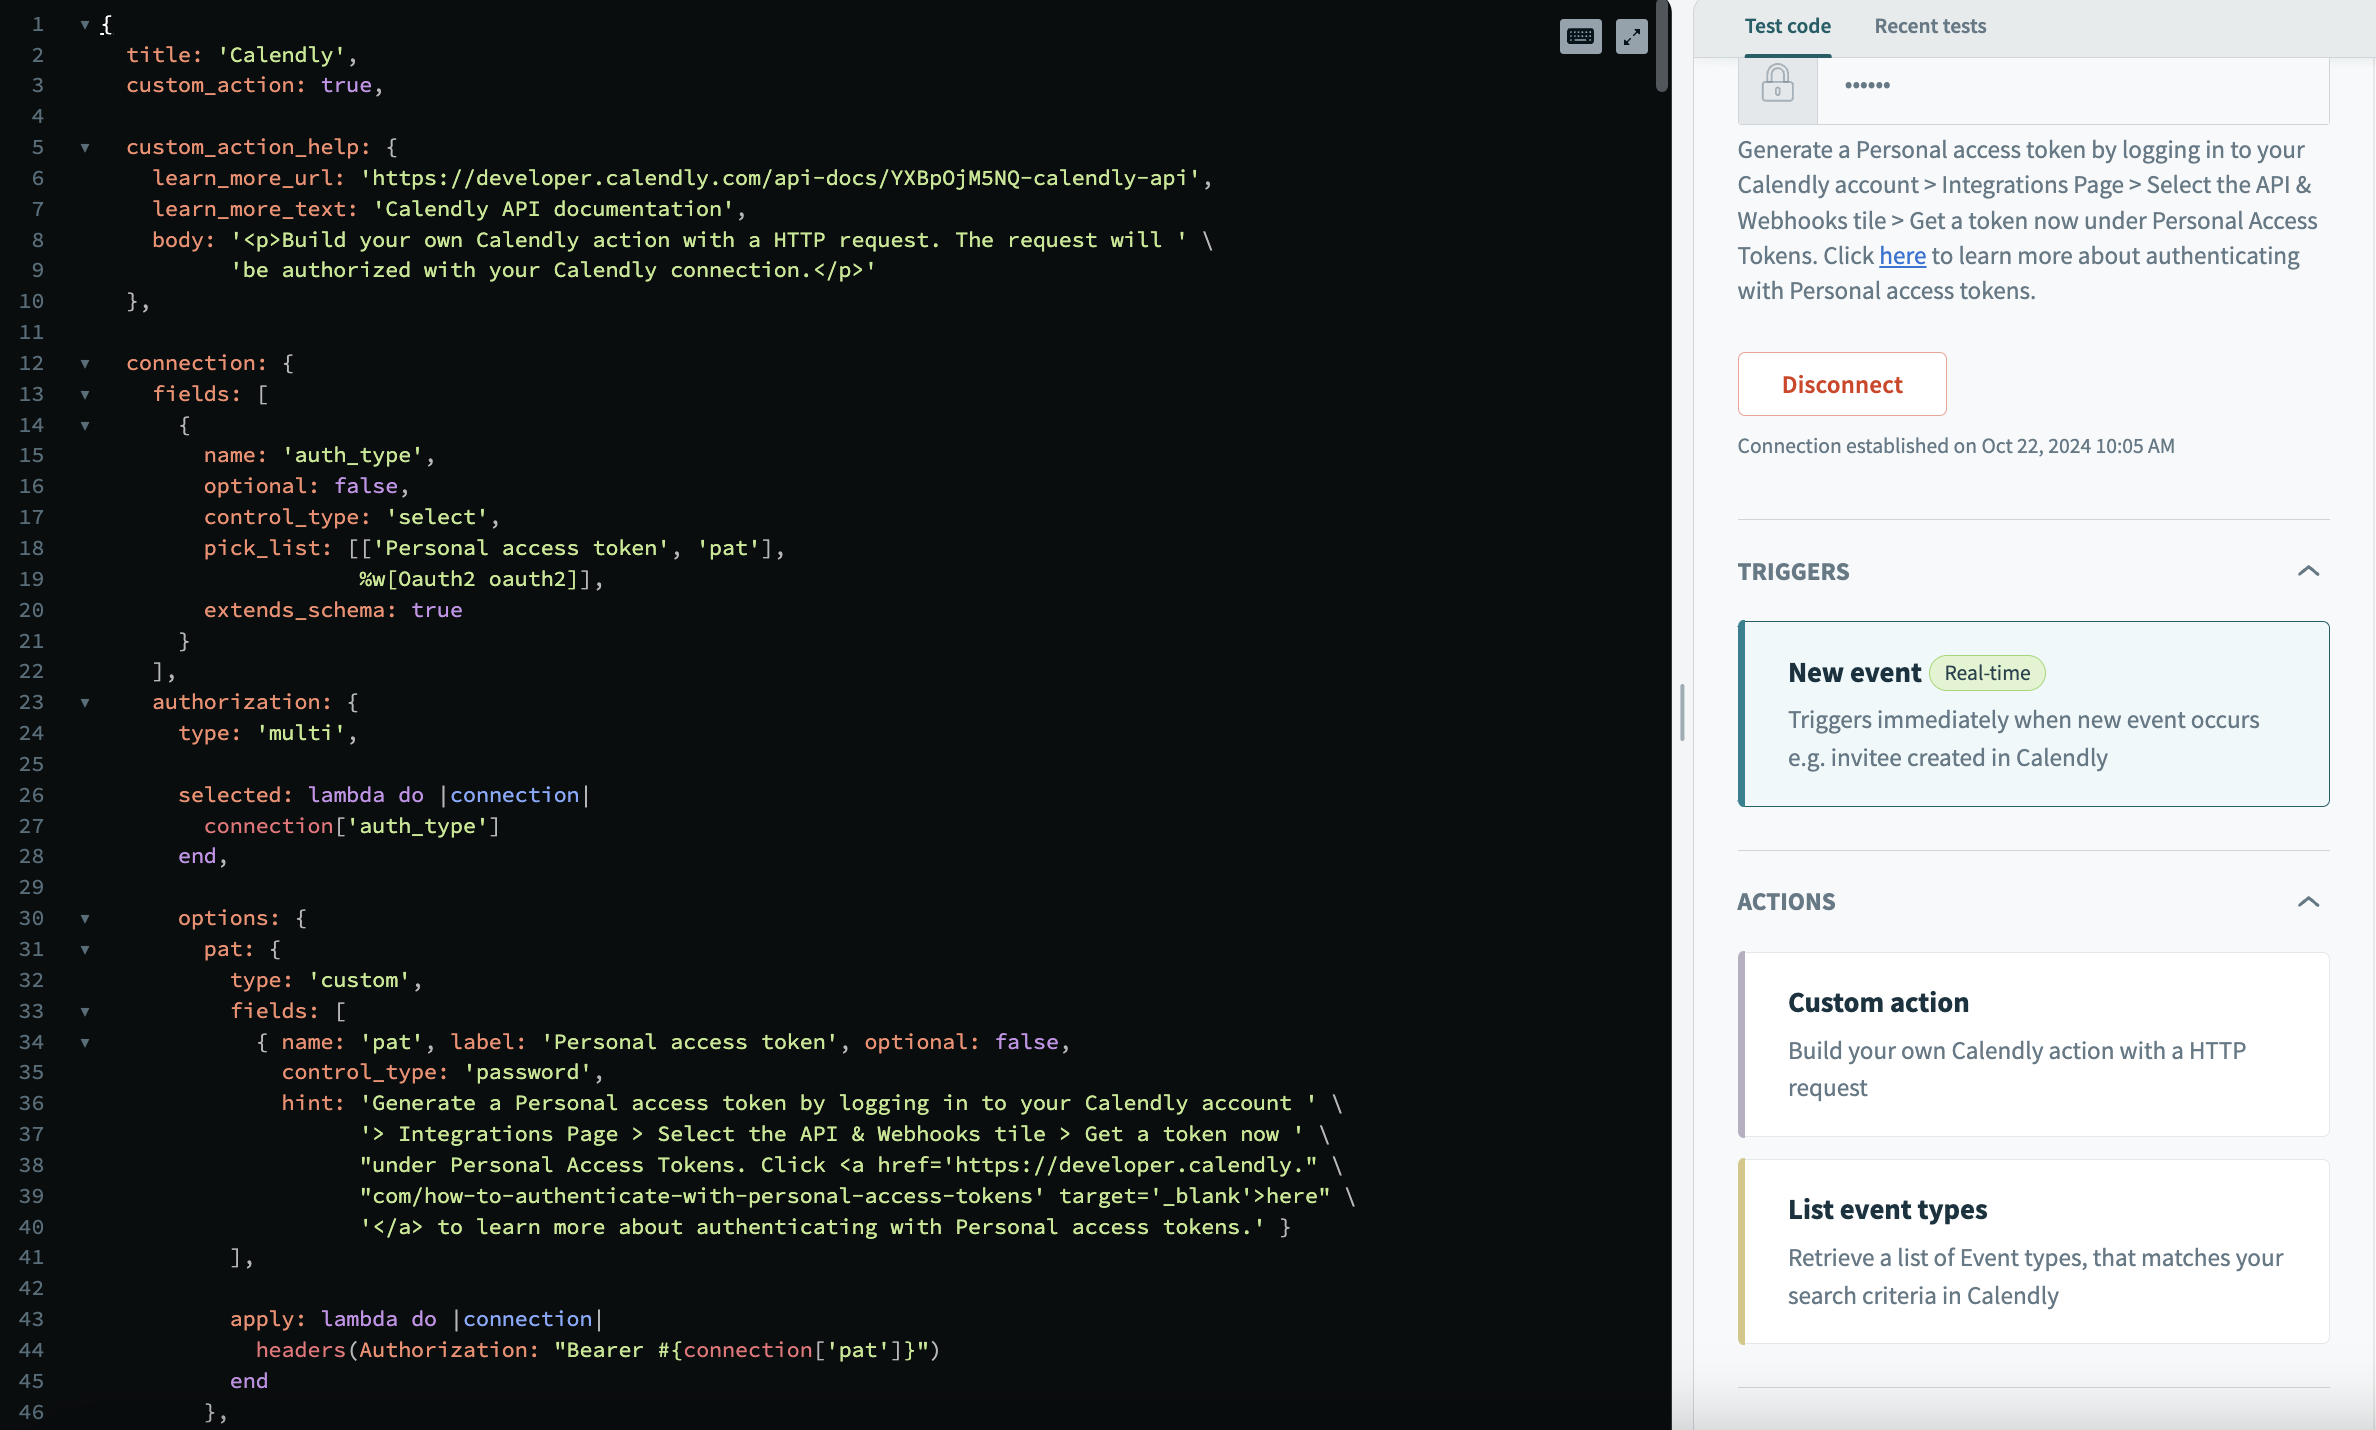 Click the drop-down menus for triggers or actions to see the full list available in your latest version
Click the Test button next to an action or trigger to test it. This opens a new window which mimics the action or trigger in the recipe editor. Changes to your connector code are saved automatically before the test begins when you attempt to test the action or trigger.
You can see the input and output for the action or trigger, as well as the network activity triggered when API requests are sent. The console tab shows the result of any puts Ruby methods executed during the test. This is useful for debugging and shows if the test was unsuccessful due to a logic error in the action or trigger.
The Test code tab highlights errors in red and displays an Error tab that contains the error message raised due to the logic error as well as the exact line of code that causes the framework to raise this error. A trace of the lines of code called that lead up to the final error is provided if the line of code was raised in a block other than the execute block.
Rerun test
You may be required to make edits or change the configuration of your action after you test your custom connector. We recommend that your re-test your code after making updates.
Your recent test actions are stored and accessible from the code editor. This allows you to rerun tests without using the test editor to set up input data every time you make code adjustments. Click Retest action to retest your code.
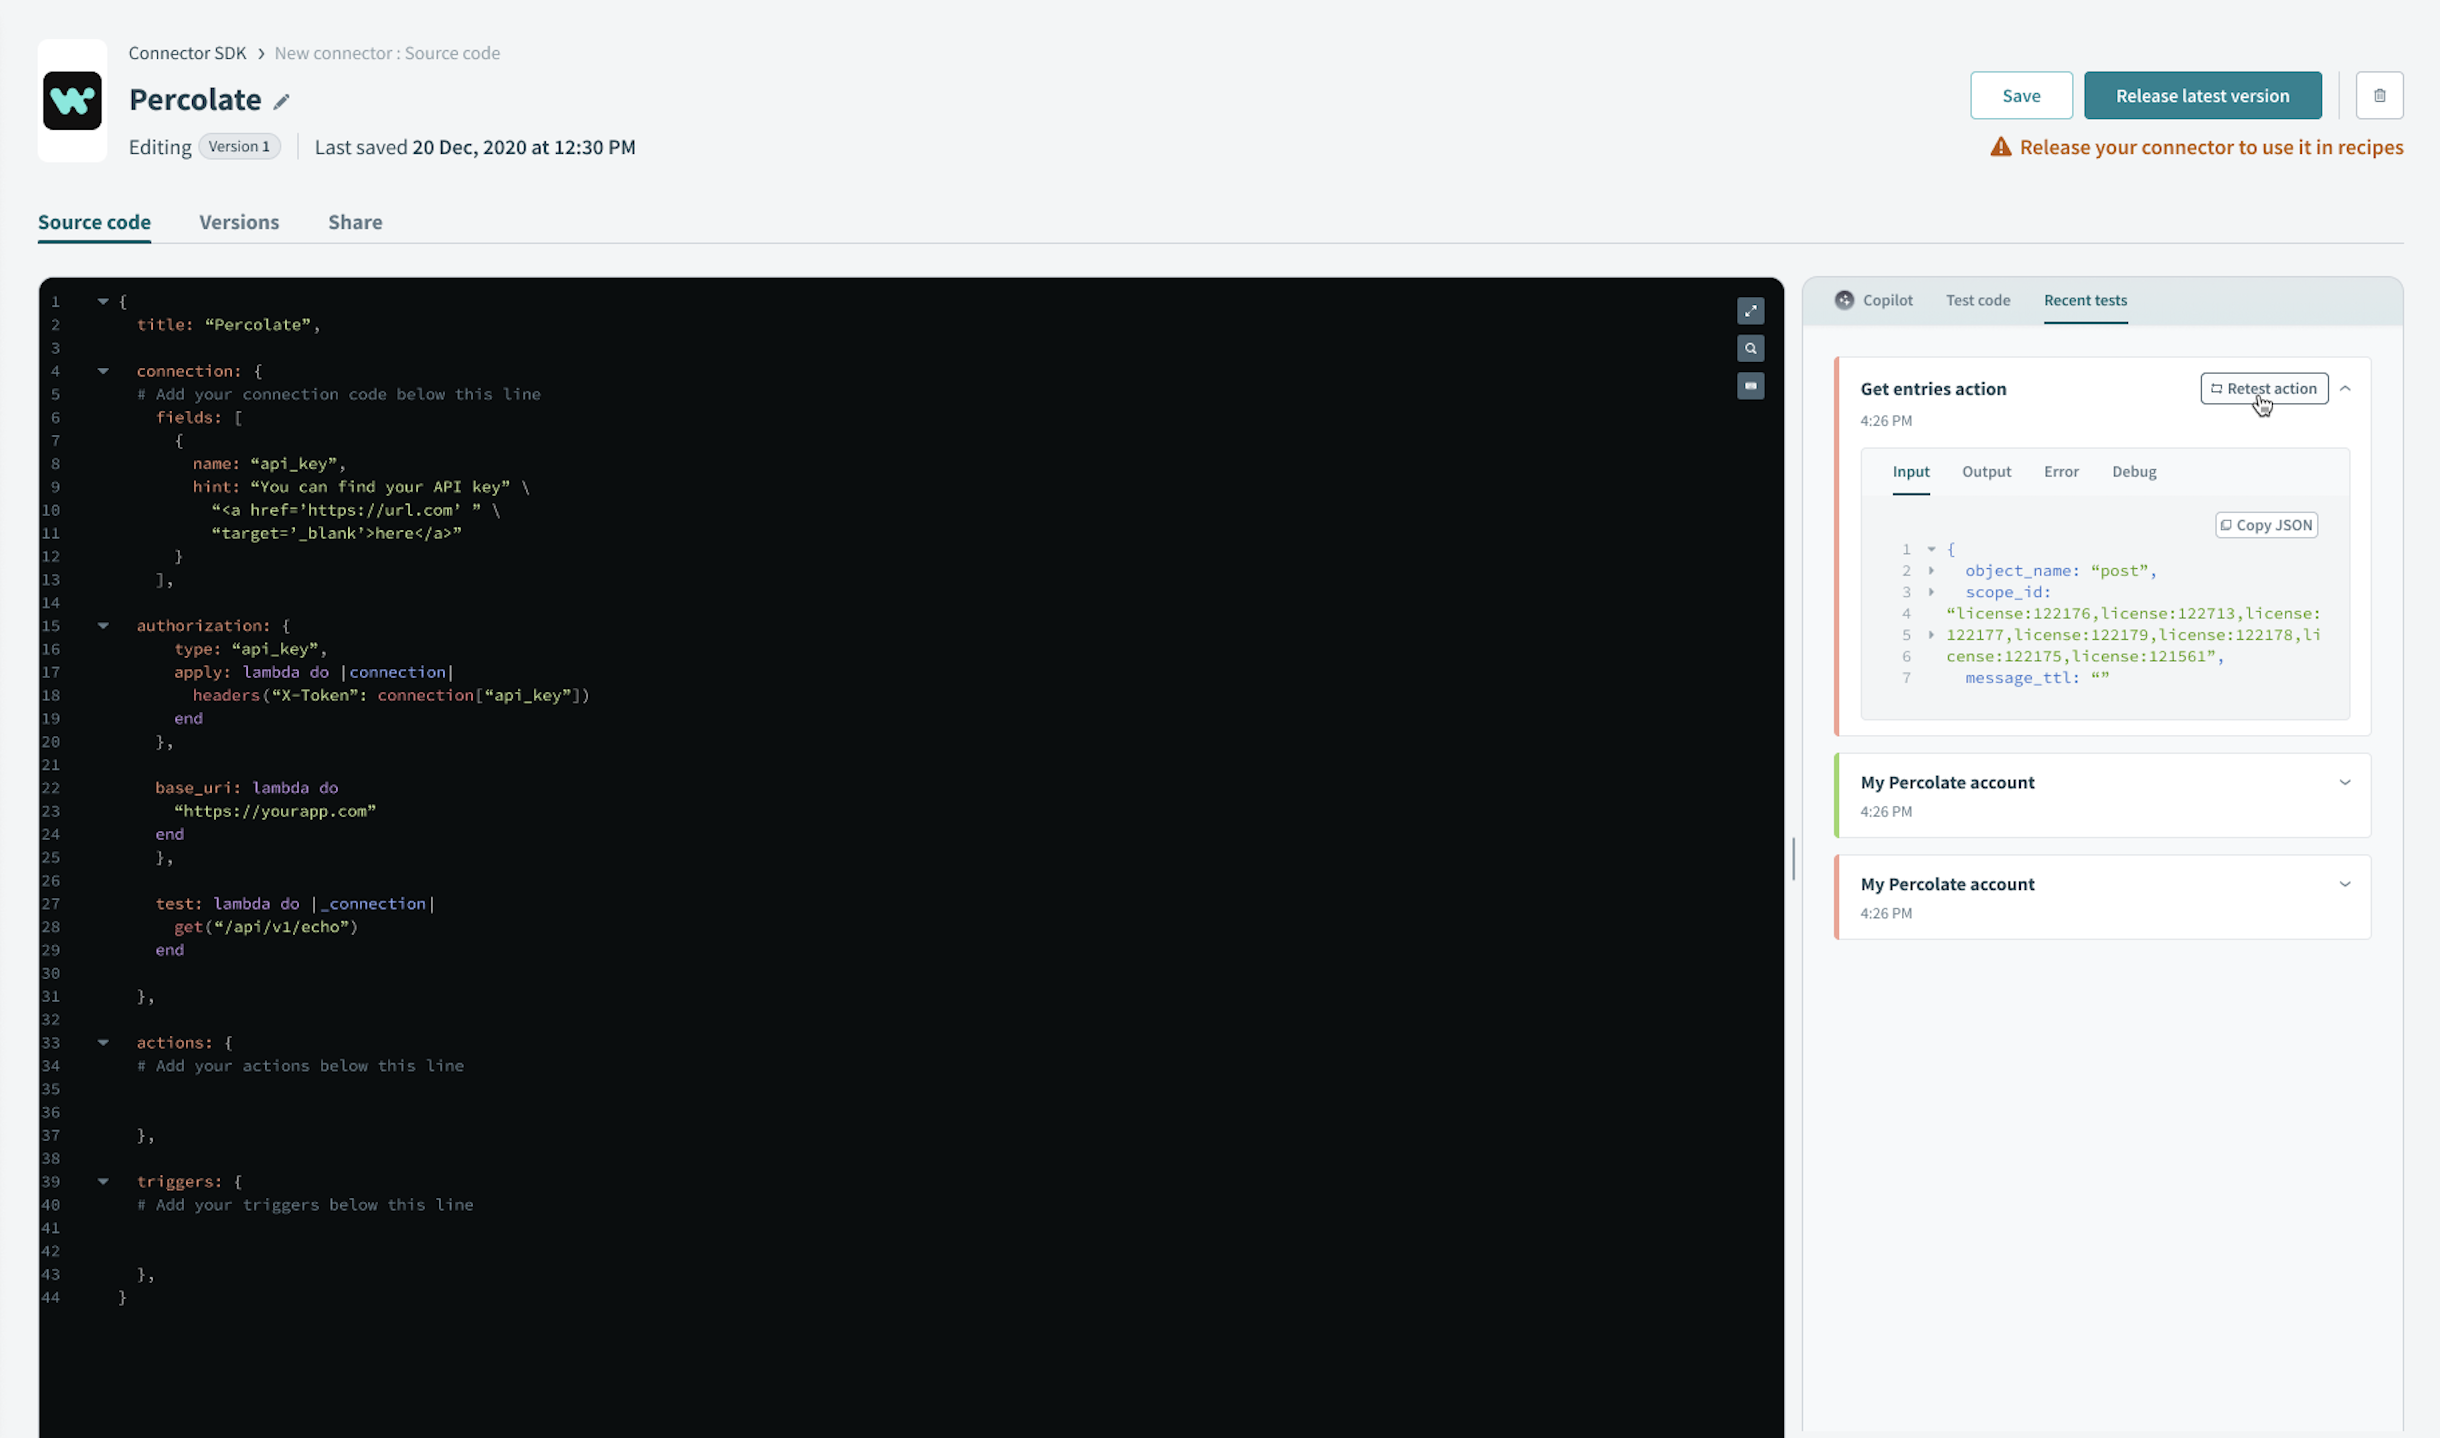 Rerun test from the Test code tab
Last updated: