Data sources
Data sources pull from a specific part of your workspace, such as the project catalog, job history, or data tables. The data sources available to you depend on your role and permissions in the workspace. For example, you can only see data tables in the projects you can access. Refer to Manage roles and privileges for more information.
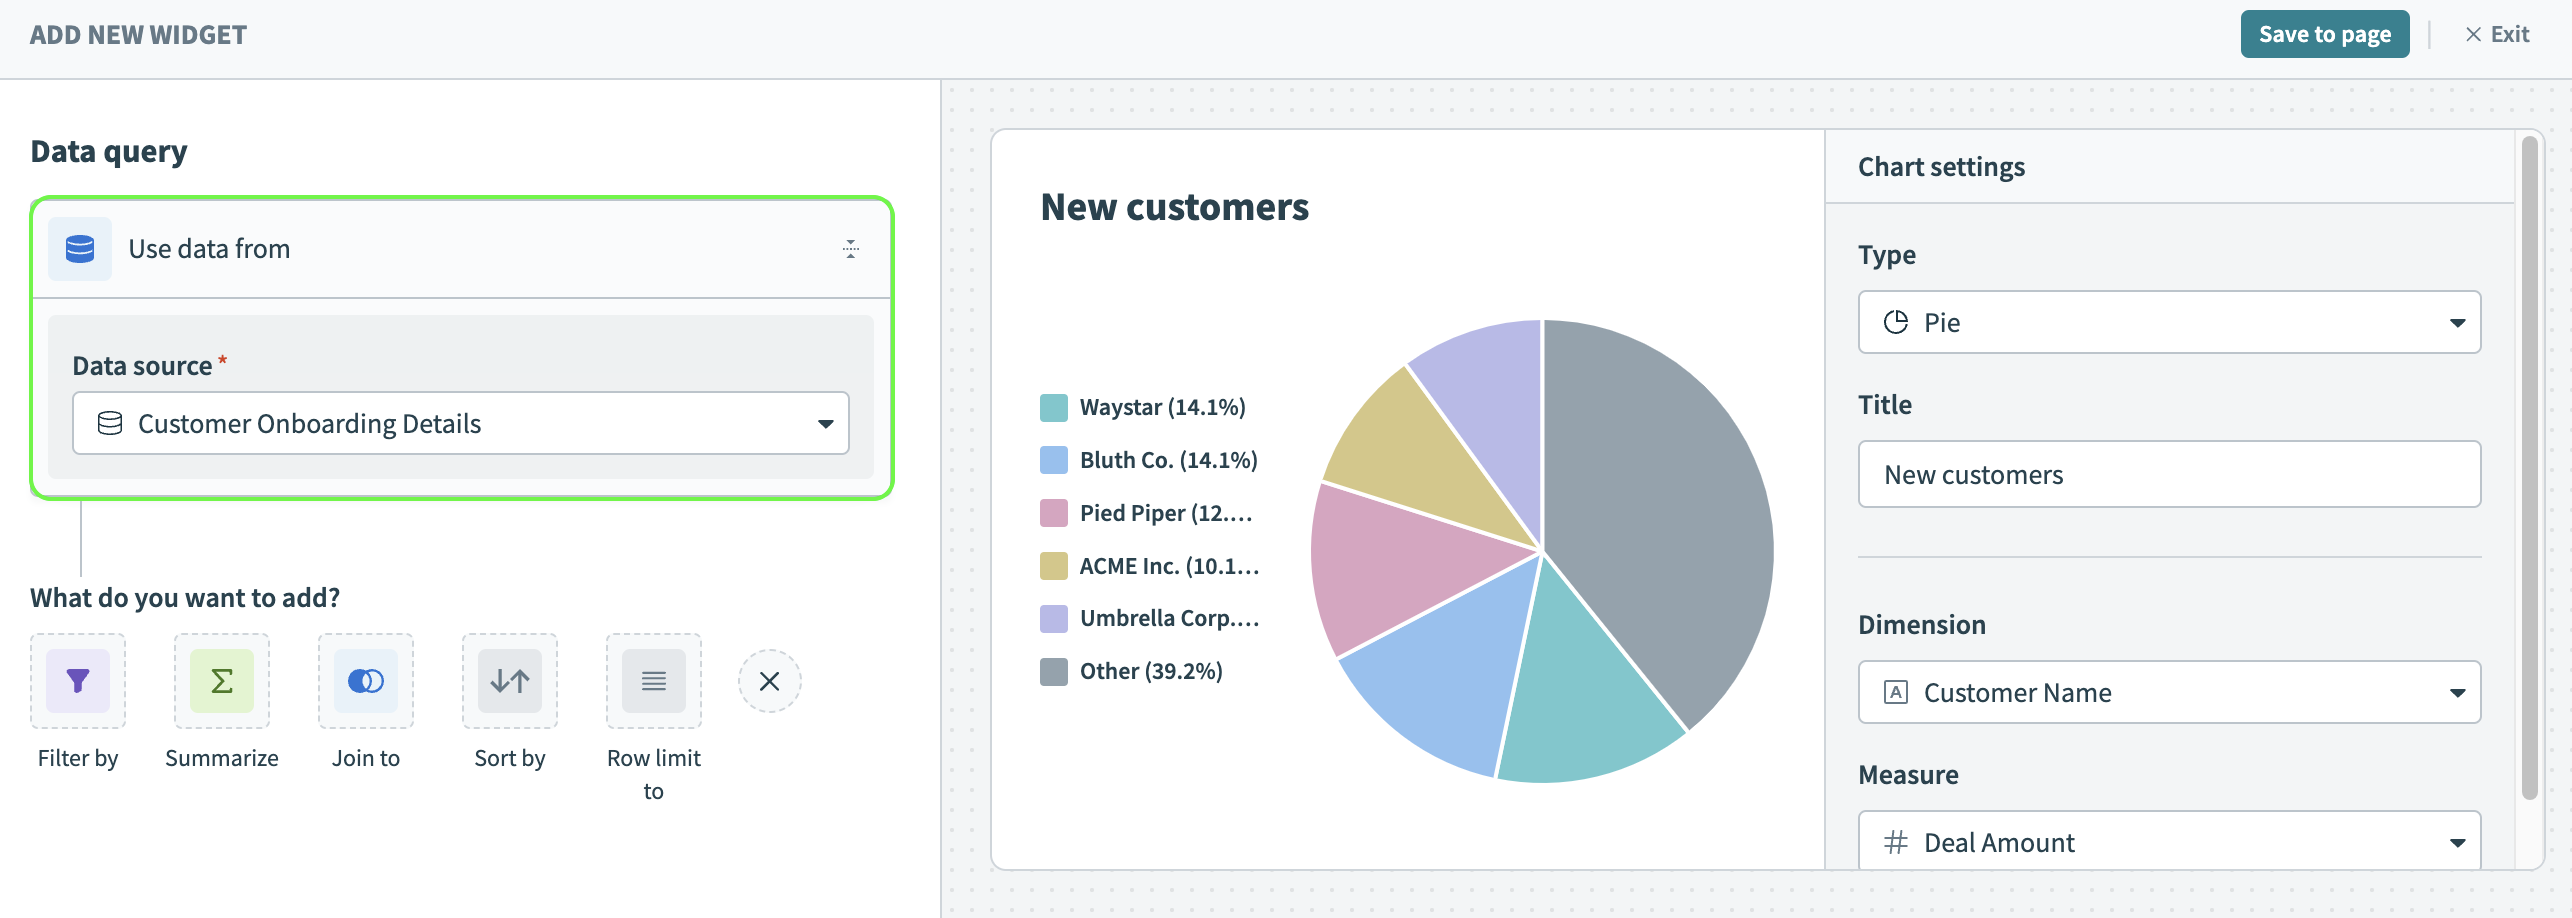 Select a data source
Query builder
The following table describes the type of data available for each data source.
| Data source | Description | Available data |
|---|---|---|
| Workspace data (Projects) | View data related to all the projects in your workspace. |
|
| Workspace data (Recipes) | View data related to all recipes within your workspace. |
|
| Workspace data (Job history) | View the job history data for your workspace for the last 365 days. |
|
| Individual recipe job history | View the recipe job history data for the last 365 days for a recipe you specify. |
|
| Data tables | View data from a data table you specify. |
|
| Workflow apps | View data from a workflow app you specify. |
|
Report builder
The report builder uses prebuilt metrics and dimensions to populate charts.
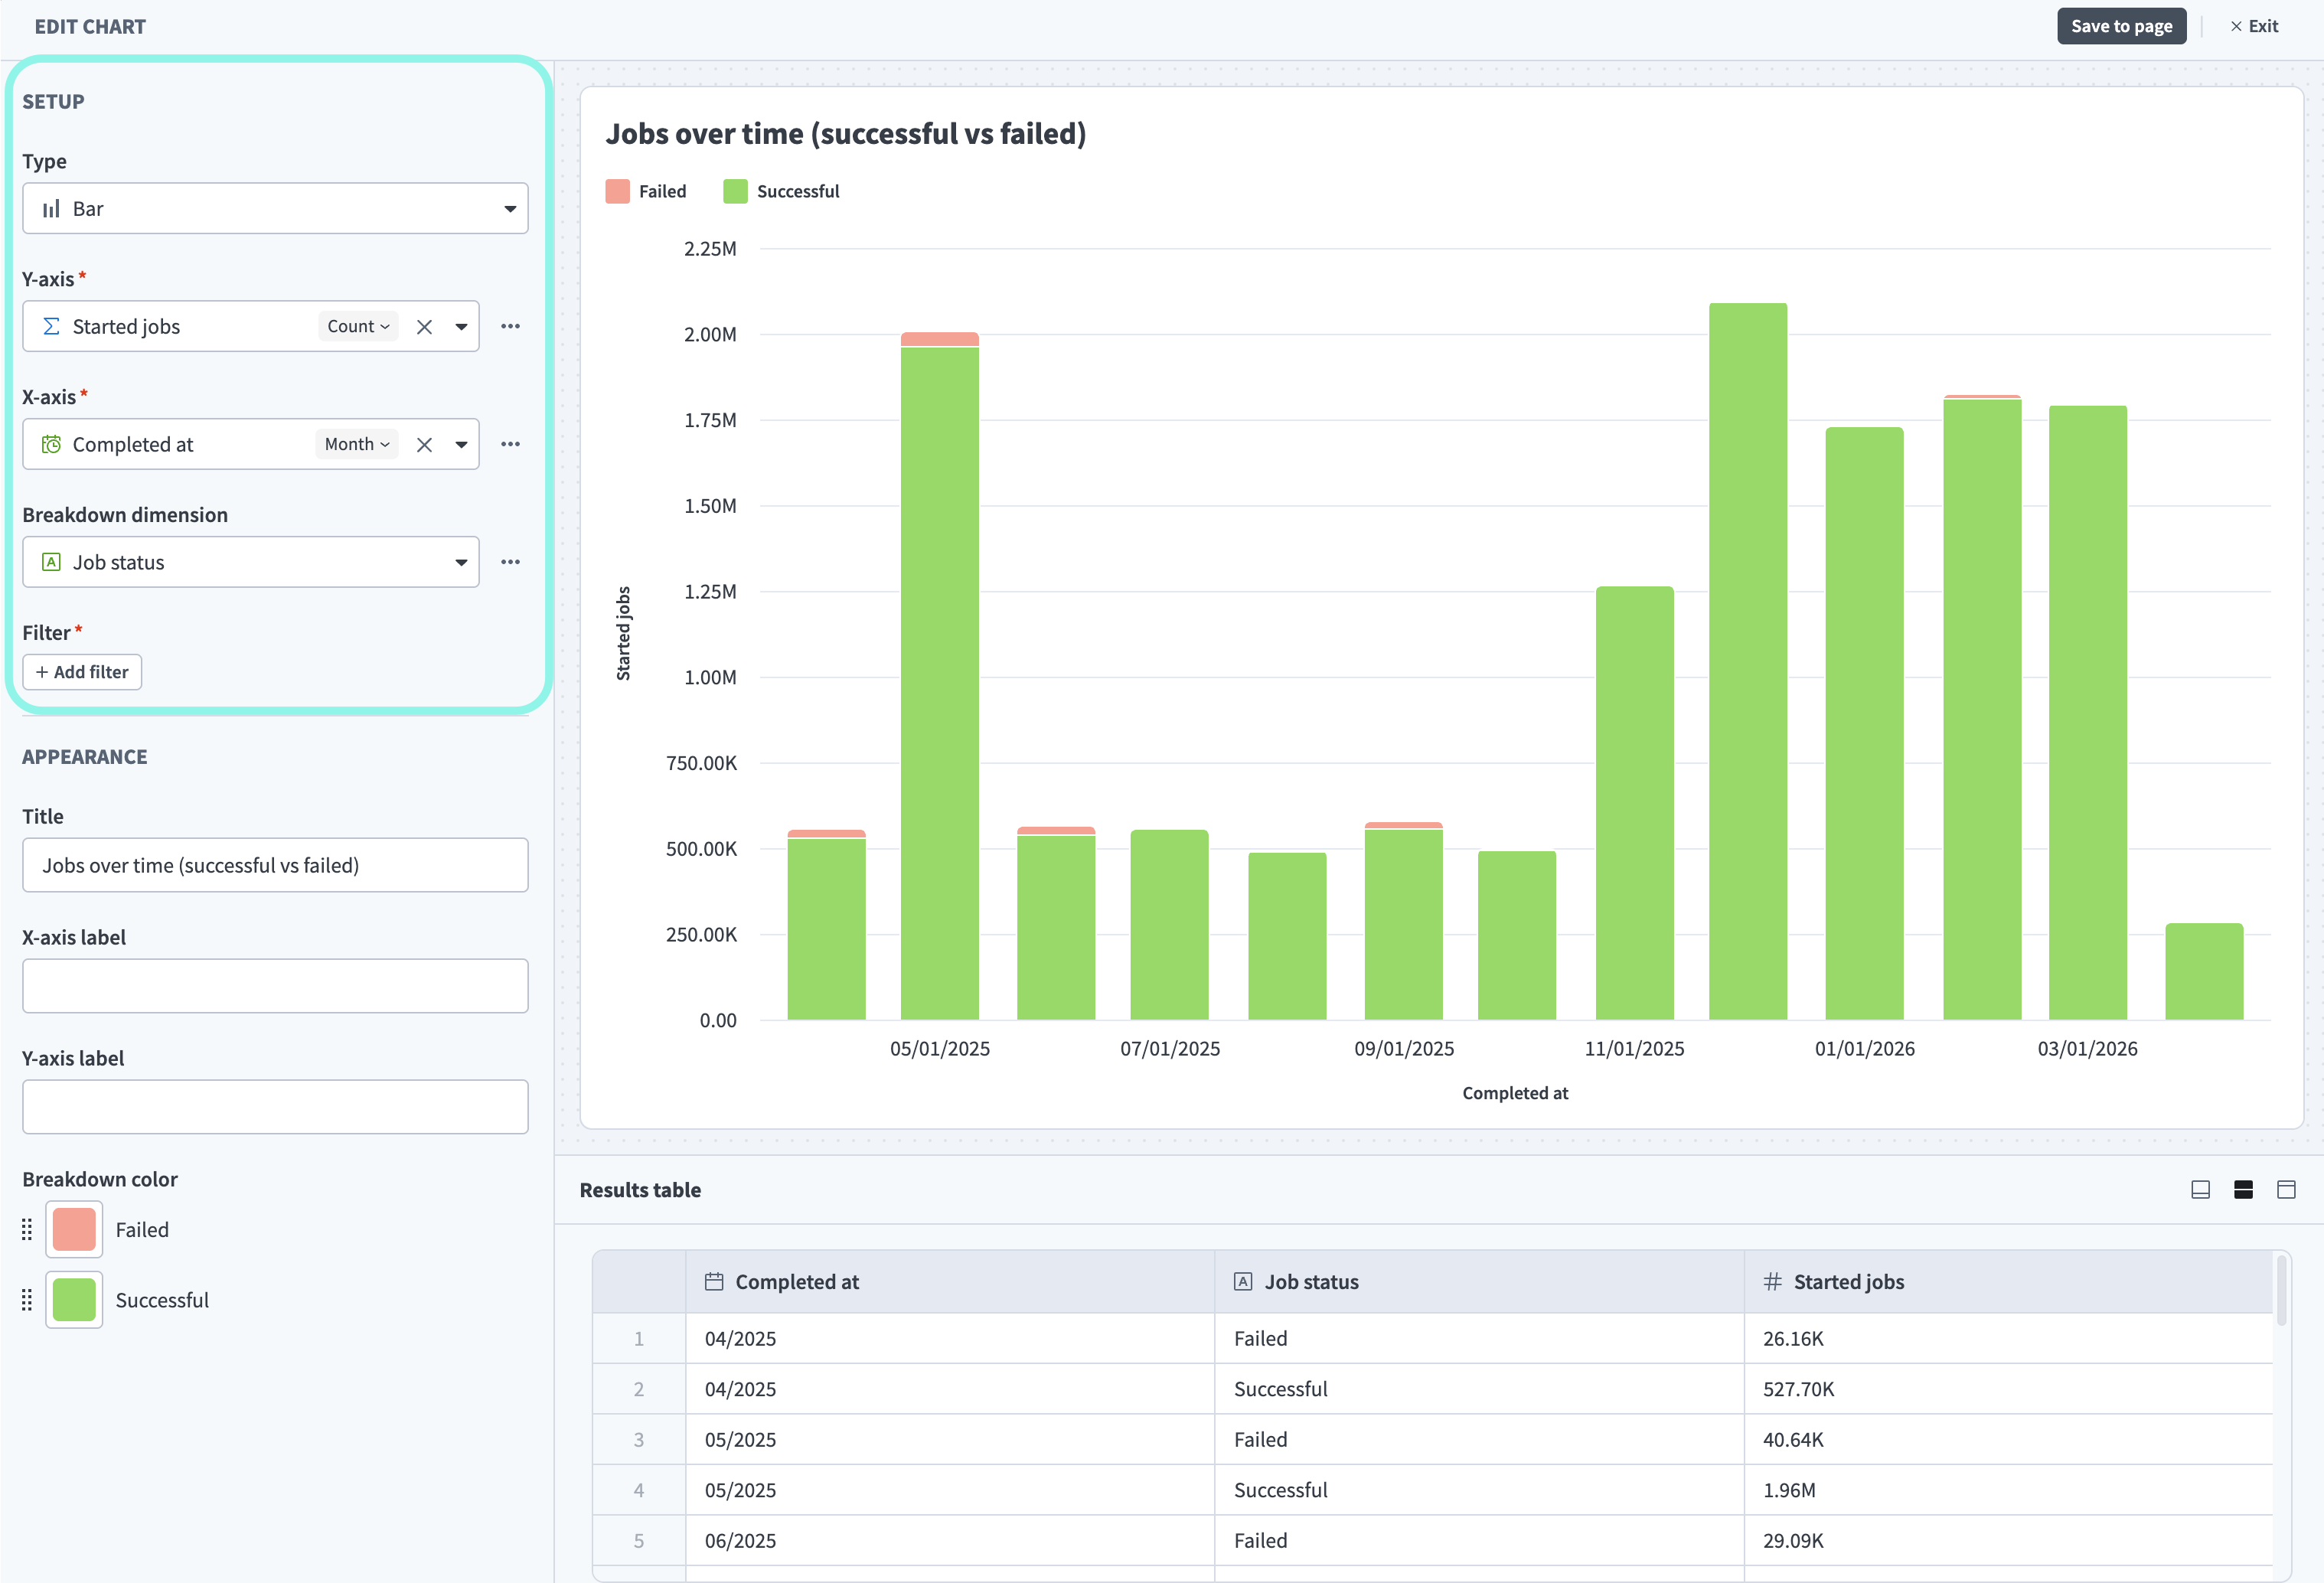 Select a data source
The report builder offers metrics and dimensions for a range of reporting needs. Choose the area that matches the question you're answering:
- Automation health: Job success and failure rates, active recipes, and unused recipes (active but not processing jobs). Refer to Integrations.
- API traffic and governance: Request volume, latency, failure rates, or inactive clients. Refer to APIs.
- Workspace activity: Who joined, which connections changed, or when recipes were created and modified. Refer to Audit and governance.
- Platform consumption and chargeback: Credits, business actions, or API calls a team or process consumes. Refer to Usage.
The available metrics and dimensions are the same across all chart types, but the terminology varies:
| Chart type | Metric label | Dimension label |
|---|---|---|
| Line, Bar, Area | Y-axis | X-axis |
| Pie | Metric | Dimension |
| Table | Metrics | Dimensions |
| KPI | Metric | — |
COMPATIBLE METRICS AND DIMENSIONS
Metrics and dimensions aren't all interchangeable. Workato filters the list of dimensions to show only compatible options when you select a metric, and does the same when you select a dimension. For example, Job status is available when reporting on jobs, but not when reporting on collaborators.
PRIVATE BETA
The report builder is in private beta. Private beta features are available by invite only. Contact your Customer Success Manager to enable this feature.
Workato may update feature functionality or change availability without prior notice during the private beta.
This reference groups the available metrics and dimensions into four reporting areas. Each area lists the metrics you can measure and the dimensions you can group and filter by.
DATA RETENTION
The report builder currently retains data for a limited window:
- Integrations, APIs, and Audit and governance report on up to the last 365 days.
- Usage reports on the current active accounting period only.
Integrations
Measure the health of your recipes and jobs.
Metrics
| Metric | Category | Description |
|---|---|---|
| Active recipes | Recipe | The number of active recipes in the workspace. |
| Active projects | Recipe | The number of unique projects that contain at least one active recipe. |
| Unused recipes | Recipe | The number of active recipes that didn't process any jobs in the last 30 days. |
| Recipe success rate | Recipe | The proportion of jobs that completed successfully, as a ratio of successful jobs to total jobs. |
| Recipe failure rate | Recipe | The proportion of jobs that failed, as a ratio of failed jobs to total jobs. |
| Total jobs | Job | The total number of jobs that started during the selected time period and have since completed, regardless of outcome. |
| Successful jobs | Job | The total number of jobs that completed successfully. |
| Failed jobs | Job | The total number of jobs that failed. |
| Jobs tasks | Job | The number of task steps executed across jobs. Use SUM for total task consumption or AVG to understand recipe complexity.This metric will be moved to the usage dataset in the future. |
| Jobs duration | Job | The total execution duration of jobs, in milliseconds. |
METRICS WITHOUT A TIME AXIS
Active recipes, Active projects, and Unused recipes report the current state of your workspace, so you can't add the Date dimension to chart them over time.
RATE METRICS
Recipe success rate and Recipe failure rate return a ratio, such as 0.94. Use the chart's number formatting to display it as a percentage.
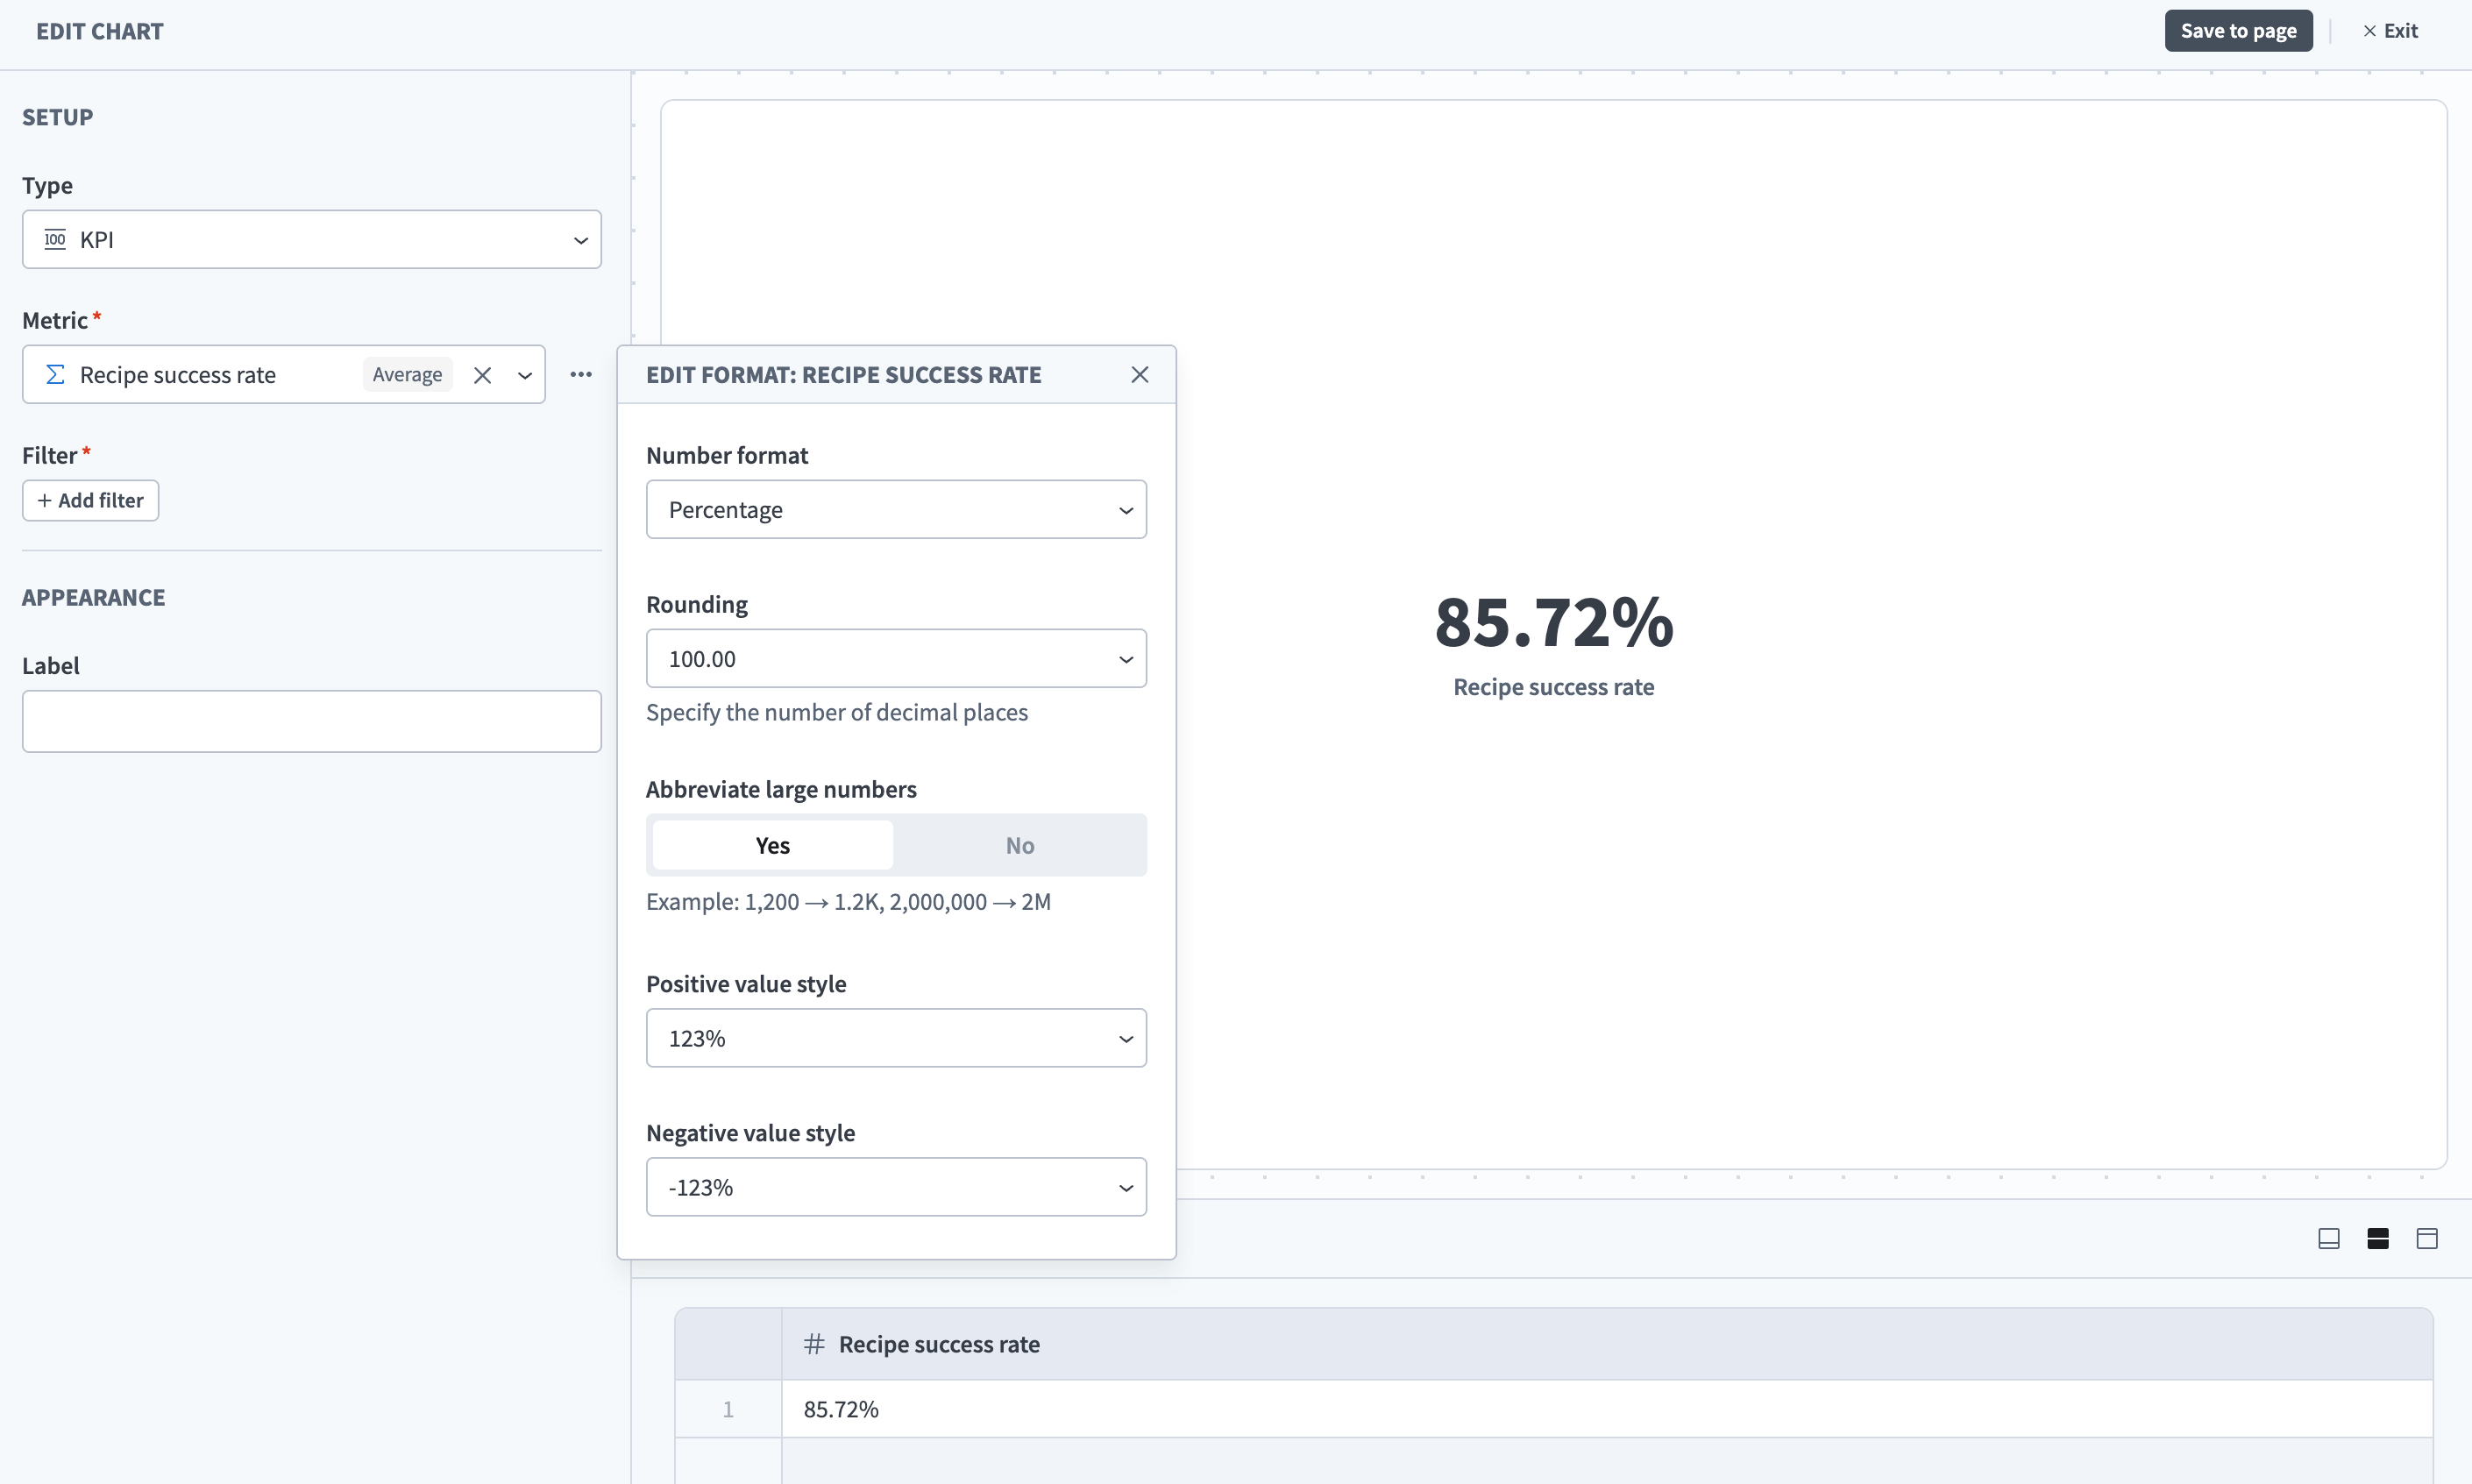 Number formatting options for a numeric metric
Dimensions
| Dimension | Category | Description |
|---|---|---|
| Date | Common | The time axis for your report. You can group the results by day, week, or month. |
| Started at | Job | The date and time a job started. |
| Completed at | Job | The date and time a job finished, regardless of success or failure. |
| Job status | Job | The final outcome of the job, such as succeeded or failed. |
| Error type | Job | The standardized error code or category representing the failure type. For example, 400 Bad Request, 409 Conflict, or INVALID_ID. |
| Error application | Job | The application connector that caused the job to fail. |
| Recipe name | Recipe | The name of the recipe as configured in the workspace. |
| Recipe applications | Recipe | The list of applications used in the recipe. |
| Status | Recipe | The current status of the recipe. |
| Trigger application | Recipe | The application that triggers the recipe to start. |
| Project name | Common | The project the asset or event belongs to. |
| Environment name | Common | The workspace environment. For example, Development, Test, or Production. |
| Environment type | Common | The type of the workspace environment. For example, dev, test, or prod. |
| Asset tags | Common | Labels attached to the asset. |
ABOUT THE DATE DIMENSION
Use the Date dimension to add a time axis to metrics that measure activity over a time period. Workato automatically maps it to the correct time column for each metric, so it works consistently across any metric.
APIs
This section provides visibility into your API Platform through two types of metrics:
- Inventory: Current counts of configured API Platform resources, including access profiles, clients, collections, and endpoints.
- Traffic: Time-series request data that shows API request volume over the selected time period.
Metrics
| Metric | Type | Description |
|---|---|---|
| API access profiles | Inventory | All API access profiles accessible to a user. |
| API clients | Inventory | All API clients accessible to a user. |
| API collections | Inventory | All API collections accessible to a user. |
| API endpoints | Inventory | All API endpoints accessible to a user. |
| Workspaces | Inventory | The workspaces available to a client. |
| API churned clients | Traffic | API clients with zero API calls within the last 365 days. |
| Active API access profiles | Traffic | The number of distinct API access profiles used in API requests in the selected period. |
| API active clients | Traffic | The number of distinct API clients that made at least one API request during the selected period. |
| API active collections | Traffic | The number of distinct API collections used in API requests in the selected period. |
| API active endpoints | Traffic | The number of distinct API endpoints used by API requests in the selected period. |
| API requests | Traffic | The count of API requests. Doesn't include inactive API entities. |
| API successful requests | Traffic | The count of successful API requests. A request is successful if it returns a response code in the 2xx or 3xx range. |
| API successful requests rate | Traffic | The rate of successful API requests out of total API requests. |
| API failed requests | Traffic | The count of failed API requests. A request is failed if it returns a response code in the 4xx or 5xx range. |
| API failed requests rate | Traffic | The rate of failed API requests out of total API requests. |
| API requests duration (latency) | Traffic | The duration of API requests in milliseconds. |
| API requests peak concurrency | Traffic | The maximum number of concurrent API requests observed in the selected period. |
| API requests daily count | Traffic | The count of API requests for each API entity on a daily basis, including inactive entities, which return a count of 0. |
| API requests daily average | Traffic | The average count of API requests per day for each API entity. |
Dimensions
| Dimension | Description |
|---|---|
| Date | The time axis for your report. You can group the results by day, week, or month. |
| Collection name | The name of the API collection. |
| Collection type | The type of the API collection. |
| Collection version | The version of the API collection. |
| Endpoint name | The name of the API endpoint. |
| API endpoint is active | The activity status of the API endpoint, either activated or deactivated. |
| HTTP method | The HTTP method of the API endpoint. |
| Path | The path of the API endpoint. For example, /orders/{id}. |
| Access profile | The name of the API access profile. |
| Access profile is active | The activity status of the access profile, either activated or deactivated. |
| Client name | The name of the API client. |
| Request outcome | The outcome of the API request, such as successful or failed. |
| Response HTTP code | The HTTP response code returned for the API request. For example, 200, 400, or 500. |
| Request duration | The duration of the API request in milliseconds. |
| Is MCP | Indicates whether the API request was made by an MCP client. |
| Workspace name | The display name of the workspace. |
Audit and governance
Track workspace activity: who joined, what connections changed, and recipe lifecycle events.
DATA RETENTION
Audit and governance metrics report on up to the last 365 days.
Metrics
| Metric | Category | Description |
|---|---|---|
| Collaborator added to workspace | Collaborator | The number of collaborators who accepted an invitation and joined the workspace. |
| Collaborator invited | Collaborator | The number of invitations sent to new collaborators in the selected time period. |
| Collaborator deleted | Collaborator | The number of collaborators who were removed from the workspace in the selected time period. |
| Collaborator login | Collaborator | The number of times collaborators logged in to the workspace in the selected time period. |
| Collaborator role updated | Collaborator | The number of role changes made to collaborators in the selected time period. Use the User previous role and User role dimensions to see what changed. |
| Connection created | Connection | The number of new connections created in the selected time period. |
| Connection connected | Connection | The number of connections that were successfully authenticated in the selected time period. |
| Connection disconnected | Connection | The number of connections that lost their authenticated state in the selected time period. |
| Connection updated | Connection | The number of connections that were re-authenticated or re-configured in the selected time period. |
| Recipe created | Recipe | The number of recipes created in the selected time period. Use the cumulative view to track growth of your automation library. |
| Recipe updated | Recipe | The number of recipes that were modified in the selected time period. |
| Recipe deleted | Recipe | The number of recipes permanently deleted in the selected time period. |
| Recipe started | Recipe | The number of times recipes were turned on (activated) in the selected time period. |
| Recipe stopped | Recipe | The number of times recipes were turned off (deactivated) in the selected time period. |
Dimensions
| Dimension | Category | Description |
|---|---|---|
| Date | Common | The time axis for your report. You can group the results by day, week, or month. |
| Performed by | Collaborator | The email address of the user who performed the action. |
| User email | Collaborator | The email address of the collaborator in the workspace. |
| User name | Collaborator | The display name of the collaborator as set in their profile. |
| User role | Collaborator | The current permission role of the collaborator in the workspace. |
| User previous role | Collaborator | The permission role assigned to the collaborator before a role change. |
| User invited by | Collaborator | The email address of the user who sent the invitation to this collaborator. |
| Connection name | Connection | The display name of the connection. |
| Connection application | Connection | The application associated with the connection, such as Salesforce or Slack. |
| Connection type | Connection | The authentication type of the connection, such as Cloud or OPA. |
| Recipe name | Recipe | The name of the recipe as configured in the workspace. |
| Project name | Common | The project the asset or event belongs to. |
| Environment name | Common | The workspace environment. For example, Development, Test, or Production. |
| Environment type | Common | The type of the workspace environment. For example, dev, test, or prod. |
DIMENSION AVAILABILITY FOR AUDIT METRICS
Some dimensions apply only to certain audit event types:
- Project name and Environment name are available on connection and recipe lifecycle metrics, but not on collaborator metrics.
- User email is available on collaborator metrics only.
- User name is available on connection and recipe lifecycle metrics only.
Usage
Measure platform consumption, which is useful for chargeback and tracking credit consumption on your plan.
Metrics
| Metric | Description |
|---|---|
| Business actions count | A business action is a successful trigger or action step in a workflow recipe. Certain Workato utilities are excluded. |
| API calls | Usage for managed API recipes. |
| API proxy calls | API calls routed through Workato's API Gateway. |
| Credits | Credits consumed. |
| Events processed | The usage unit for Event Streams. Counts publish actions only. Event Streams triggers are excluded. |
| Genie actions | A Genie input and response (one turn). |
| IDP pages processed | Pages processed by Intelligent Document Processing (IDP). |
| MCP tool calls | A successful MCP tool call. |
| Rows consumed | Rows consumed by data pipelines. |
Dimensions
| Dimension | Category | Description |
|---|---|---|
| Date | Common | The time axis for your report. You can group the results by day, week, or month. |
| Usage type | Usage | The product metric being consumed, such as business actions, API calls, rows consumed, or pages processed. |
| Workspace name | Common | The display name of the workspace. |
| Environment name | Common | The workspace environment. For example, Development, Test, or Production. |
| Project name | Common | The project the asset or event belongs to. |
| Recipe name | Recipe | The name of the recipe as configured in the workspace. |
| Asset tags | Common | Labels attached to the asset. |
| Environment type | Common | The type of the workspace environment. For example, dev, test, or prod. |
| Collection name | API | The name of the API collection. |
| Endpoint name | API | The name of the API endpoint. |
DIMENSION AVAILABILITY FOR USAGE METRICS
Some dimensions apply only to certain usage metrics:
- Project name, Recipe name, and Asset tags aren't available on the API proxy calls, Genie actions, or MCP tool calls metrics. For these metrics, group and filter usage by Workspace name and Environment name instead.
- Collection name and Endpoint name are available on the API proxy calls and API calls metrics only.
FURTHER READING
Last updated: