Insights in Automation HQ and Embedded
Workspaces in Embedded and Automation HQ are organized into a hierarchy: a parent workspace provides centralized administrative oversight for a group of child workspaces. Insights dashboards created in a parent workspace automatically combine usage data from the parent workspace and all of its child workspaces. This page explains which metrics roll up, how to filter usage data by workspace, and the current limitations.
This documentation uses parent workspace and child workspace. The equivalent names are:
| Embedded | Automation HQ | |
|---|---|---|
| Parent workspace | Admin workspace | HQ workspace |
| Child workspaces | Customer workspaces | Managed workspaces |
FEATURE AVAILABILITY
Insights is available to customers on specific pricing plans. Refer to your pricing plan and contract to learn more.
Usage data aggregation requires an eligible credit-based plan, and the report builder it depends on is in private beta. Contact your Customer Success Manager to enable it.
What data is aggregated
Only usage metrics aggregate across a parent workspace and its child workspaces. They include the following:
- Credits
- Tasks
- API calls
- API proxy calls
- Events processed
- Genie actions
- IDP pages processed
- MCP tool calls
- Rows consumed
Refer to Usage metrics to learn how Workato measures each metric.
Default behavior
Dashboards you build in the parent workspace combine usage data automatically. You can apply a filter to display data for specific workspaces.
Child workspaces maintain strict boundary isolation and can only view their own workspace data.
Filter usage data by workspace
Complete the following steps to display usage data for individual workspaces:
Add a Filter group to the dashboard.
Click + Add filter.
Keep Filter custom query chart? set to No.
Search for Workspace name in the Metric or dimension list.
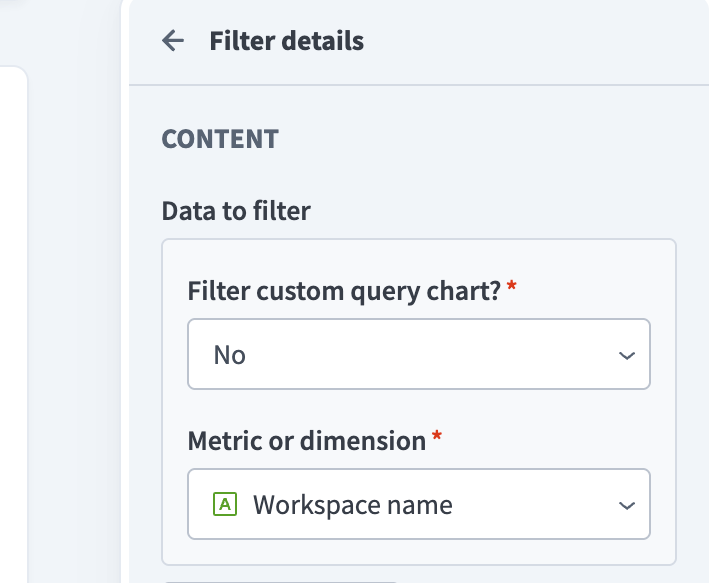 Search for the Workspace name dimension
Set a Default value with the workspace or workspaces to show, and add a Label.
Click Done, then Save.
Clear the filter to show combined data for all workspaces again.
You can also group a chart by the Workspace name dimension, for example credits by month for each workspace.
The same filter works with other usage dimensions, such as Environment name, Project name, and Recipe name. Filters match exact values.
What data isn't aggregated
No other metrics, dimensions, or data sources aggregate. The following show data for the current workspace only:
- Integrations metrics and dimensions, including job success rates, error rates, and job execution time
- APIs and Audit and governance metrics and dimensions
- Every query builder data source, including the Chart (Custom Query) component
Limitations
- Aggregation works only when you build charts in the report builder, not the query builder.
- The report builder's metric selector doesn't group metrics by category, so usage metrics can be hard to tell apart from others. Check that Workspace name is available as a dimension when you choose a metric.
- You must create dashboards separately in each workspace. You can't share a dashboard from the parent workspace with its child workspaces.
FAQs
Get answers to frequently asked questions (FAQs) about Insights dashboards in Automation HQ and Embedded workspaces.
Does my dashboard show only data from my current workspace by default?
View answer
- Parent workspaces: Dashboards built in the parent workspace automatically aggregate usage data from the parent and all connected child workspaces. You can apply a filter to isolate data for specific workspaces.
- Child workspaces: Child workspaces maintain strict boundary isolation and can only view their own workspace data.
Can child workspaces see data from other workspaces?
View answer
No. Each child workspace can only view its own data.
Do error rates and job history roll up to the parent workspace?
View answer
No. Only usage metrics aggregate.
Last updated: