Filter groups
Filter groups allow you to apply multiple filters simultaneously across different datasets and visualizations in a dashboard. Grouping filters enables you to control the data displayed on the entire dashboard with a single action. This simplifies the analysis of specific subsets of data by ensuring consistent filter criteria across all elements without modifying individual charts. Alternatively, you can apply filter groups to individual containers to focus on specific data subsets within those containers.
For example, in a dashboard that provides an overview of workspace usage, a filter group allows you to select a specific time period. All charts, tables, and graphs in the dashboard update to display data only for that period.
 Apply multiple filters at the workspace-level
Key features
The following key features enhance your ability to filter, analyze, and compare data across dashboards:
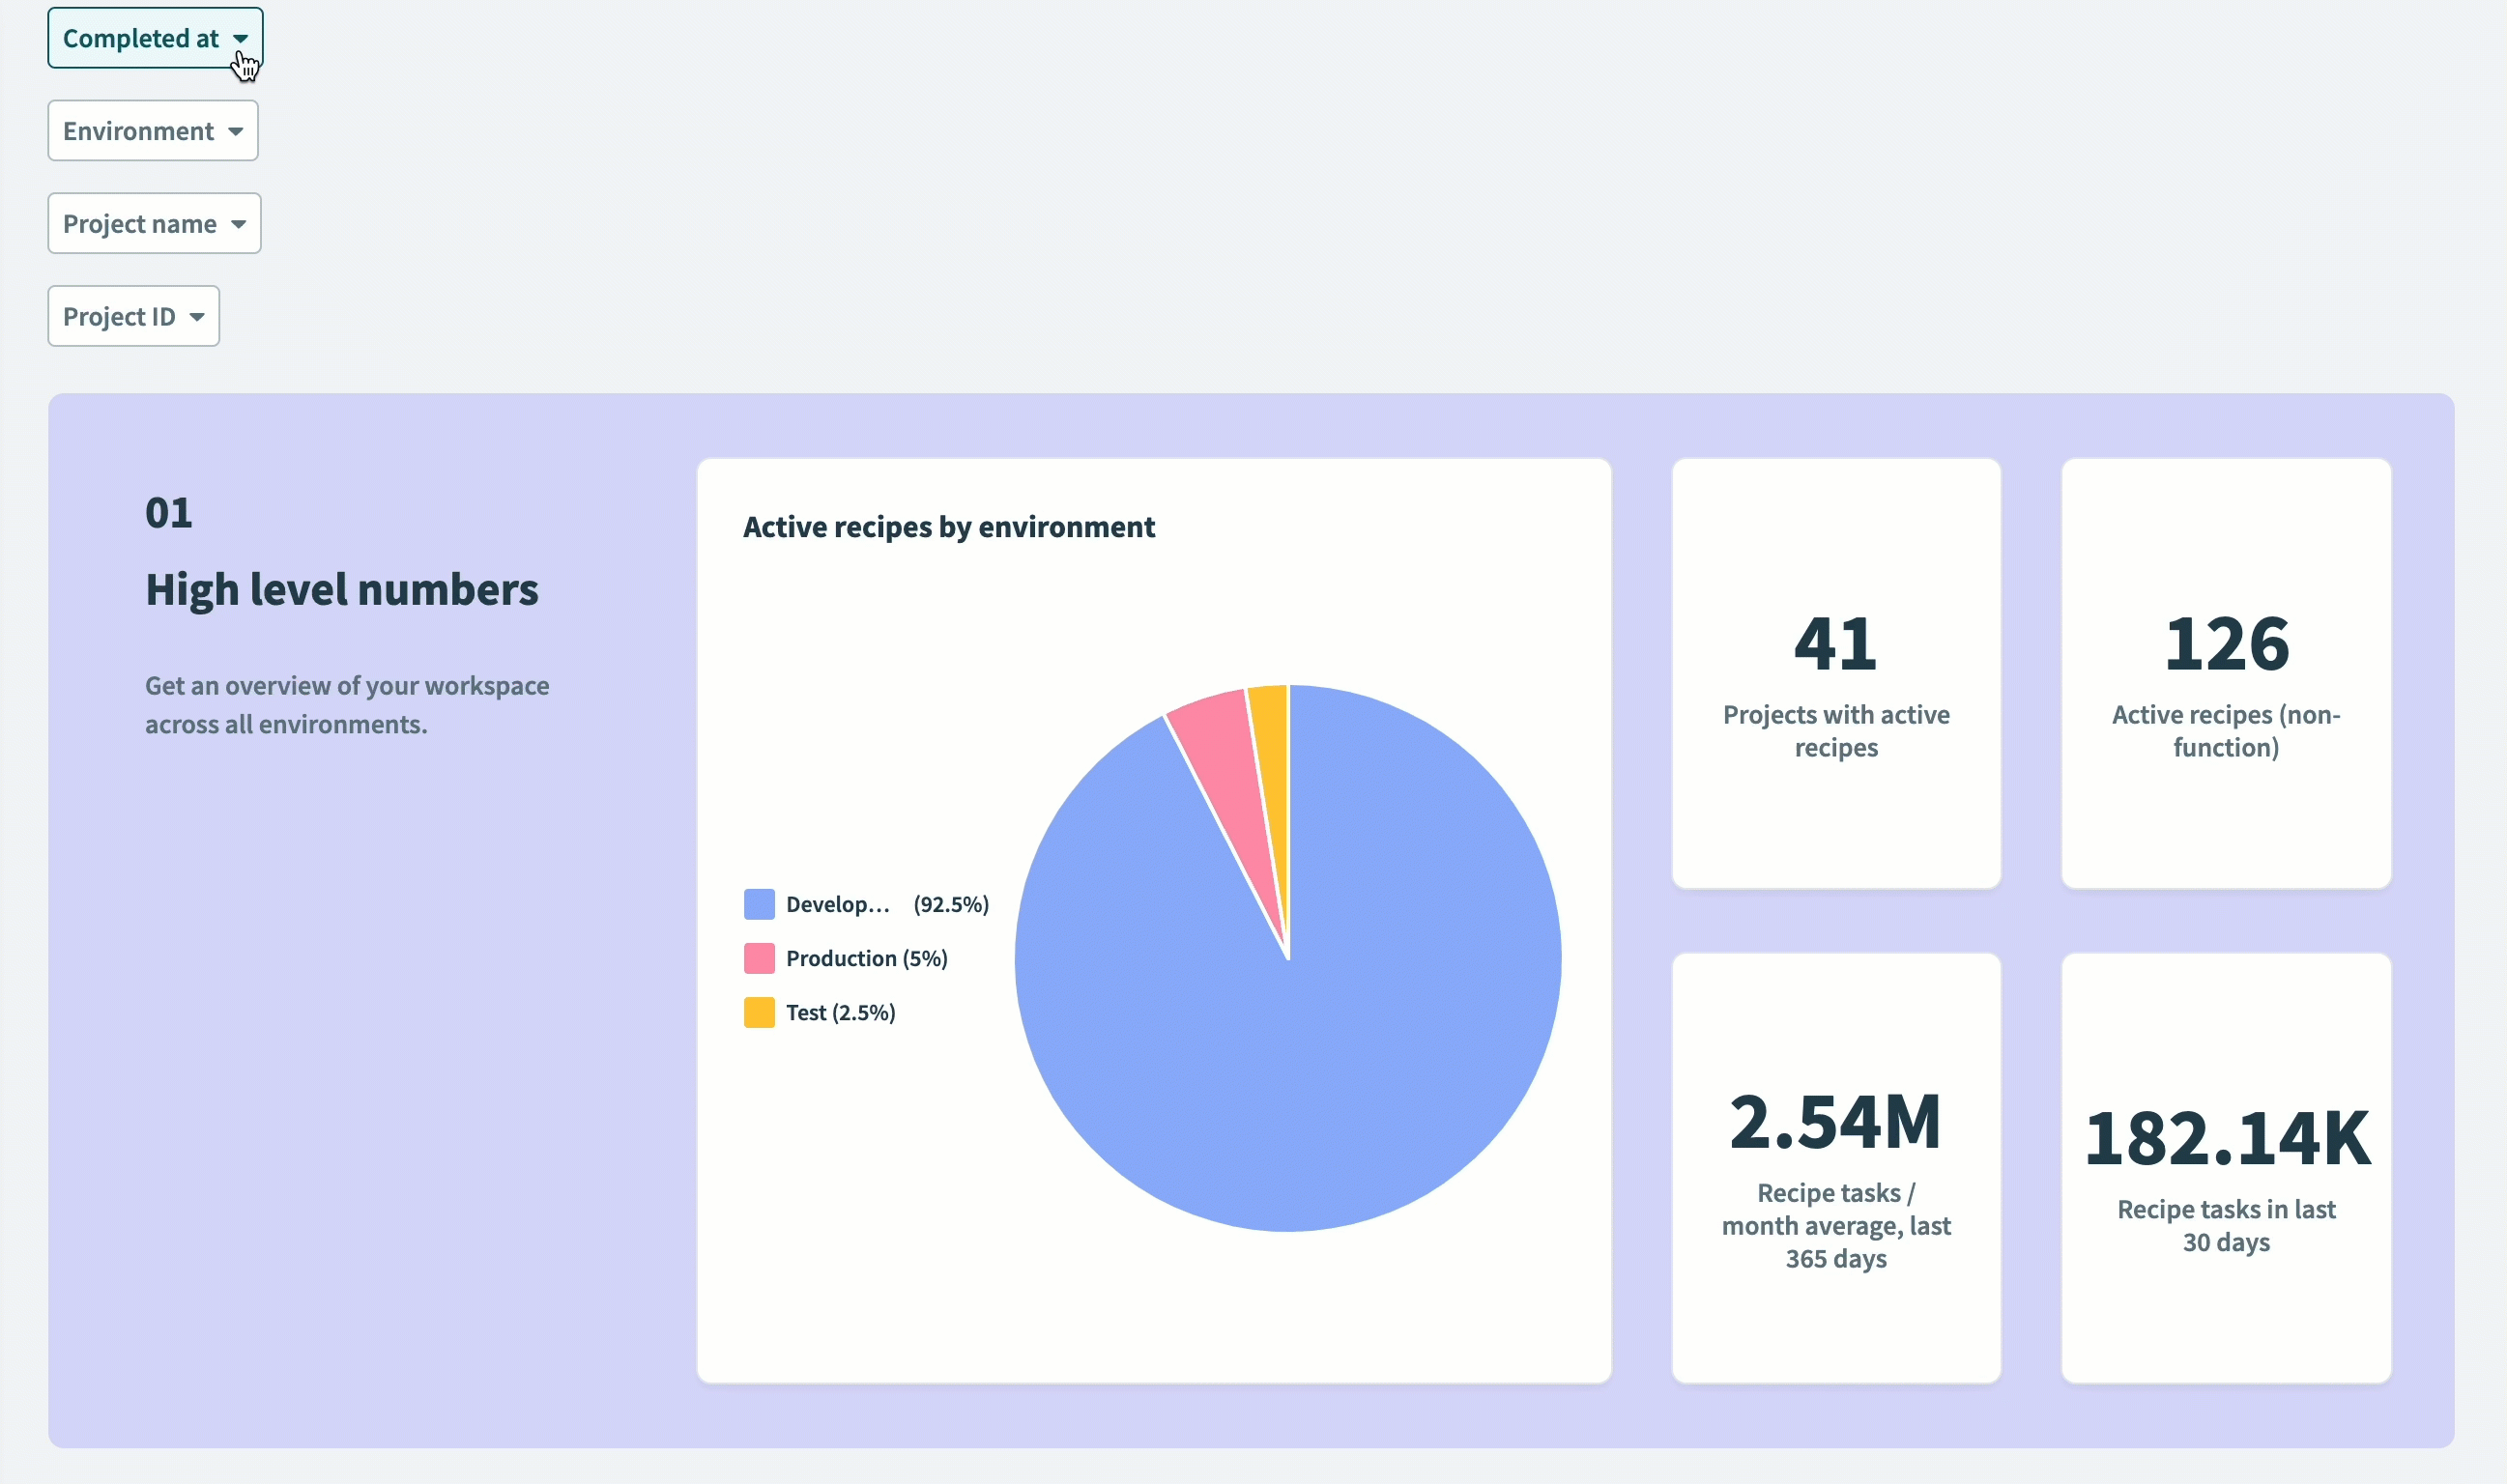
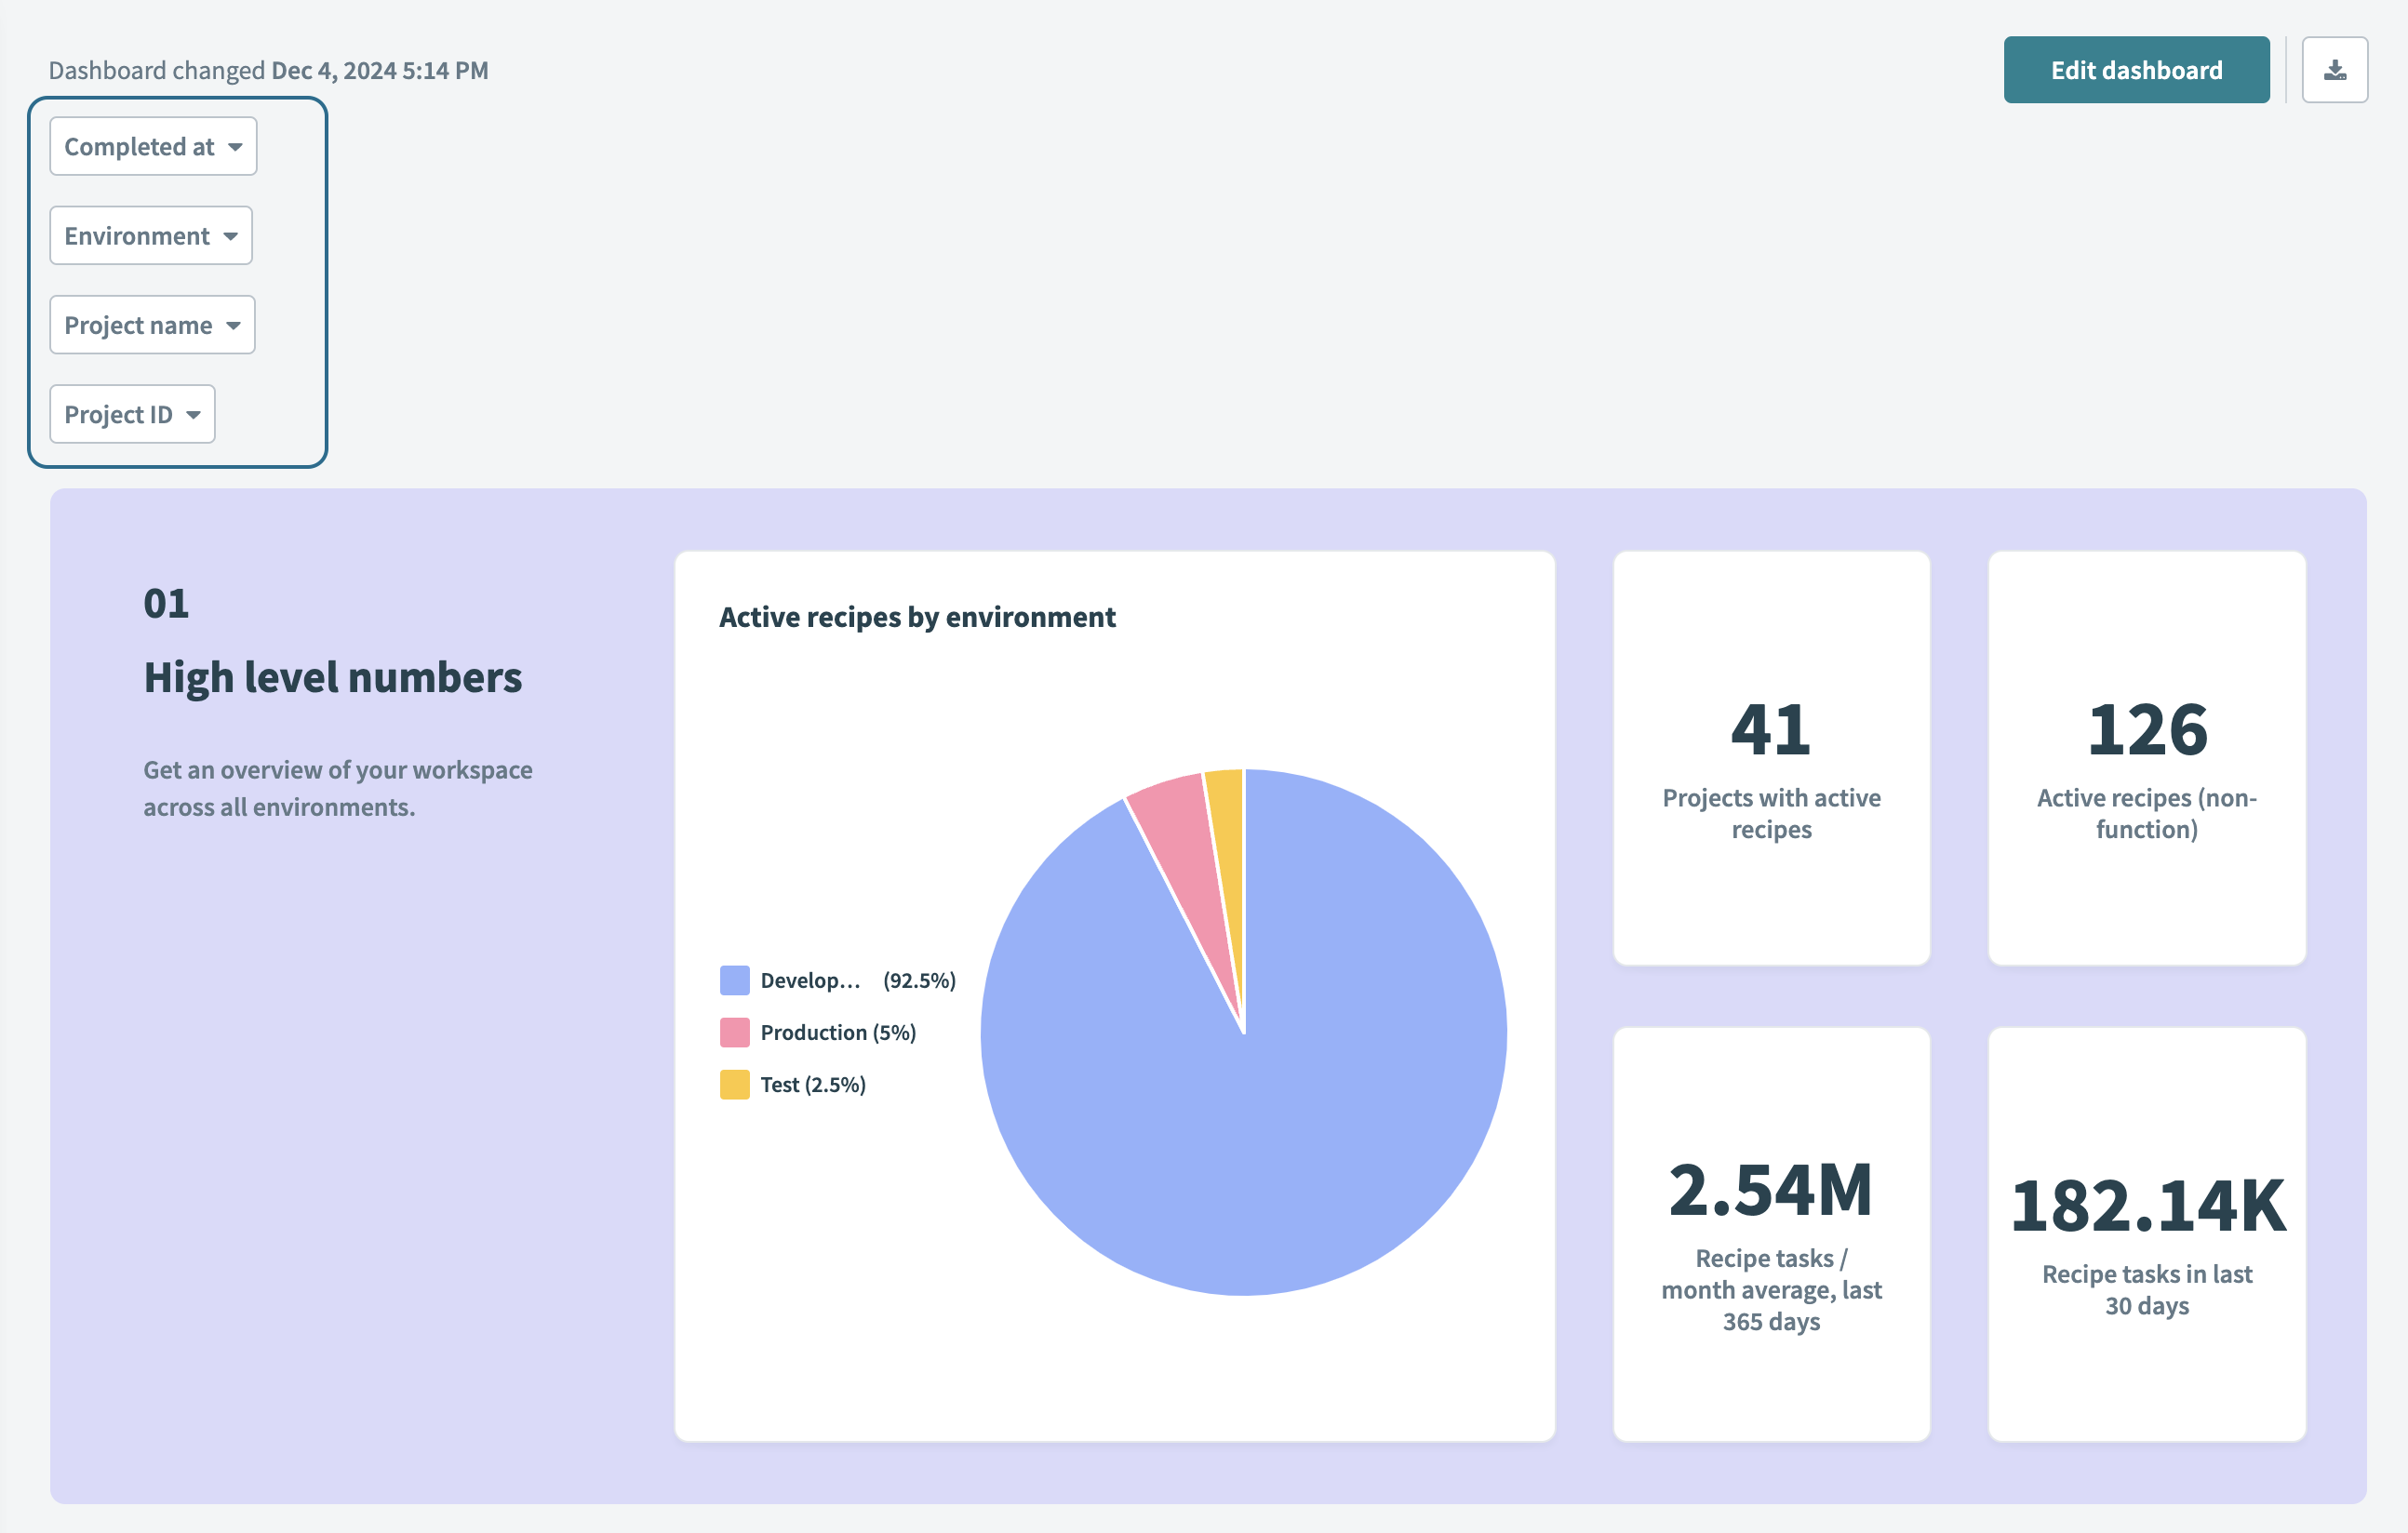
Adjust the dashboard view at a high level: Apply filters to the entire dashboard or specific containers without modifying individual charts and queries. This streamlines data management, ensures consistency across the dashboard, and saves time.
Drill down to specific categories: Focus on data from specific environments (dev, test, or prod), projects, recipes, or time periods. This enables you to isolate and analyze relevant data to identify trends, issues, and opportunities.
Compare metrics across different contexts: Use a single chart to view and compare metrics for various environments, projects, or recipes. You can analyze data side by side to support decision-making and performance evaluation.
Filter levels
Insights supports applying filter groups at both the dashboard and container levels. You can apply multiple filters simultaneously to the dashboard and individual containers.
Dashboard-level filters
You can apply dashboard-level filters to all charts in the dashboard, regardless of the containers they appear in. Use a data source column to define the filter criteria, and the filter automatically updates all relevant charts.
For example, if you configure a dashboard filter to display workspace usage for 1/01/2024–1/31/2024, all charts with a date field show data only for that period.
 Dashboard-level filters
Container-level filters
Container-level filters apply only to charts within a specific container, based on the container’s data sources.
For example, if you set a container-level filter to display a specific category, such as Support or Project name, only the charts within that container reflect the filtered data. Charts in other containers remain unaffected.
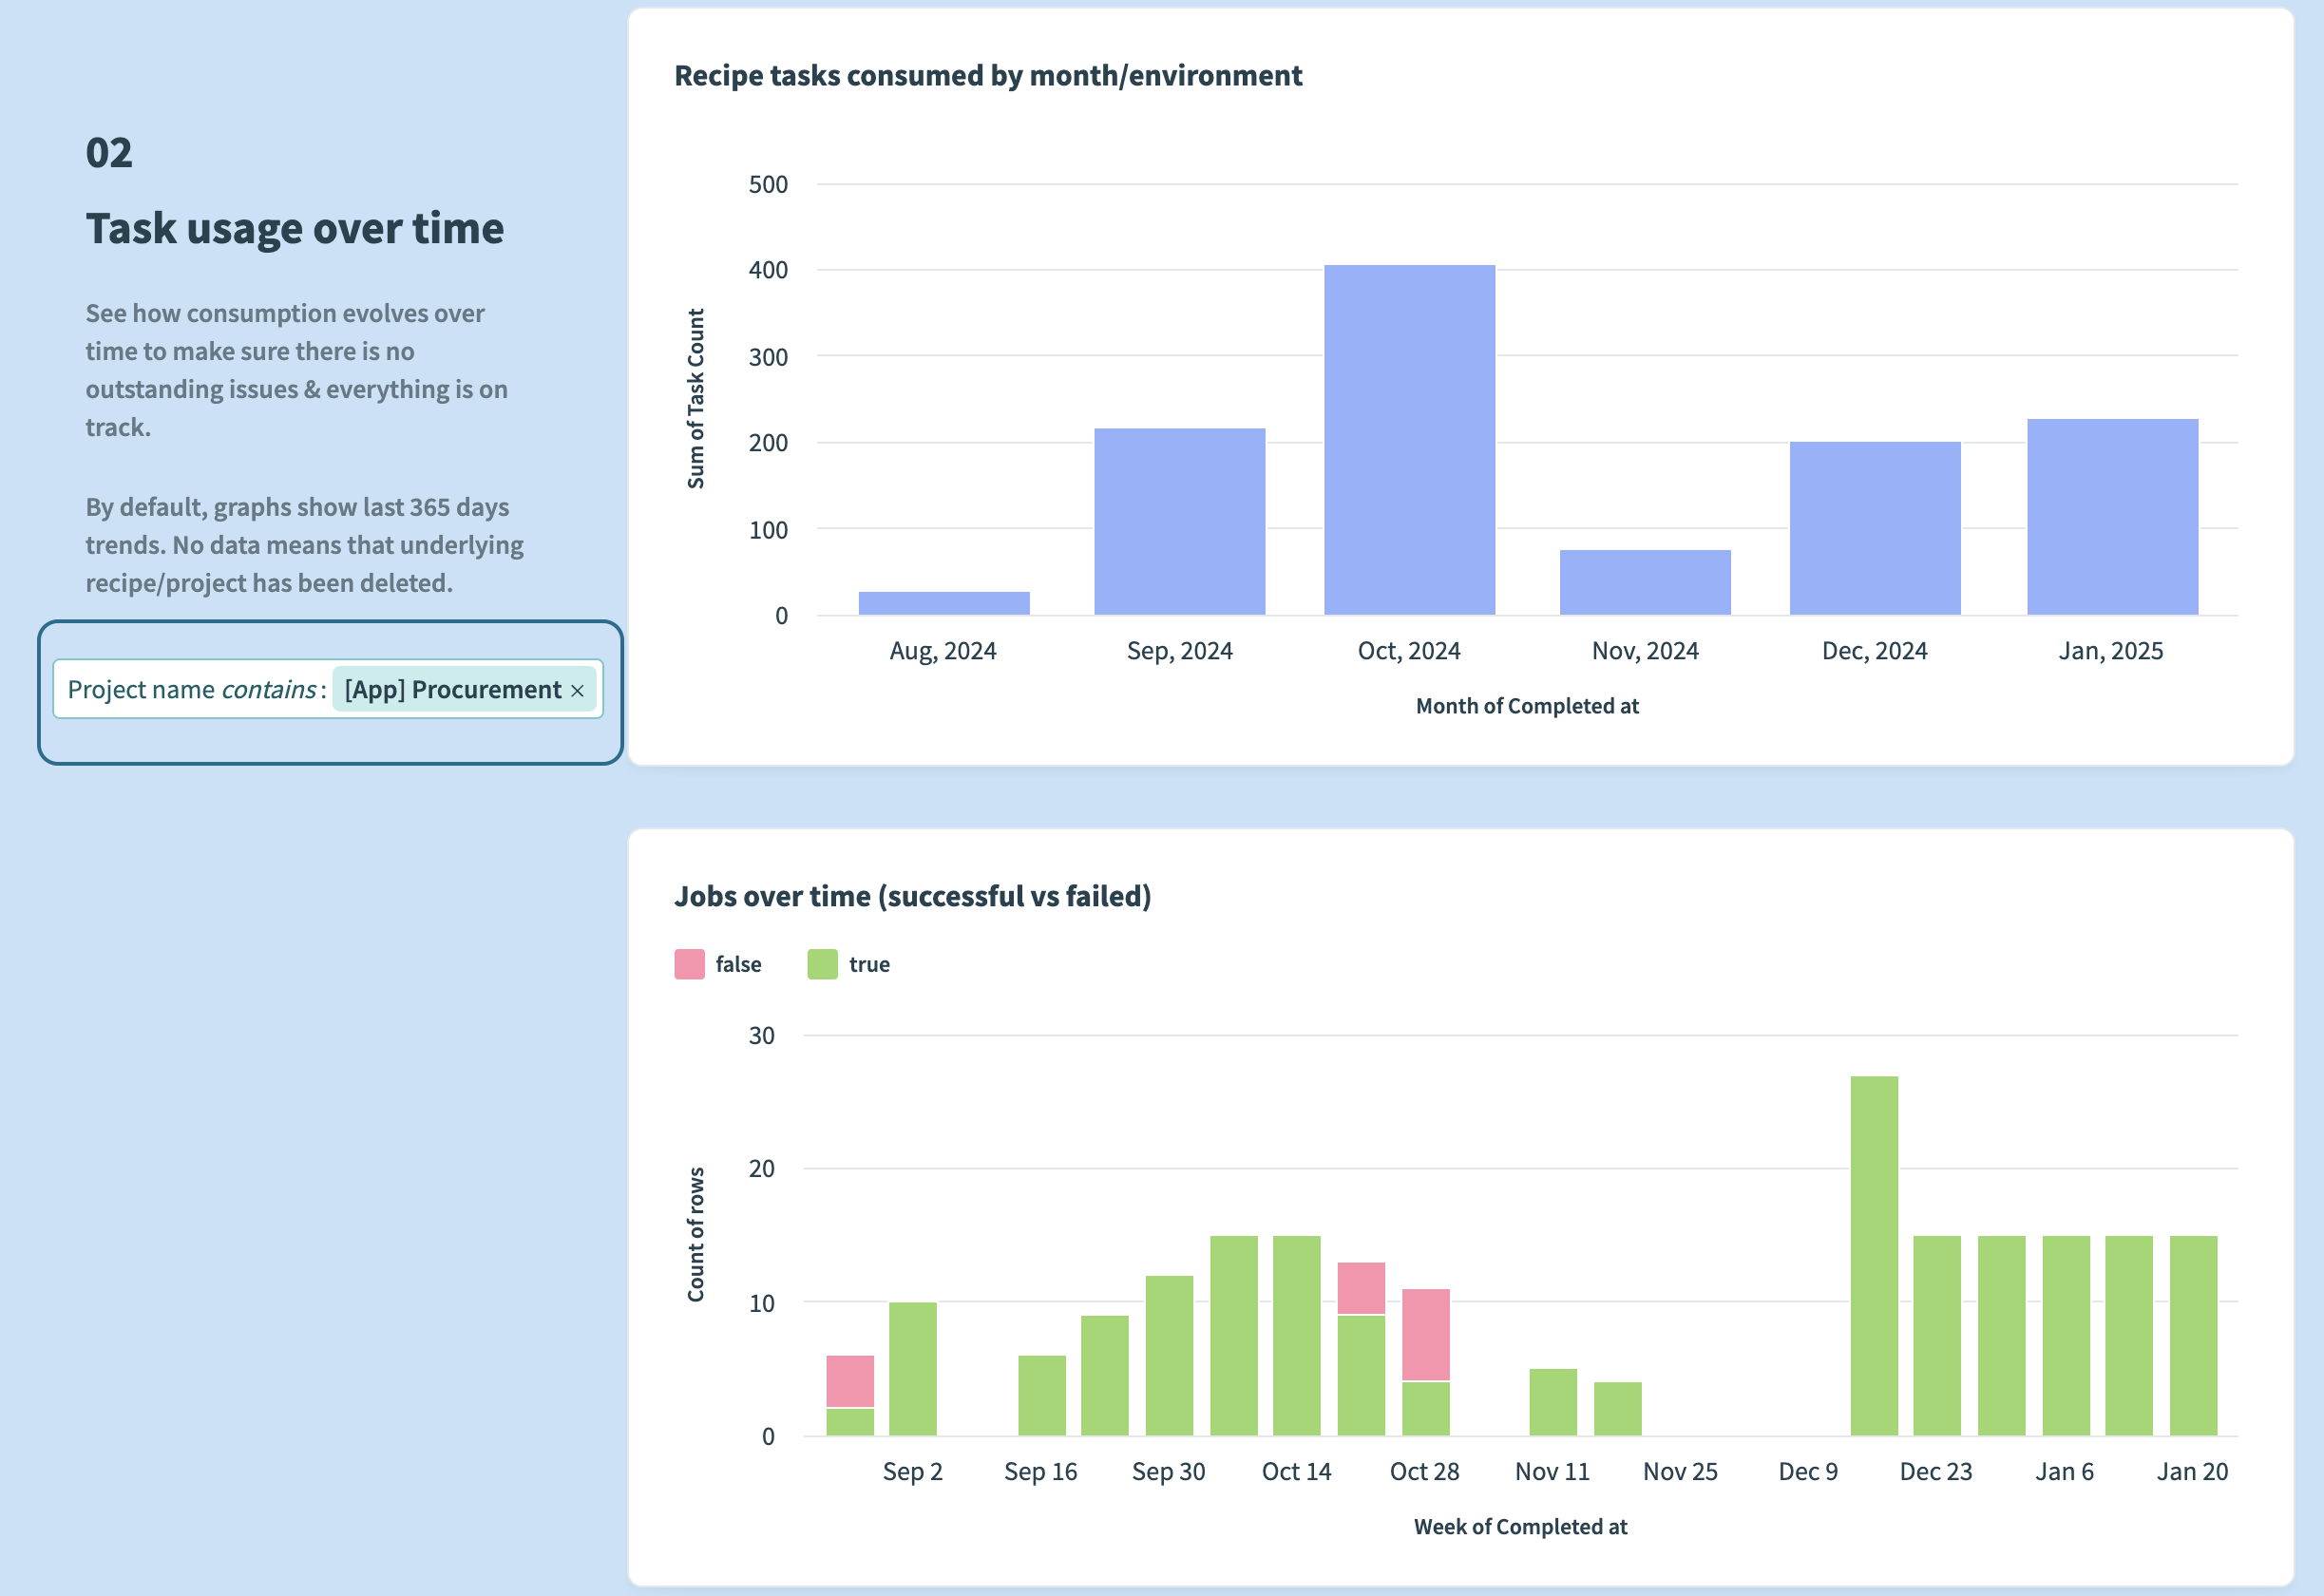 Container-level filter
Filter logic
You can create filters with multiple conditions, which follow AND chaining logic. This means that all conditions must be true for data to appear in the dashboard or container where the filter is applied.
For example, if a filter requires the date to fall within 1/01/2024–1/31/2024 and the category to equal Support, only data matching both conditions (January and Support) appears.
This logic applies both within a filter group, across filter groups, and between dashboard-level and container-level filters.
Examples of filter logic
The following examples illustrate how aligned and conflicting conditions affect the data displayed in dashboards and containers.
Aligned conditions
This example demonstrates aligned filtering conditions:
- Dashboard-level filter: Date
equals1/01/2024-1/31/2024AND - Container-level filter: Category
equalsSupport - Result: Displays support tickets from January.
Conflicting conditions
This example demonstrates conflicting filtering conditions:
- Dashboard-level filter: Date
equals1/01/2024-1/31/2024AND - Container-level filter: Date
equalsDecember - Result: No data is displayed, as both conditions can't be true at the same time.
Apply a filter
Complete the following steps to apply a filter to your dashboard:
Go to Platform > Insights.
Select an existing dashboard and click Edit dashboard.
Alternatively, click + (plus) to create a new one.
Drag and drop a Filter group component onto your dashboard. You can choose to apply the filter to the whole dashboard or to a specific container.
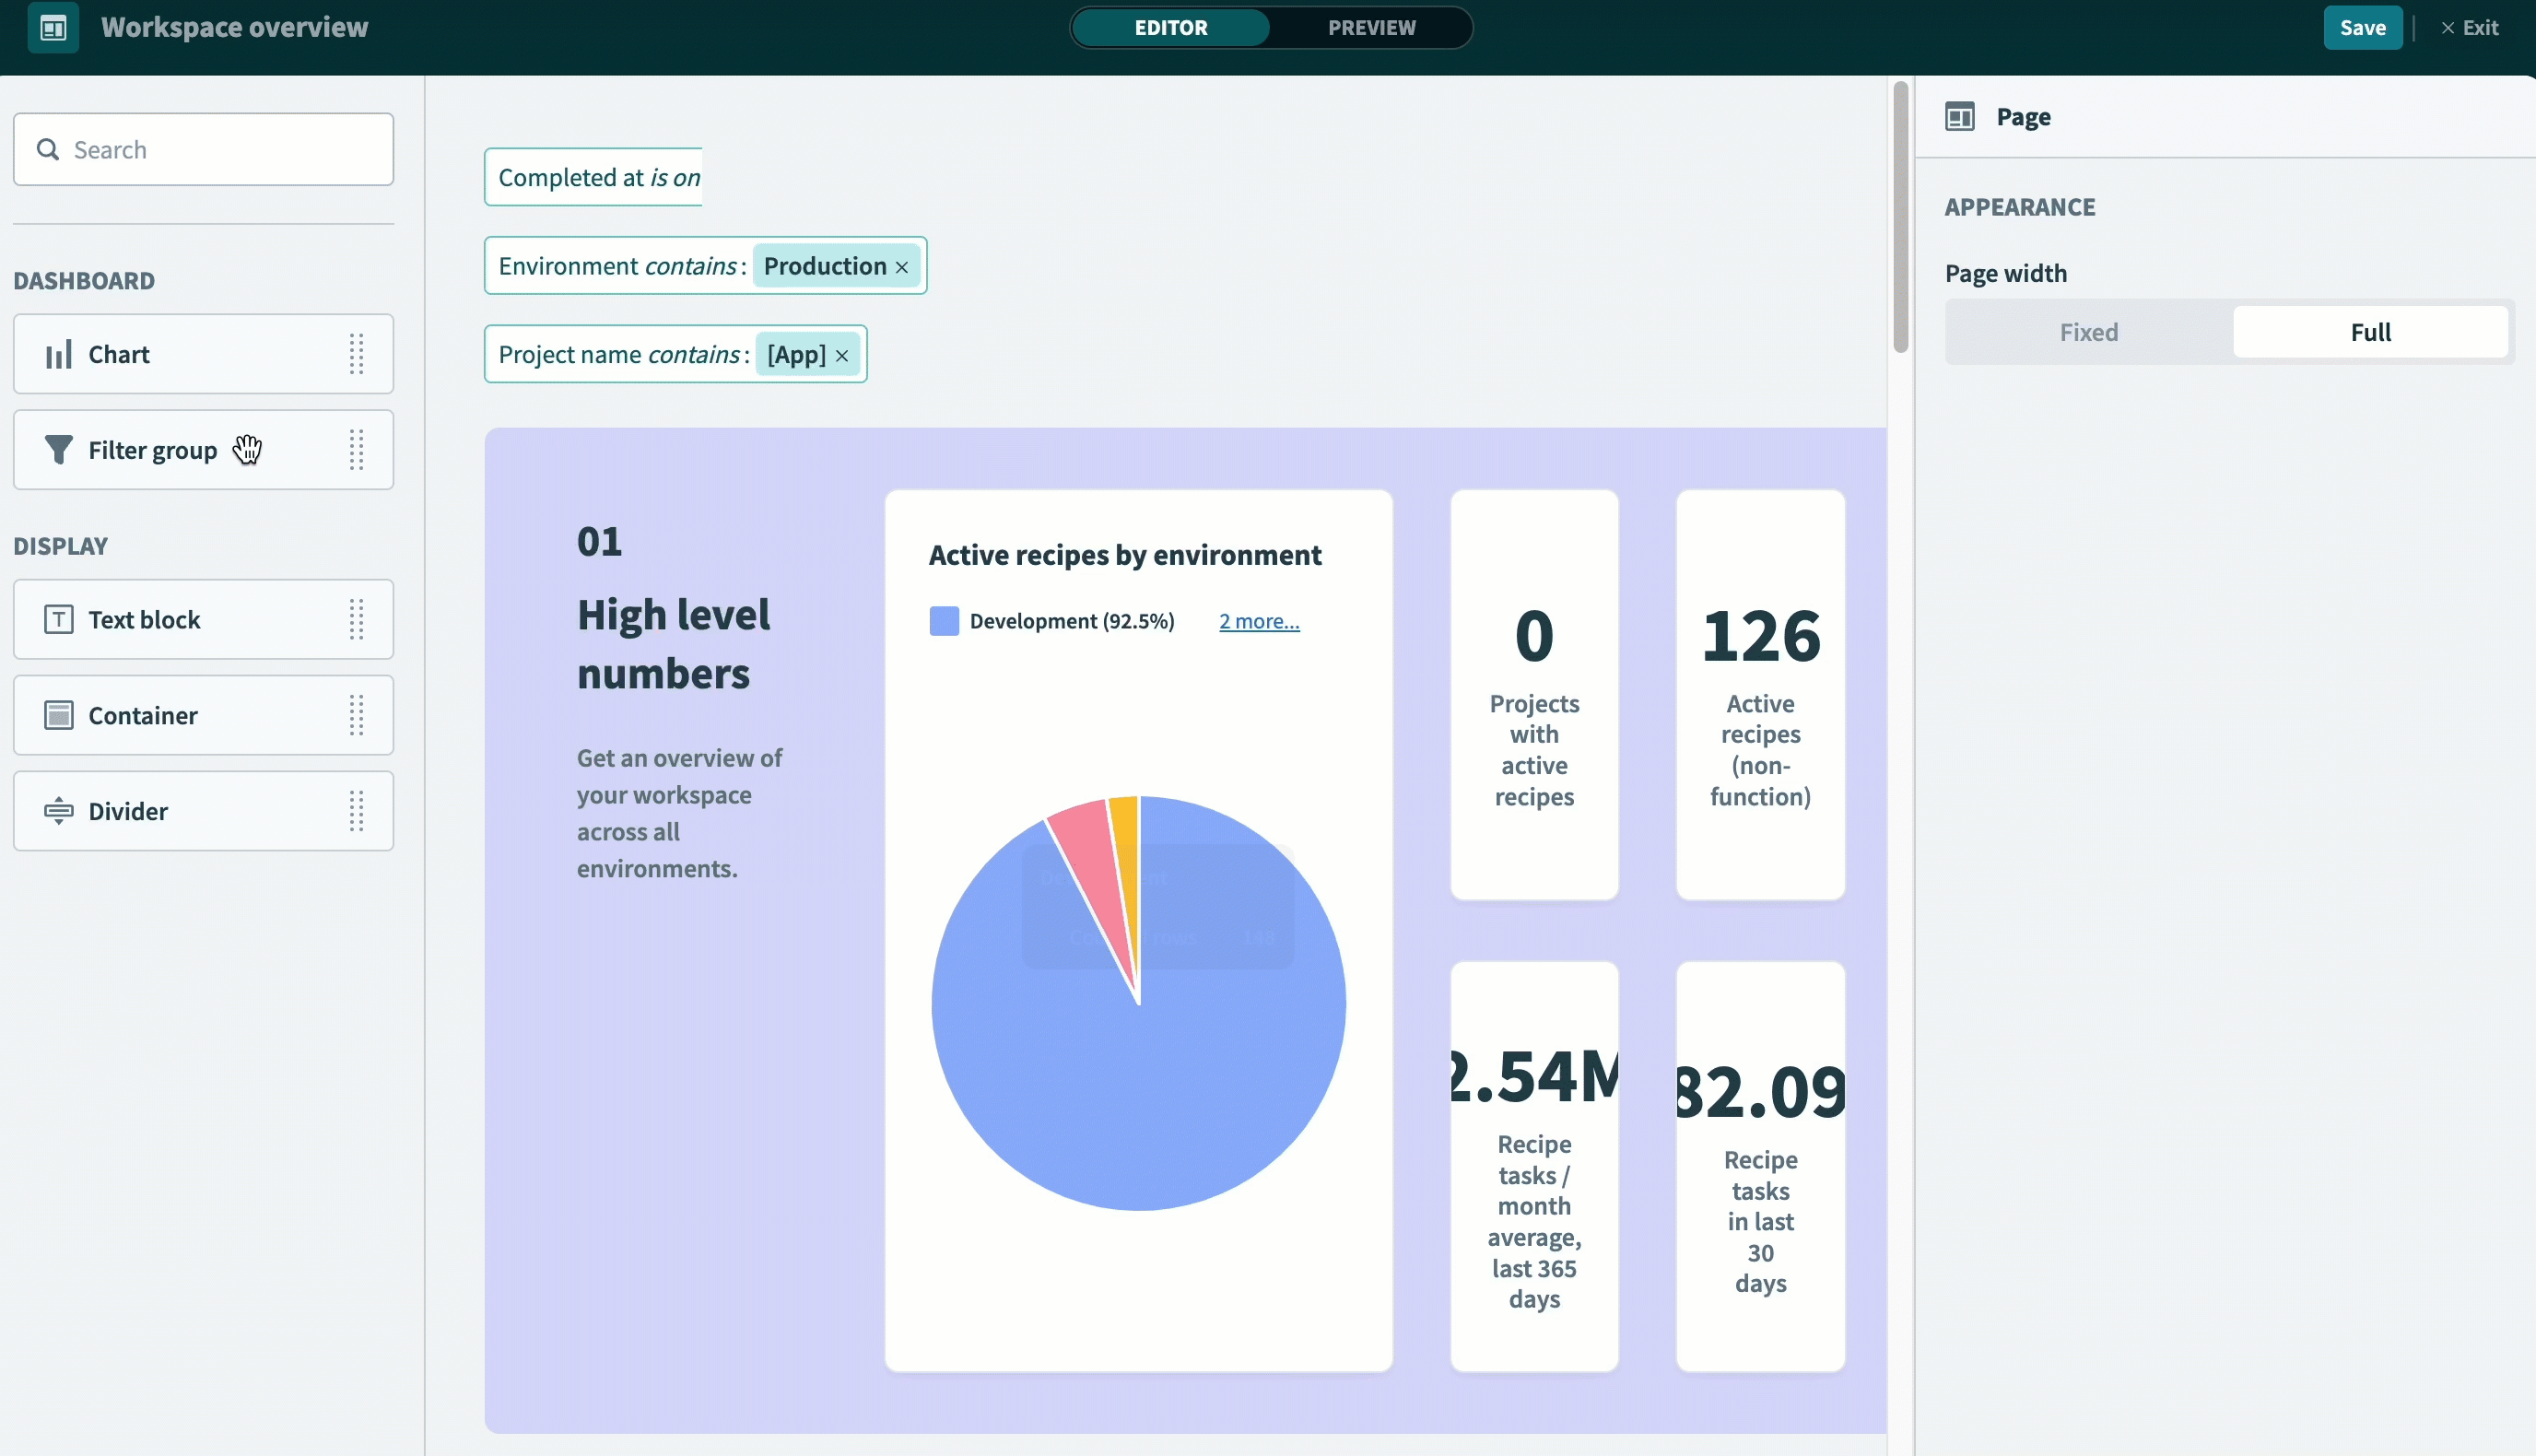 Image caption
Click + Add filter and select a Data source from the drop-down menu.
Select a Data column to filter by.
Create a Default value by choosing a condition and value. This filter is applied automatically by default.
Provide a Label for the filter.
Click Done and then Save to apply the filter to your dashboard.
Last updated: