# Manage dashboards
You can rename, clone, or delete Insights dashboards as your reporting needs change.
Refer to Edit components to learn how to edit dashboard components.
# Rename a dashboard
Complete the following steps to rename a dashboard:
Go to Platform > Insights.
Click the ... (ellipsis) next to the dashboard you plan to rename, then select Rename.
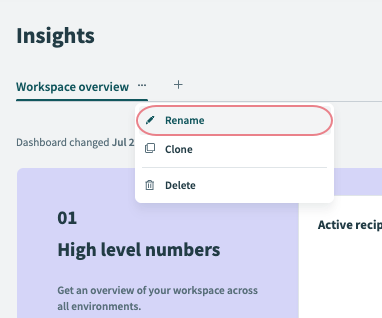 Rename dashboard
Enter a new name for the dashboard.
Click ✓ to confirm your changes.
# Clone a dashboard
Complete the following steps to clone a dashboard:
Go to Platform > Insights.
Click the ... (ellipsis) next to the dashboard you plan to clone, then select Clone.
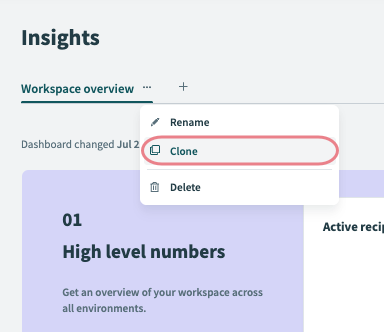 Clone dashboard
Workato automatically opens the cloned dashboard in the dashboard editor.
# Delete a dashboard
Complete the following steps to delete a dashboard:
Go to Platform > Insights.
Click the ... (ellipsis) next to the dashboard you plan to delete, then select Delete.
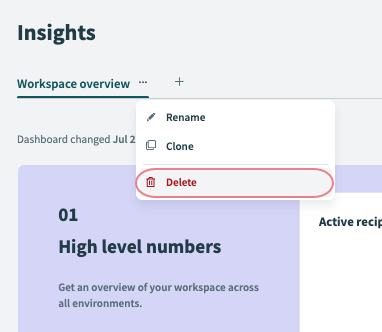 Delete dashboard
Click Delete dashboard again to confirm.
Last updated: 4/15/2026, 9:34:01 PM