Navigate Insights
Insights has three main interfaces: the Insights homepage, the dashboard editor, and the chart editor.
- Insights homepage: The central hub for managing your dashboards. View, rename, download, create, and delete dashboards from this page.
- Dashboard editor: Add charts and filter groups to your dashboard, and customize its appearance with text blocks, containers, and dividers.
- Chart editor: Build and edit charts by defining your data source, calculated fields, and display formats.
Insights homepage
The Insights homepage is where you manage all your dashboards.
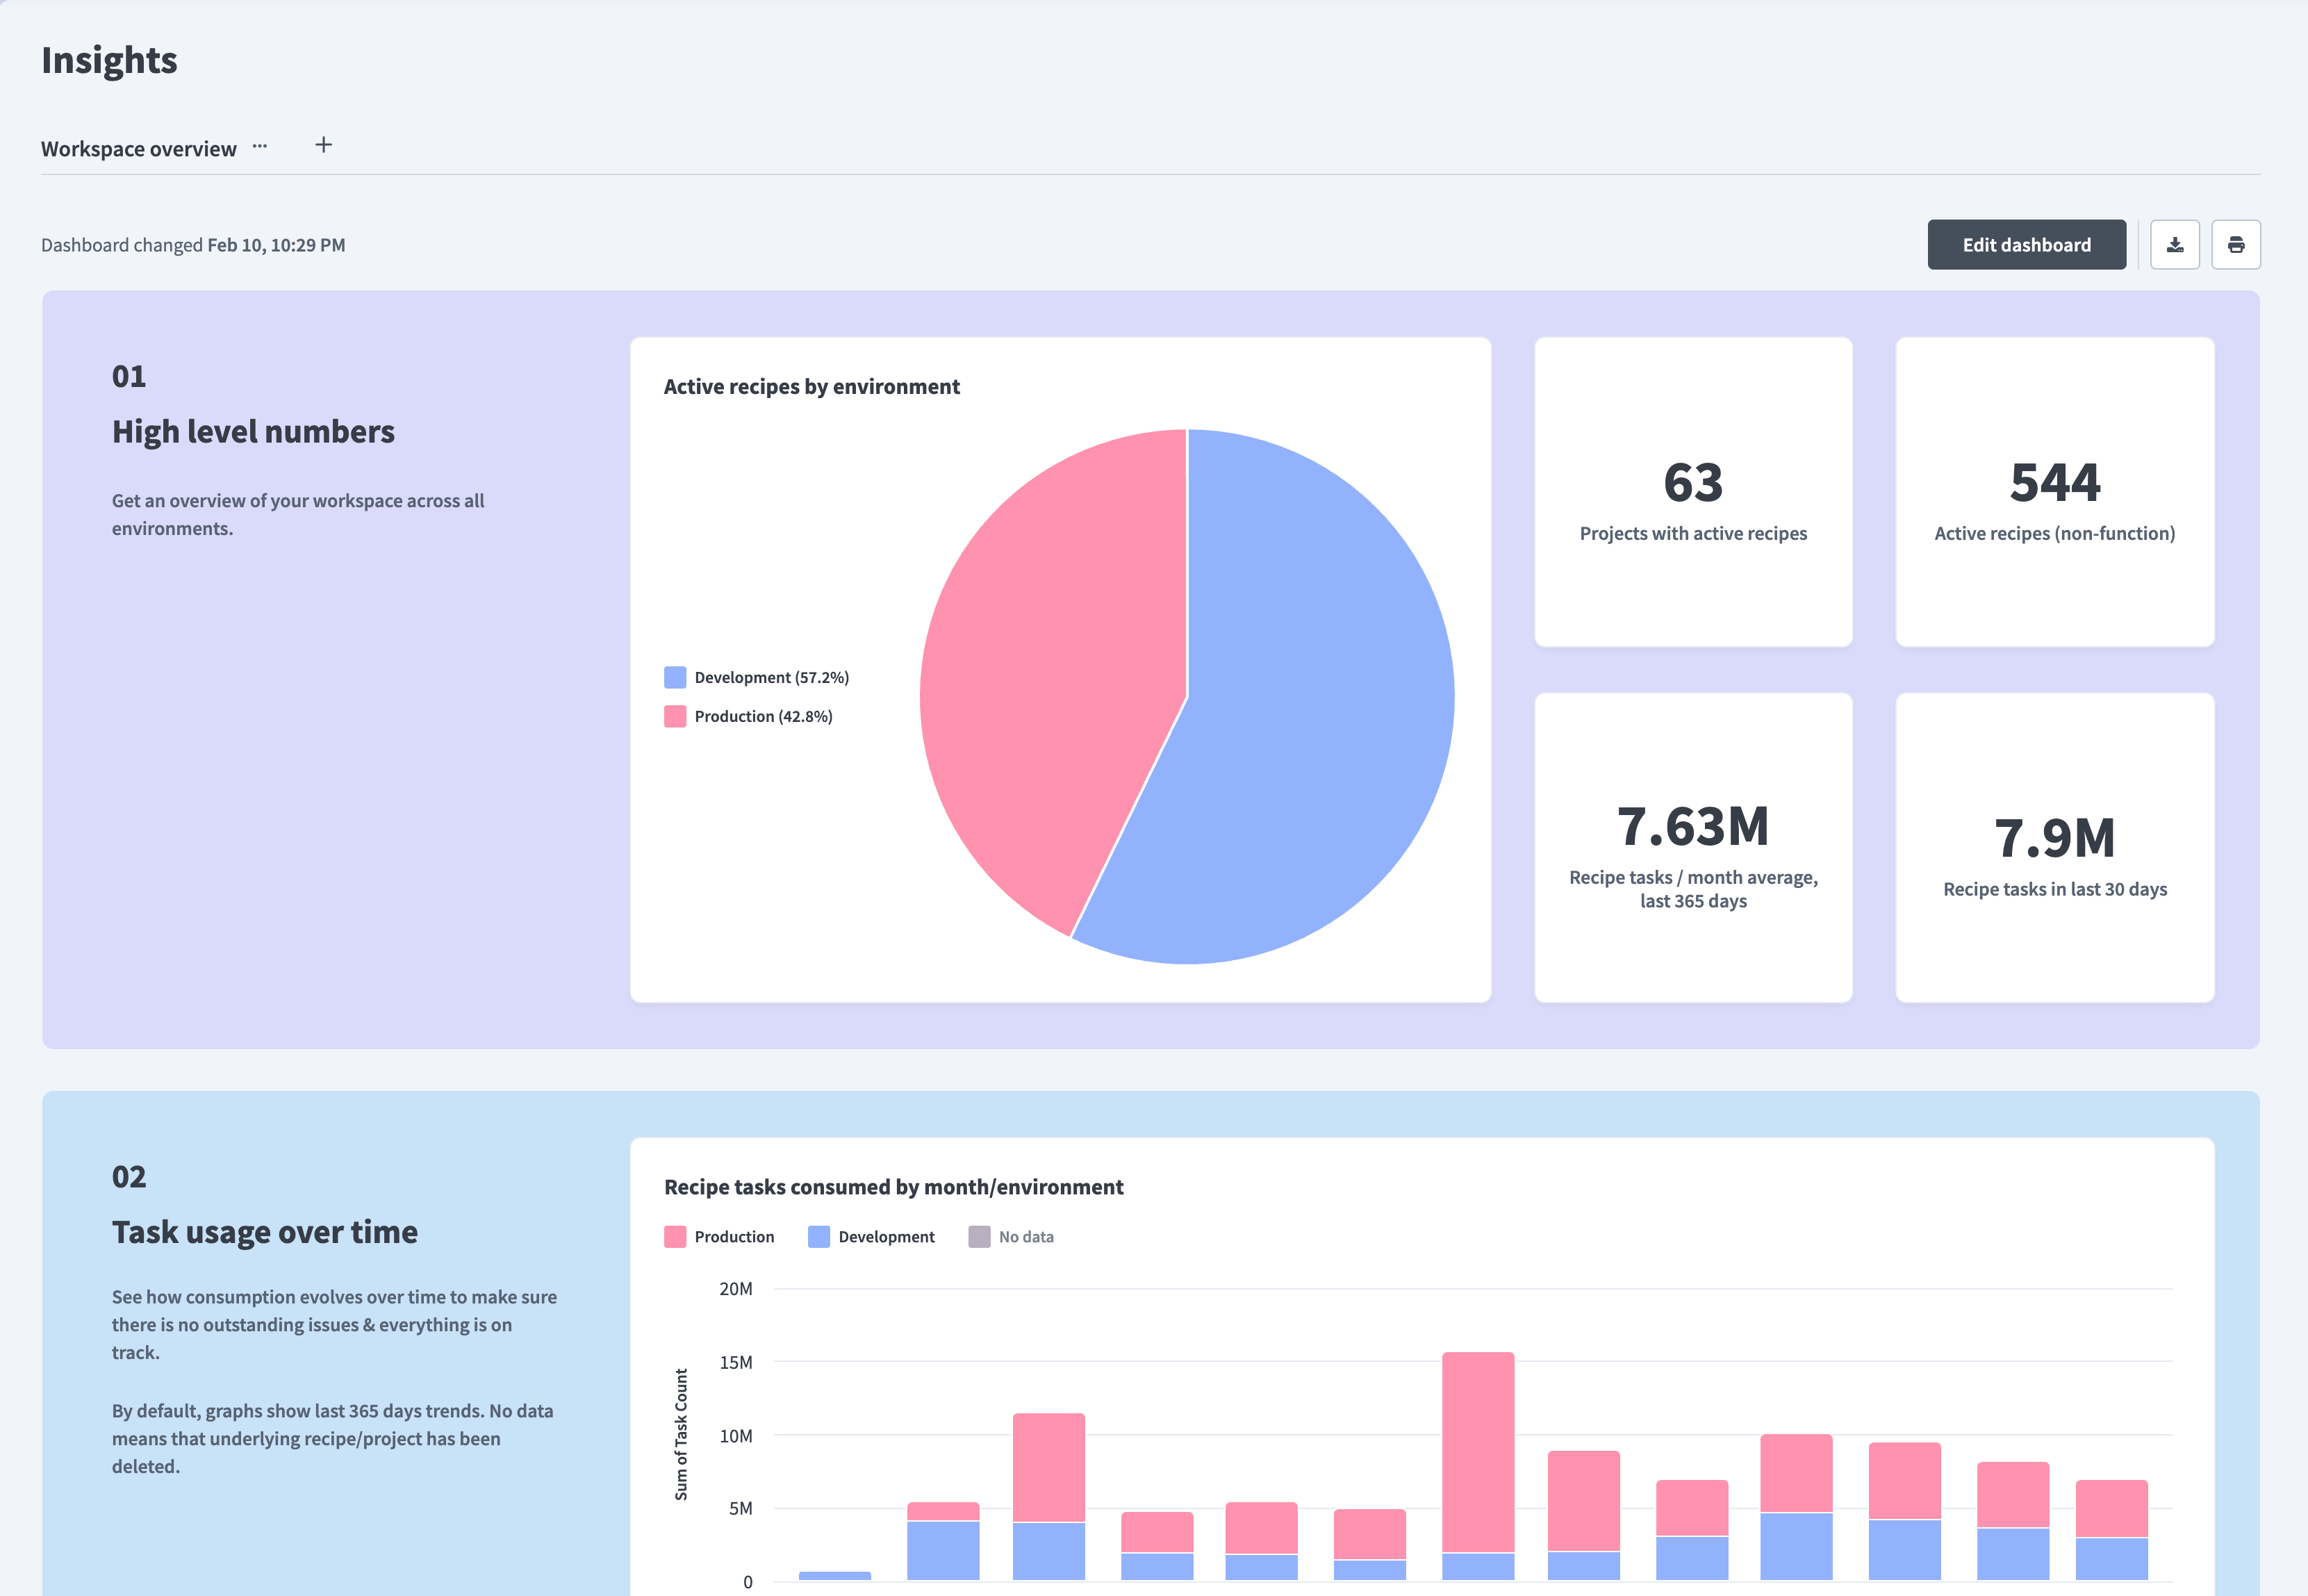 Insights homepage
Use the dashboard tabs to switch between dashboards, create new dashboards, or clone, rename, and delete existing dashboards. Click Edit dashboard to open the dashboard editor.
You can also download a dashboard as an image. Note that downloaded images don't include the underlying dataset.
Dashboard editor
The dashboard editor is where you build and arrange your dashboard.
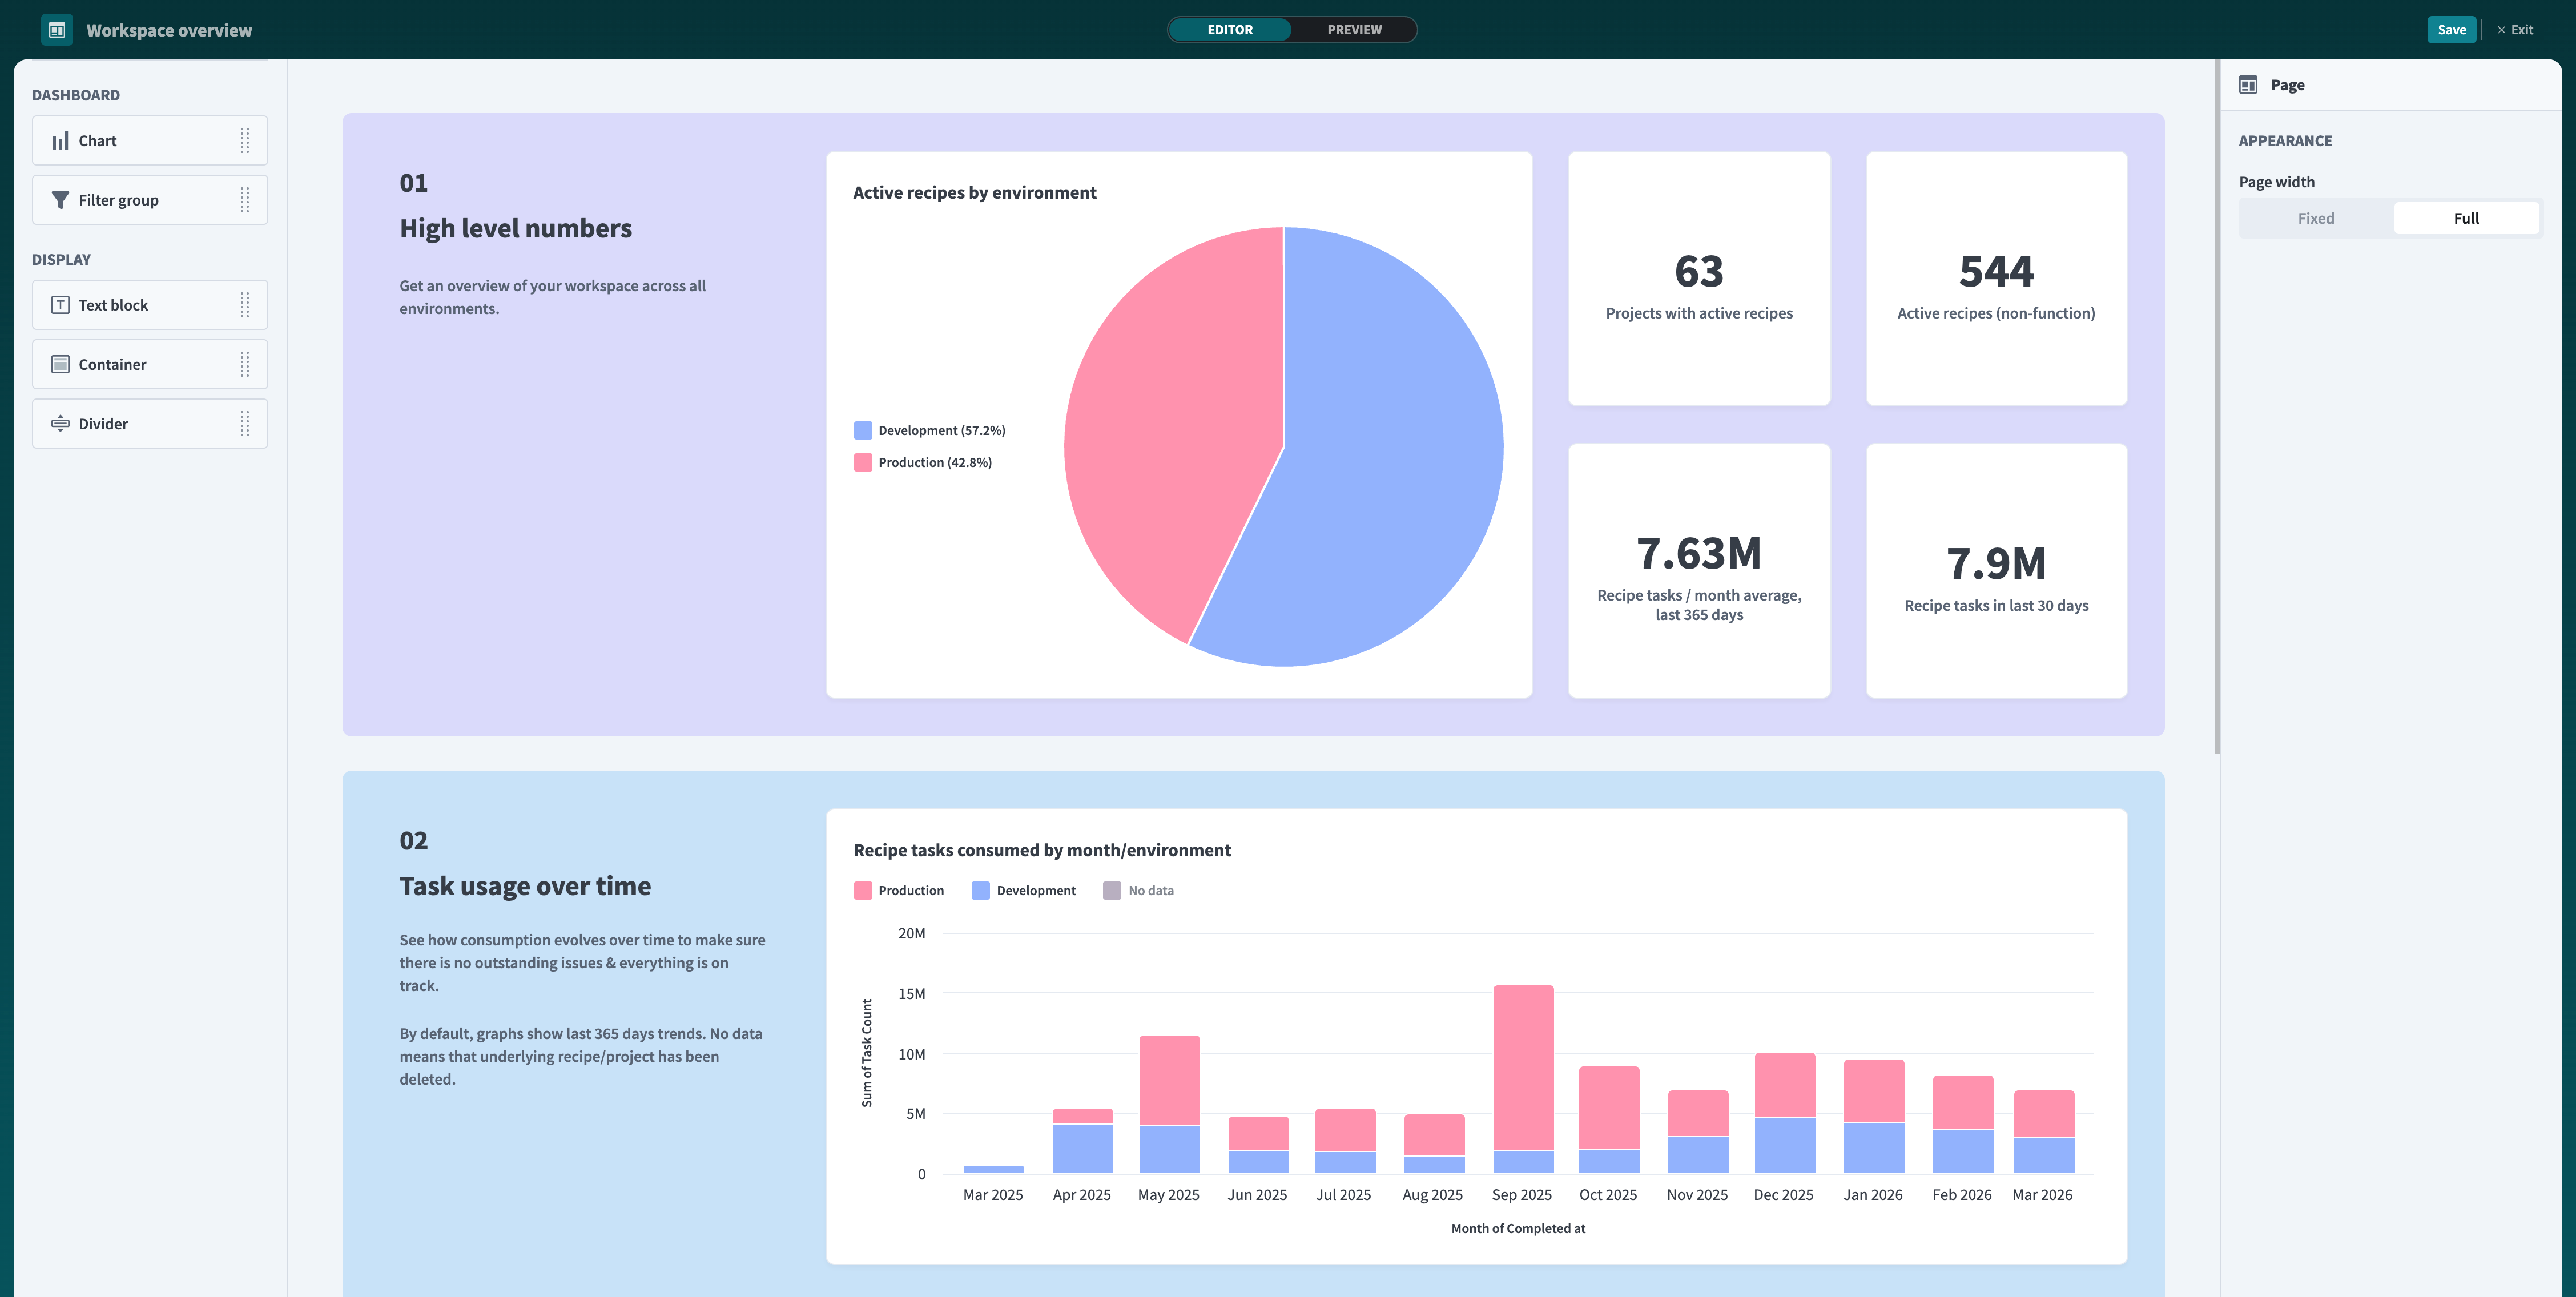 Dashboard editor
The dashboard editor has four main areas:
- Components panel: Contains all available components, organized into two types:
- Dashboard components (Chart, Filter group) display and filter your data.
- Display components (Text block, Container, Divider) control the visual appearance of your dashboard.
- Dashboard canvas: The area that displays to your end users. Click a component to edit, resize, arrange, or delete it.
- Editor panel: Use Editor and Preview to switch modes. Click Save to save your dashboard, and Exit to return to the homepage.
- Component properties panel: Customize the selected component. Select a Display component to edit its style, a Filter group to configure filters, or a Chart to edit chart data or clone and delete it.
REPORT BUILDER
The Dashboard section of the components panel displays specific chart types such as Bar, Pie, and Line instead of a single Chart component for users with report builder access.
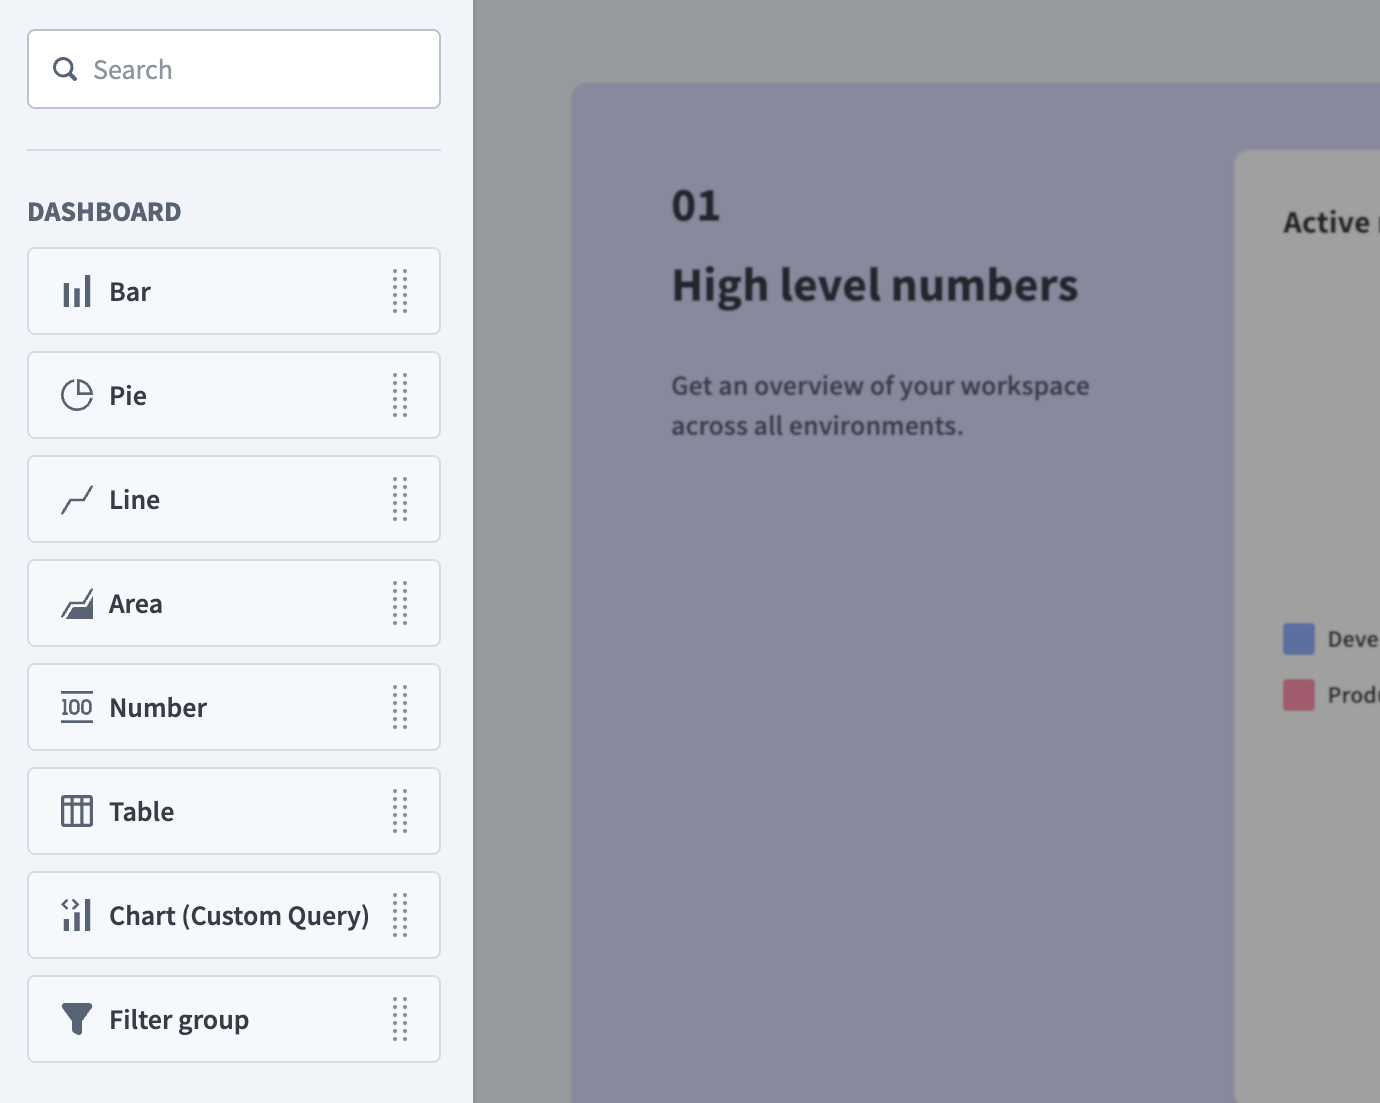 Dashboard editor with Report builder: the components panel shows specific chart types (Number, Table, Bar, and others) along with a Filter group option
Chart editor
The chart editor is where you build and configure charts for your dashboard. Insights provides two chart editors: the report builder and the query builder.
You can open the chart editor in the following ways:
- Click an unconfigured chart.
- Select a chart and click the Edit icon.
- Select a chart and click Edit chart data in the component properties panel.
Report builder
The report builder is a streamlined interface for building charts from a single data source. You can access it by dragging a chart type, such as Bar, Pie, Line, Area, KPI, or Table, onto your dashboard canvas.
PRIVATE BETA
The report builder is in private beta. Private beta features are available by invite only. Contact your Customer Success Manager to enable this feature.
Workato may update feature functionality or change availability without prior notice during the private beta.
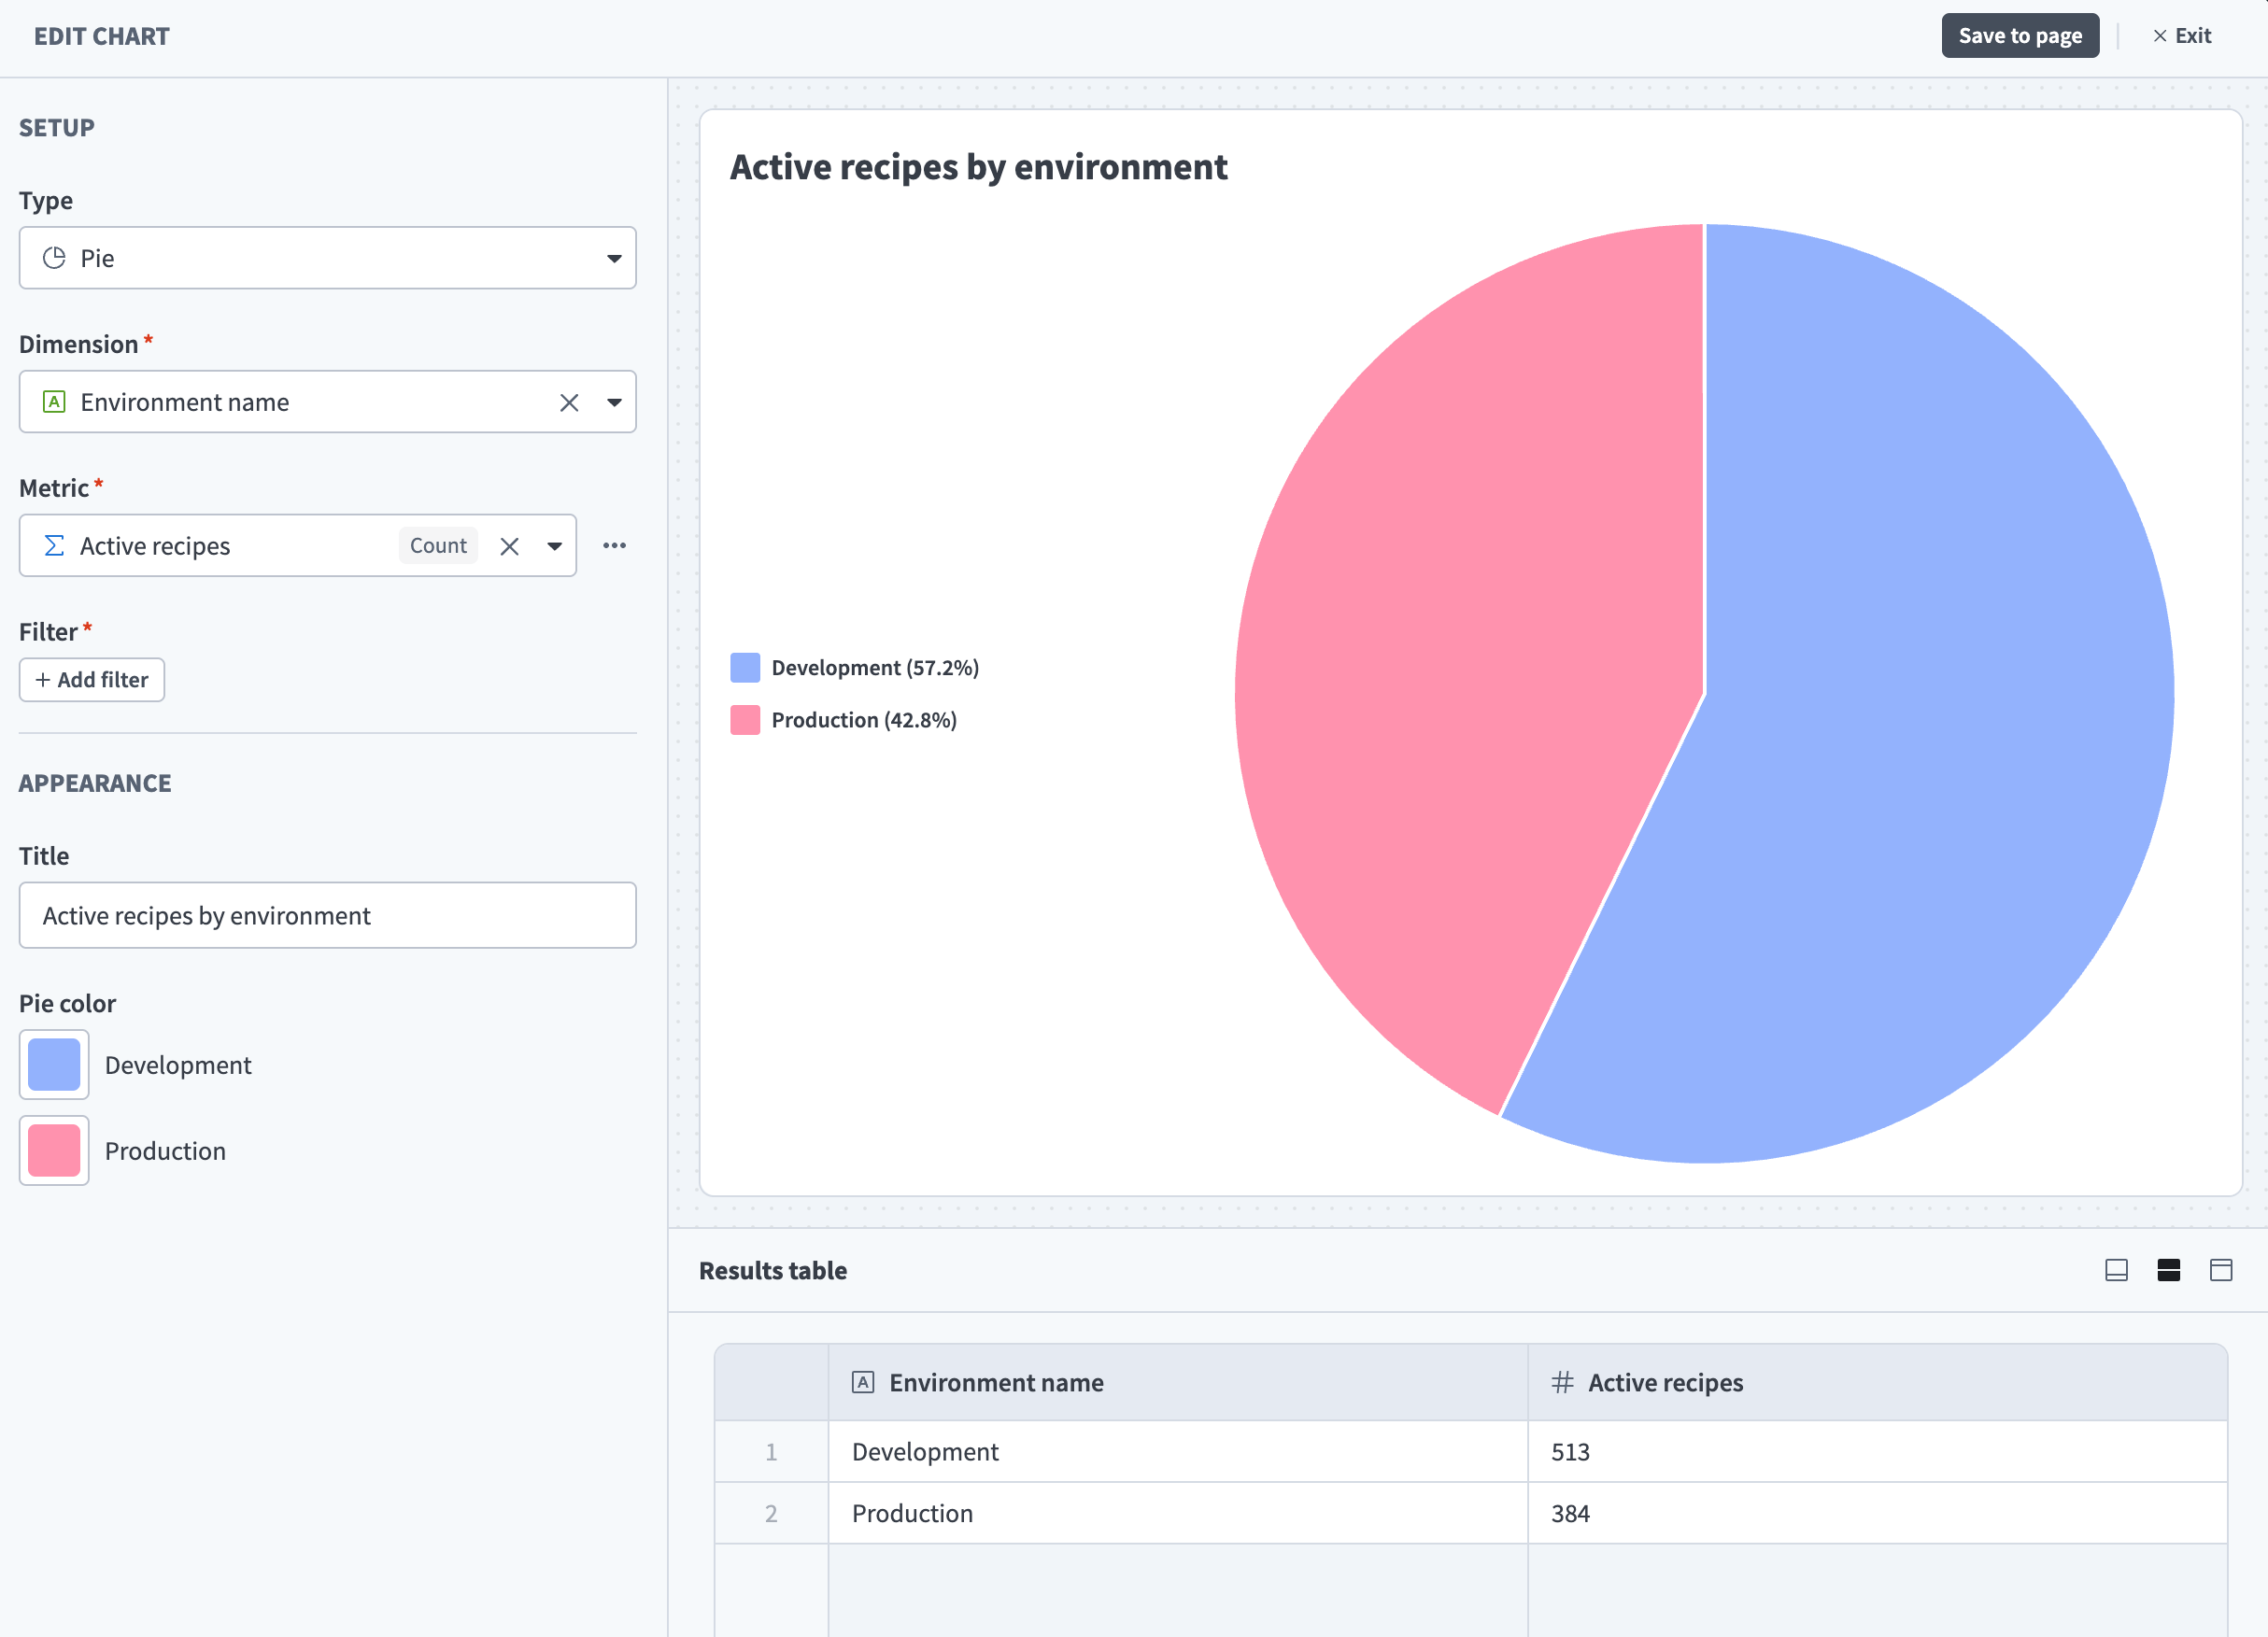 The report builder. This example shows active recipes by environment.
The report builder has three main areas:
- Setup panel: Configure your chart data and appearance. Use it to:
- Select metrics and dimensions
- Add optional filters and sort
- Customize formats and labels
- Chart canvas: Displays a live preview of your chart. Updates automatically as you adjust settings.
- Results table: Shows the data behind your chart. Use it to confirm your filters are returning the expected results.
Click Save to page to save your chart. Click Exit to return to the dashboard editor.
SWITCHING EDITORS
You can't switch to the query builder for an existing report builder chart. Drag Chart (Custom Query) onto your canvas to use the query builder.
Query builder
The query builder is a step-by-step interface for complex data transformations. You can access it by dragging the Chart component onto your dashboard canvas, or Chart (Custom Query) if you have report builder access.
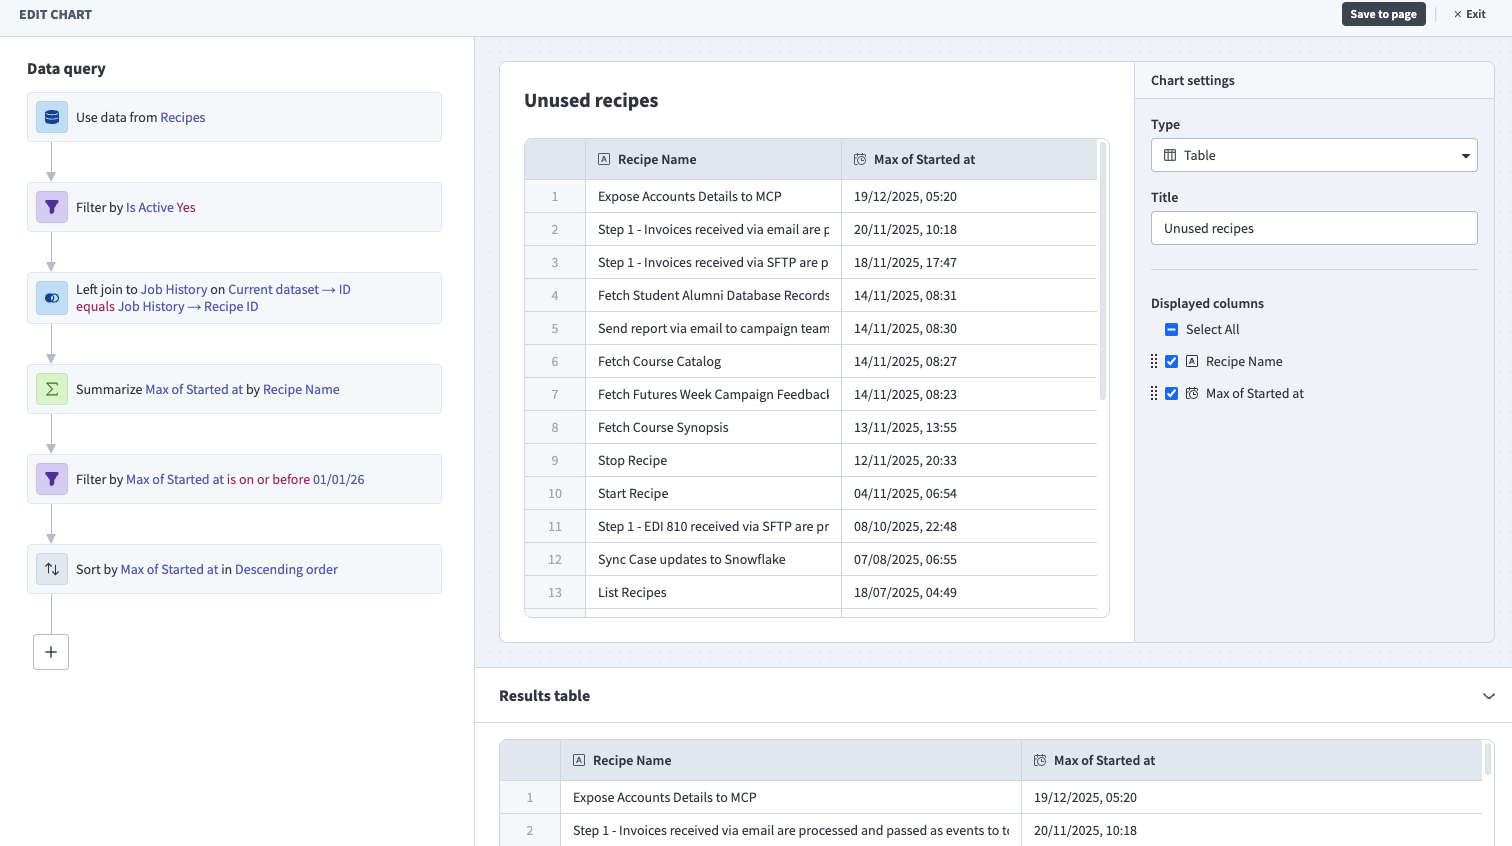 The query builder. This example returns unused recipes, or active recipes that didn't process any jobs since the start of the year.
The query builder has four main areas:
- Data query: Select a data source and build your query using steps, such as Filter, Summarize, Join, Sort, Row limit, and Calculated column. Refer to Query components for a full reference.
- Chart preview and settings: Displays a live preview of your chart and lets you configure how it appears. Options include:
- Chart type and chart data
- Chart title and axis labels
- Chart colors
- (For table widgets) Column order
- Results table: Shows the output of your query. Updates after each query step so you can verify your transformations as you build.
Click Save to save your chart. Click Exit to return to the dashboard editor.
SAVE AT DASHBOARD LEVEL
Saving a chart doesn't save the dashboard. After saving your chart, return to the dashboard editor and click Save to apply your changes.
Last updated: