Job debug tracing
Troubleshoot errors in 3 minutes using network tracing
Integration projects by its very nature are moderate to very complex involving multiple business systems. Connecting to and updating of records in cloud applications like Salesforce, Workday, NetSuite, Marketo is easy to do with an integration platform like Workato. With varied use cases like employee onboarding (HR) or quote to cash (sales ops), many business systems and cloud applications like Workday, Salesforce, and others will typically be part of the automation. This poses a challenge to developers and analysts who are building recipes but run in to errors like HTTP 404 Not Found. Having no further information makes it difficult to debug and troubleshoot.
Overview
The job debug tracing makes it easy to see detailed HTTP requests and responses for each action line. With details like HTTP URL, request, and response headers, request payload and the response, there's a lot of detailed information for the developer and analyst to uncover the root cause of the problem.
For each action line in the recipe, job debug tracing provides
- HTTP URL to which the request was made
- HTTP request headers
- HTTP response headers
- HTTP request payload
- HTTP response
Job debug tracing is available for certain users. Reach out to your Customer Success Manager to learn more.
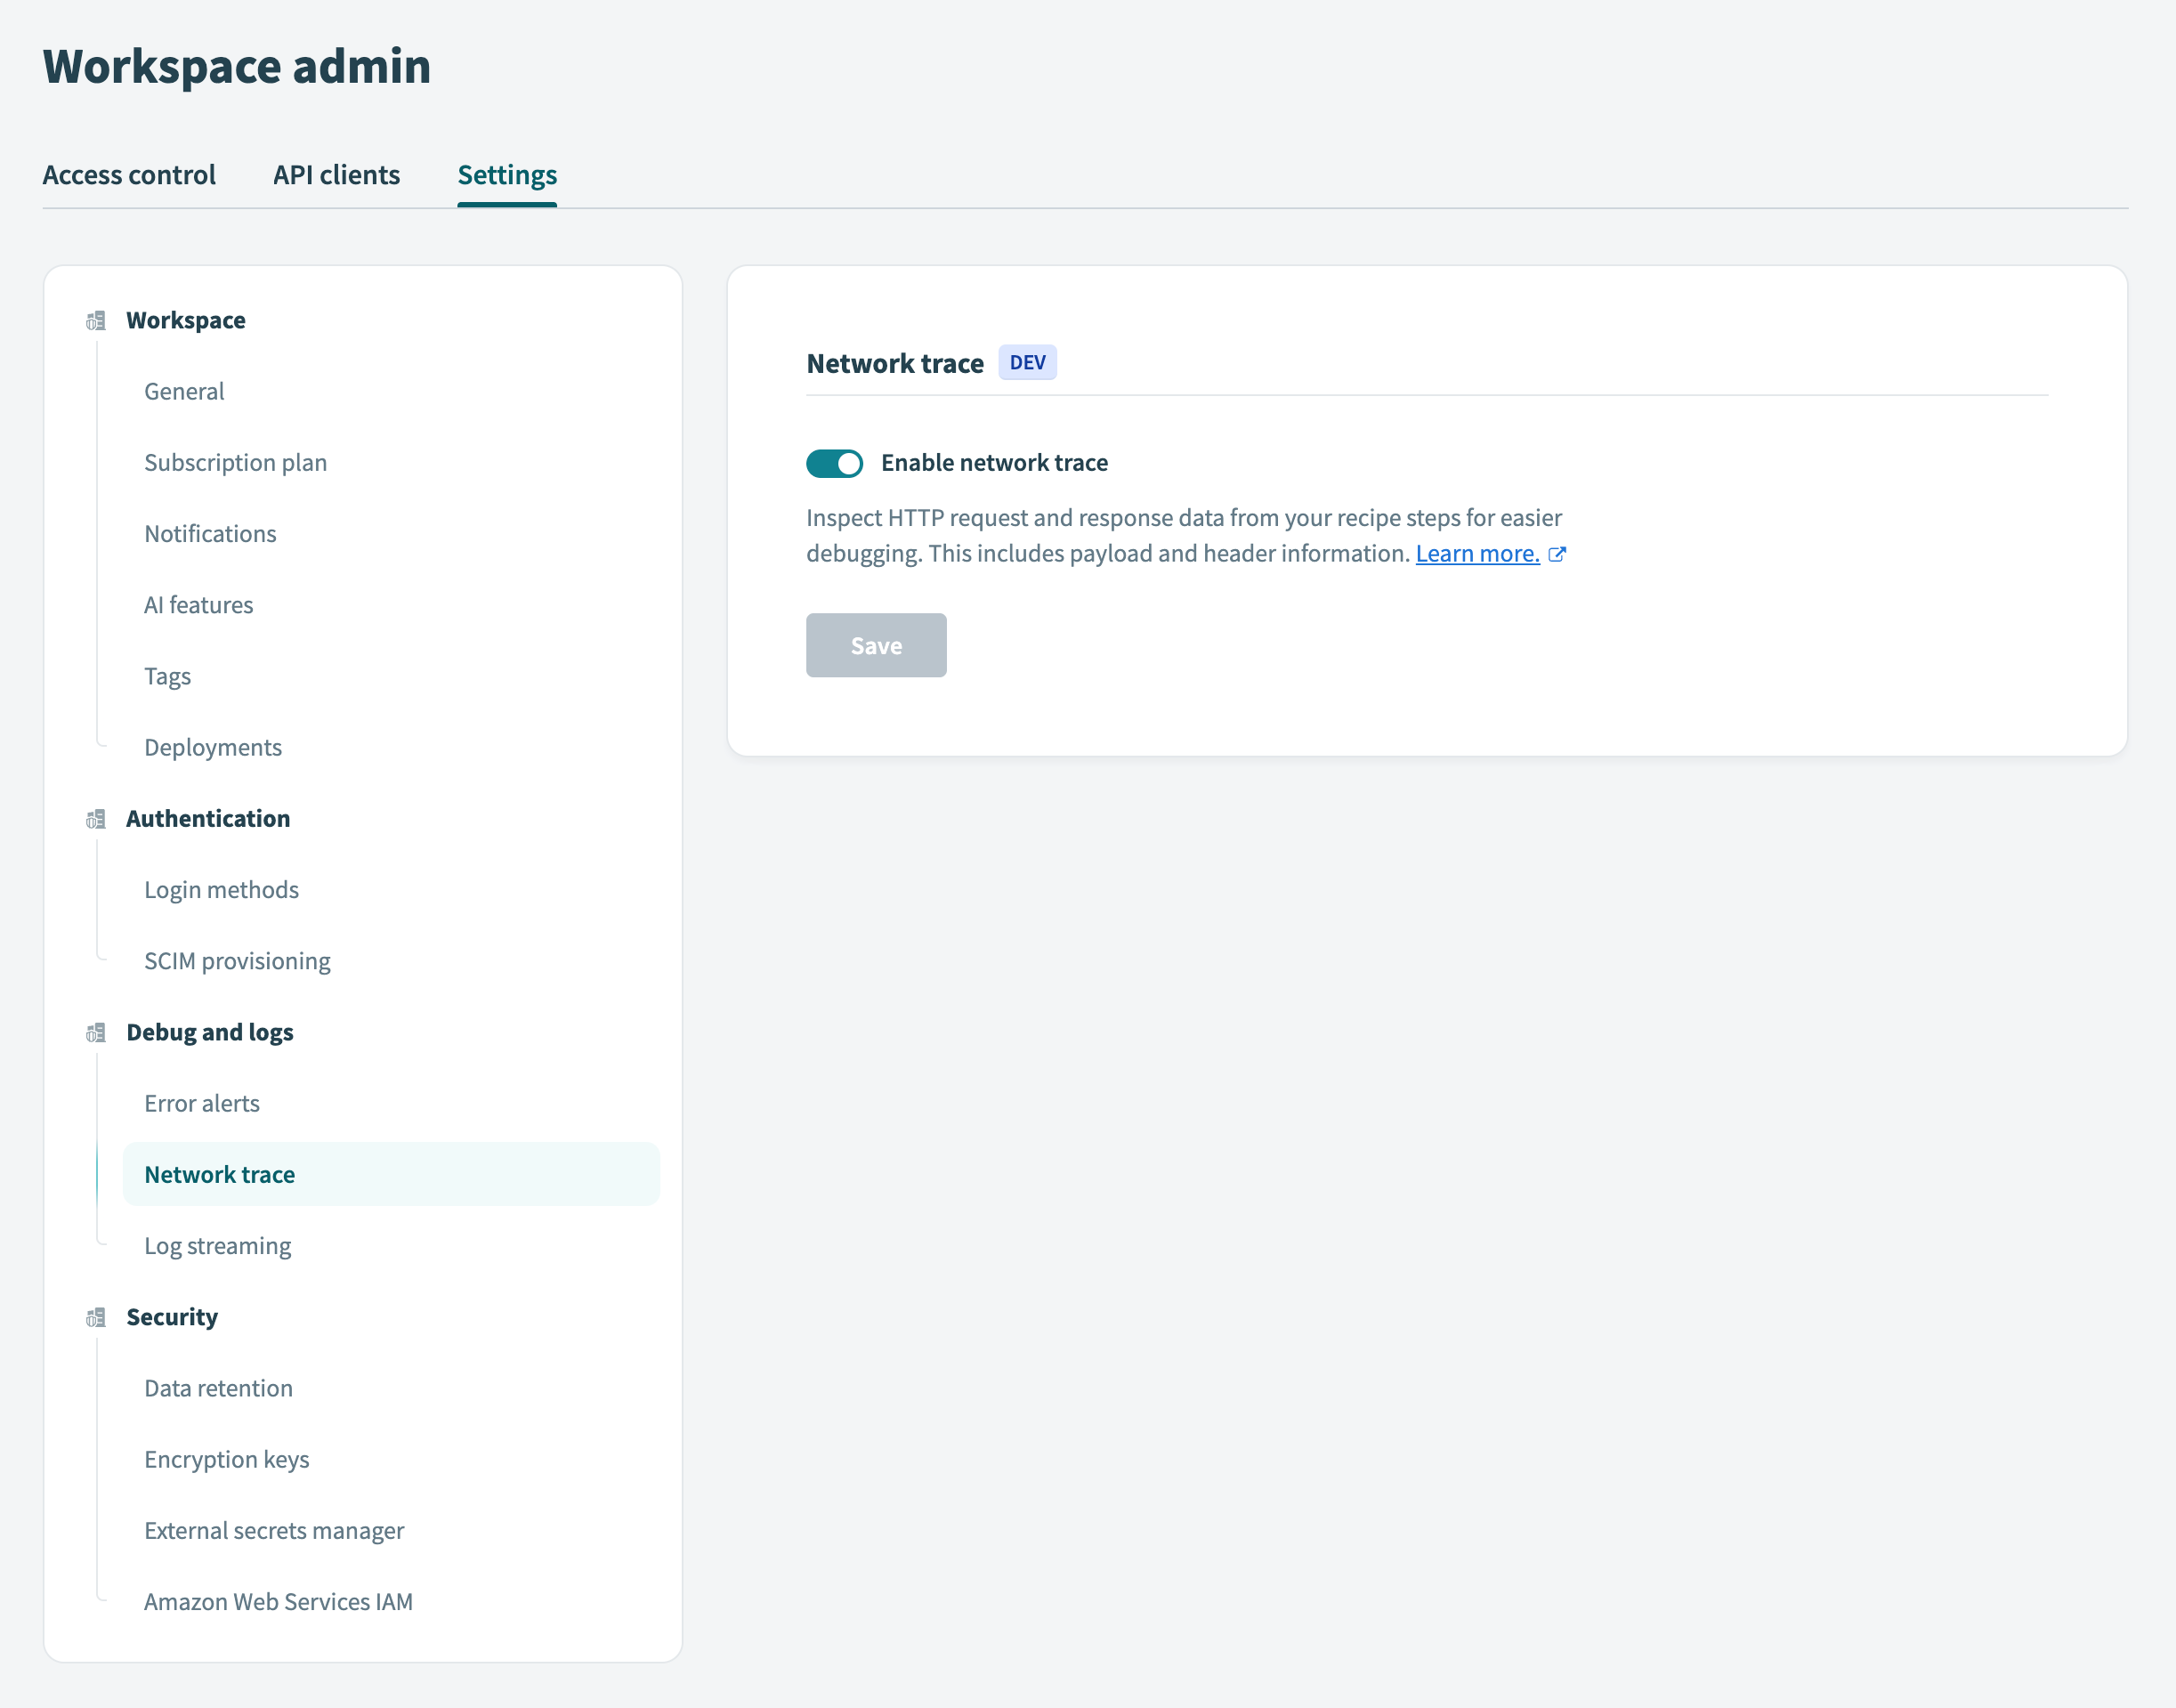
Enable and disable job debug tracing
To enable or disable job debug tracing:
Go to Workspace admin > Settings > Network trace.
Click the Enable network trace toggle.
Click Save.
 Enable or disable job debug tracing
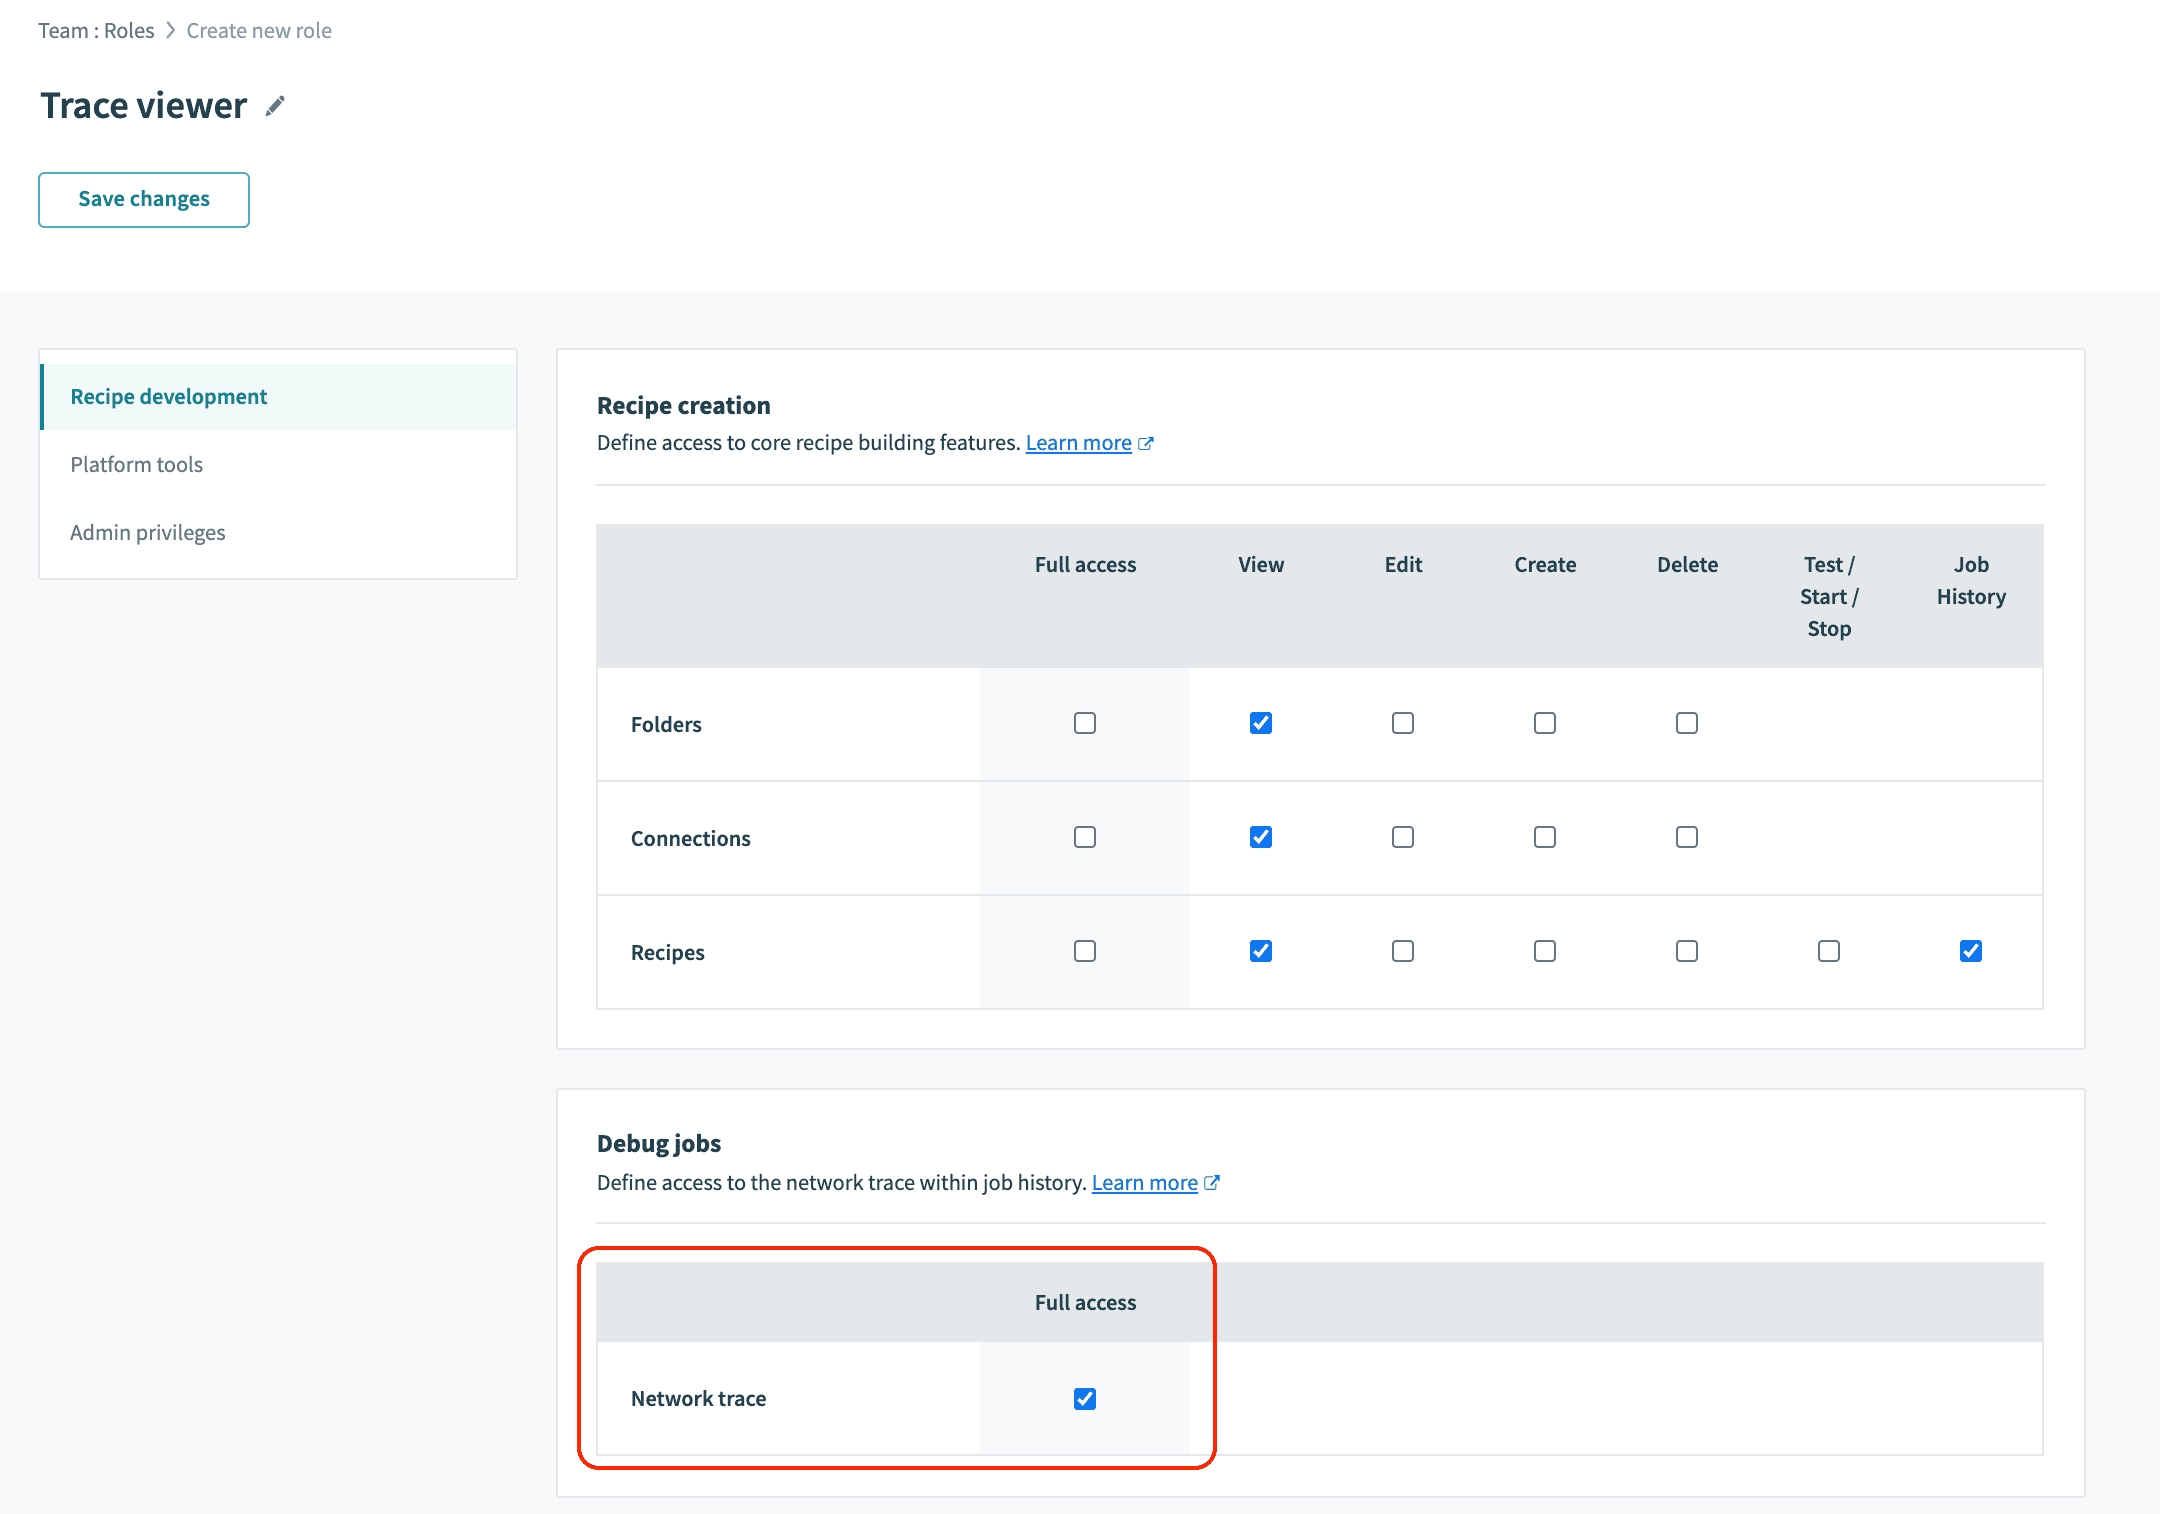
Debug tracing privilege
By default, the debug tracing privilege is available to users with Admin role or users who are owner of the Workato account.
You may also assign the Debug Trace privilege by creating a custom role. After you have created the custom role, you can assign it to any developer or analyst in the team. Make sure to Save the assignment of the privilege to the custom role.
 Assign network trace privilege
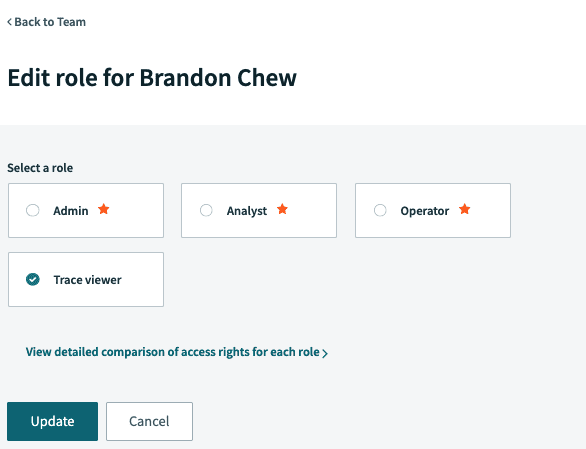 Assign the custom role to a user
Sensitive data
We know data security is very important to our customers. We also understand you need controls so that sensitive data is only visible to authorized users. That's why we have created two layers of control to give you maximum flexibility.
- First, you can completely turn off debug tracing at the account level so no user can view debug trace. See Enable and disable job debug tracing for more details.
- Second, you can control which user has the privilege to see the debug trace data. See Debug tracing privilege for more details.
Viewing job debug tracing
Debug or network tracing is available when:
A test job is run while in the recipe edit mode. You can view the network tracing during development when the recipe is tested in the TEST JOBS interface.
A job is repeated. Jobs that are completed, whether successfully or failed, can be repeated to view the network tracing.
Test recipe
Network tracing gives you the tools to make recipes more robust by detecting and avoiding errors early on. During development you can test the recipe by going to the TEST JOBS tab and clicking the Test button. Testing a recipe validates the functionality and implementation of the recipe. The test job provides the network tracing in the Debug tab.
Developers can view not only the input and output but also the network trace of the HTTP calls made for the action. You can review and validate the information in HTTP headers, request, and response flowing between the recipe action and the end application.
Example action HTTP requests
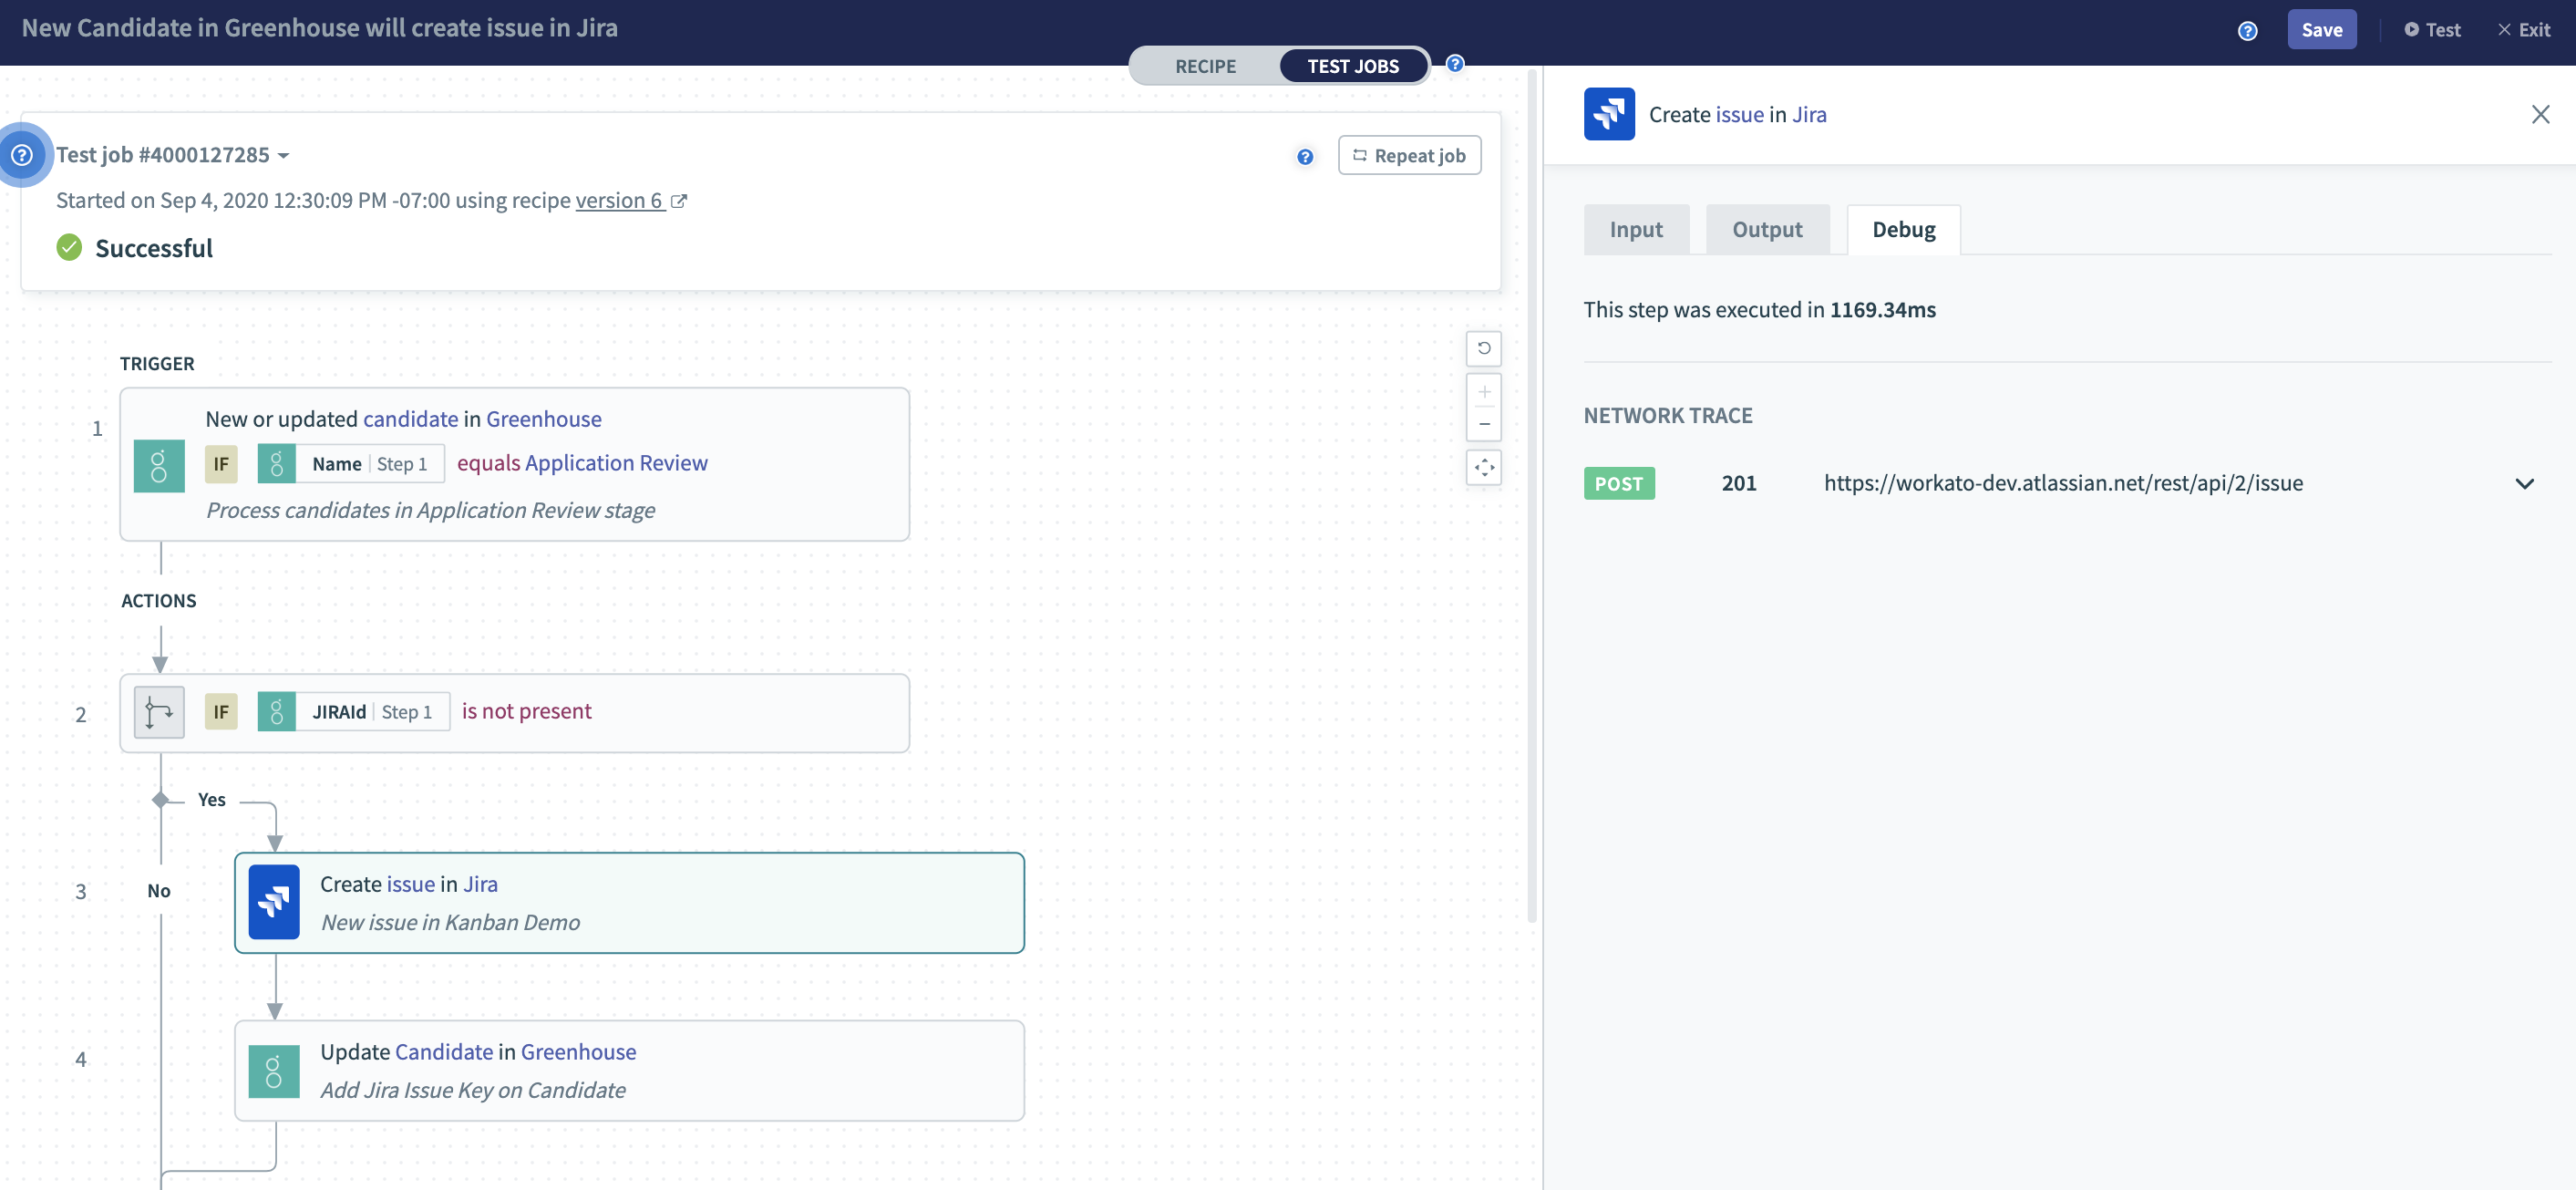 Test job - network tracing for an action to create a new Jira issue
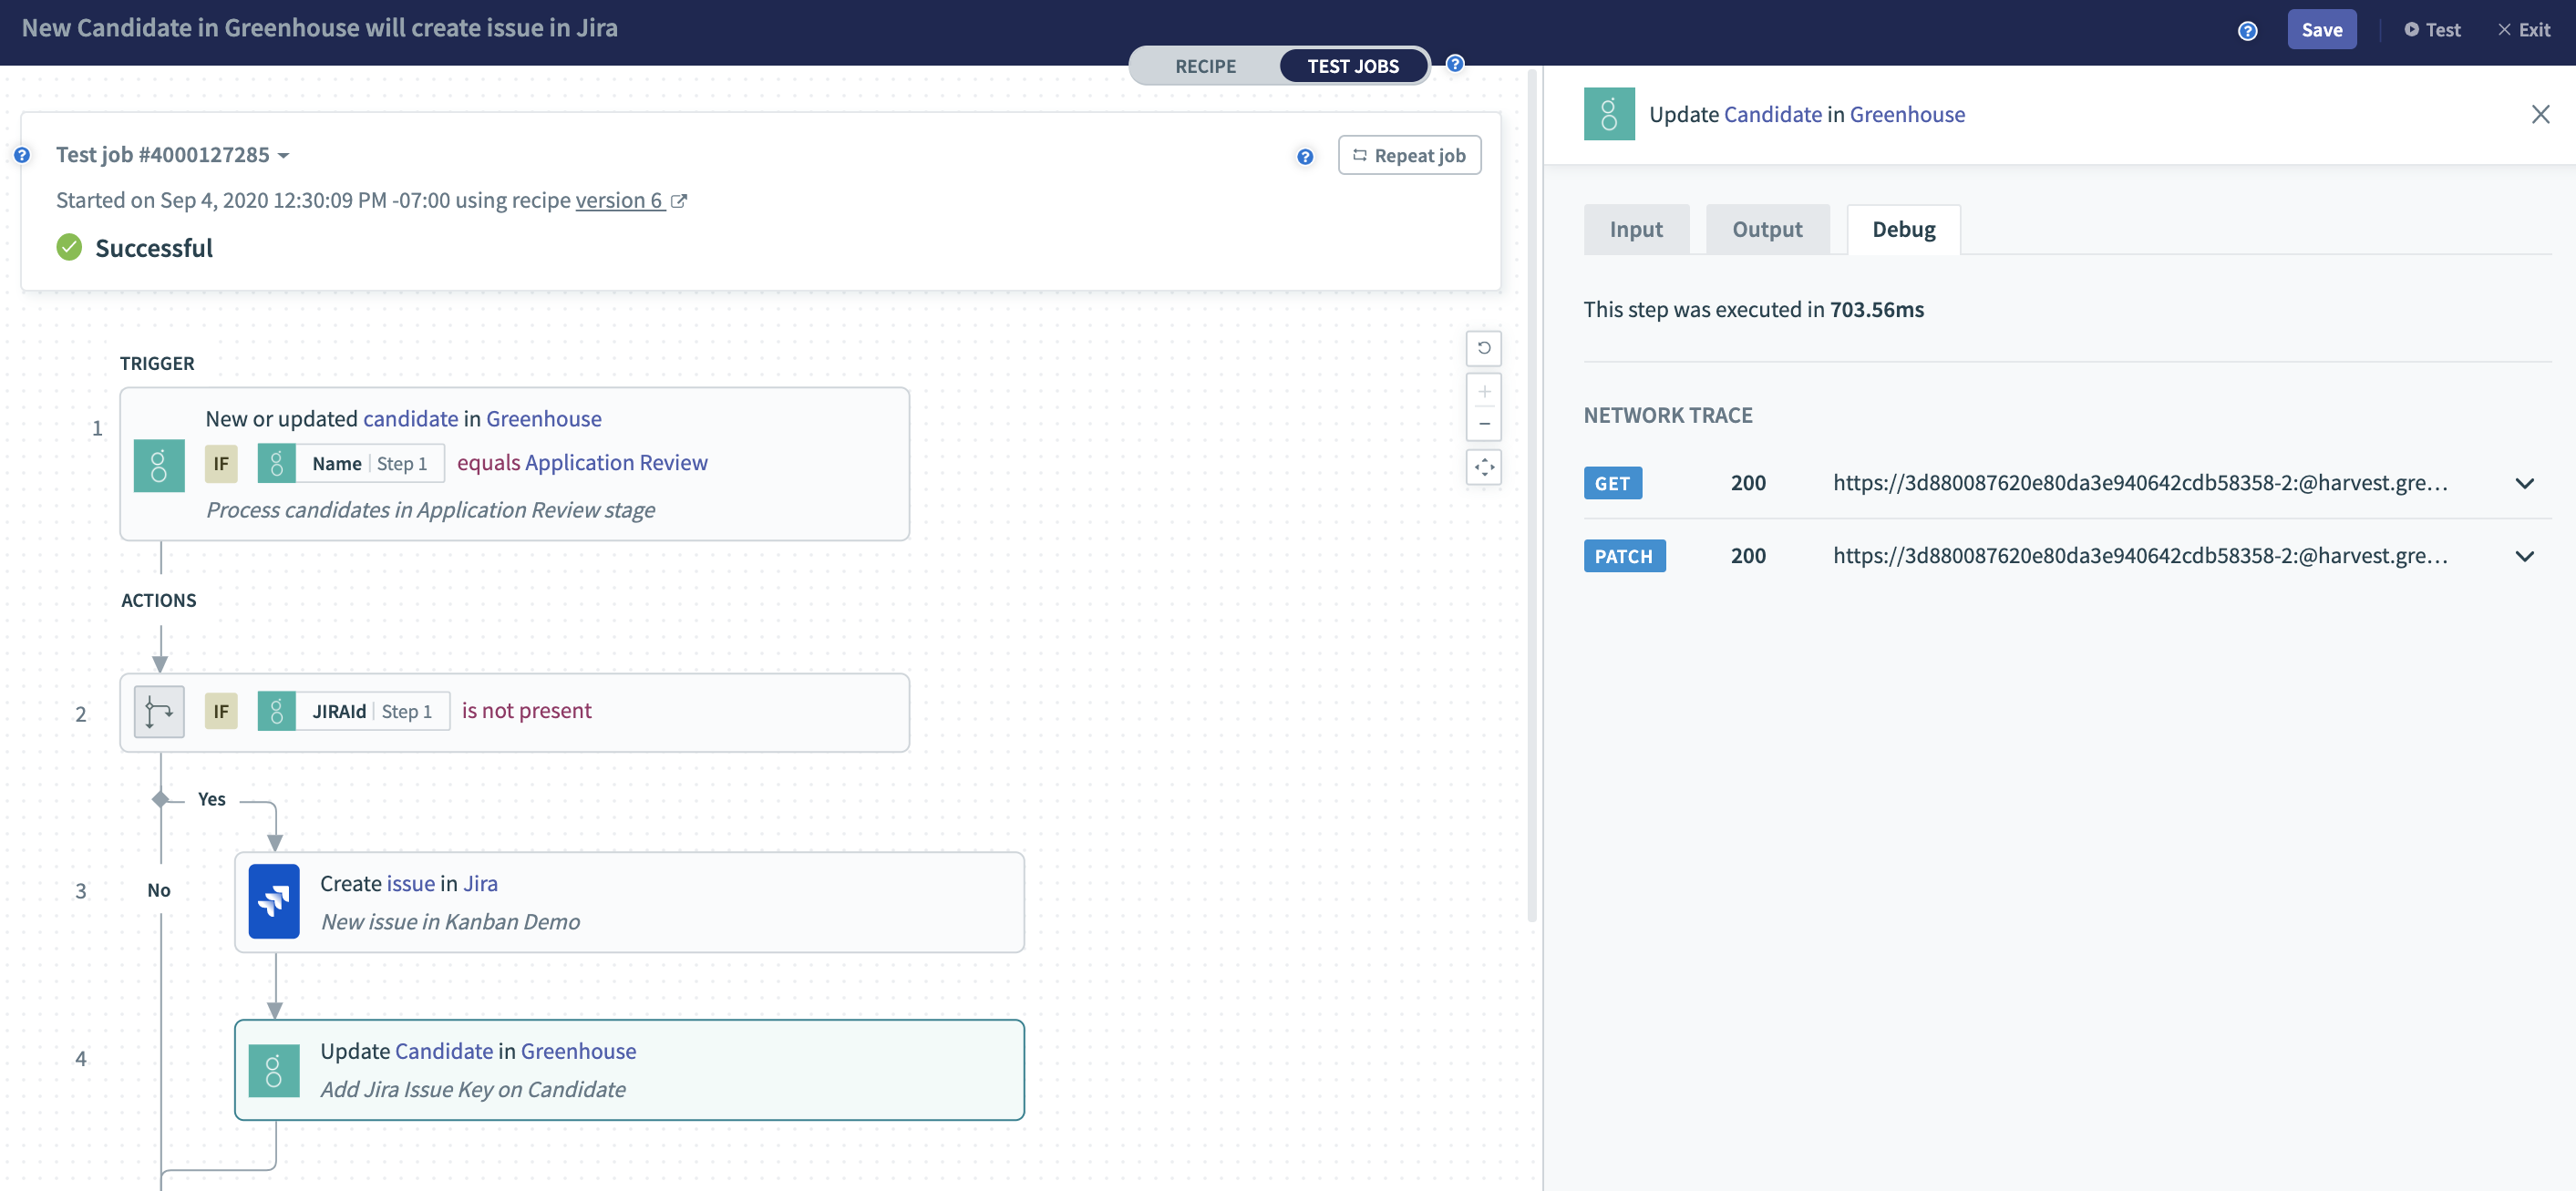 Test job - network tracing for an action to update a candidate in Greenhouse
You can view the HTTP network tracing including headers, request, and the response from the API calls made to the application when the action is executed. The screenshots show the headers, request, and response sent and received in the HTTP request.
Successful action with HTTP request details
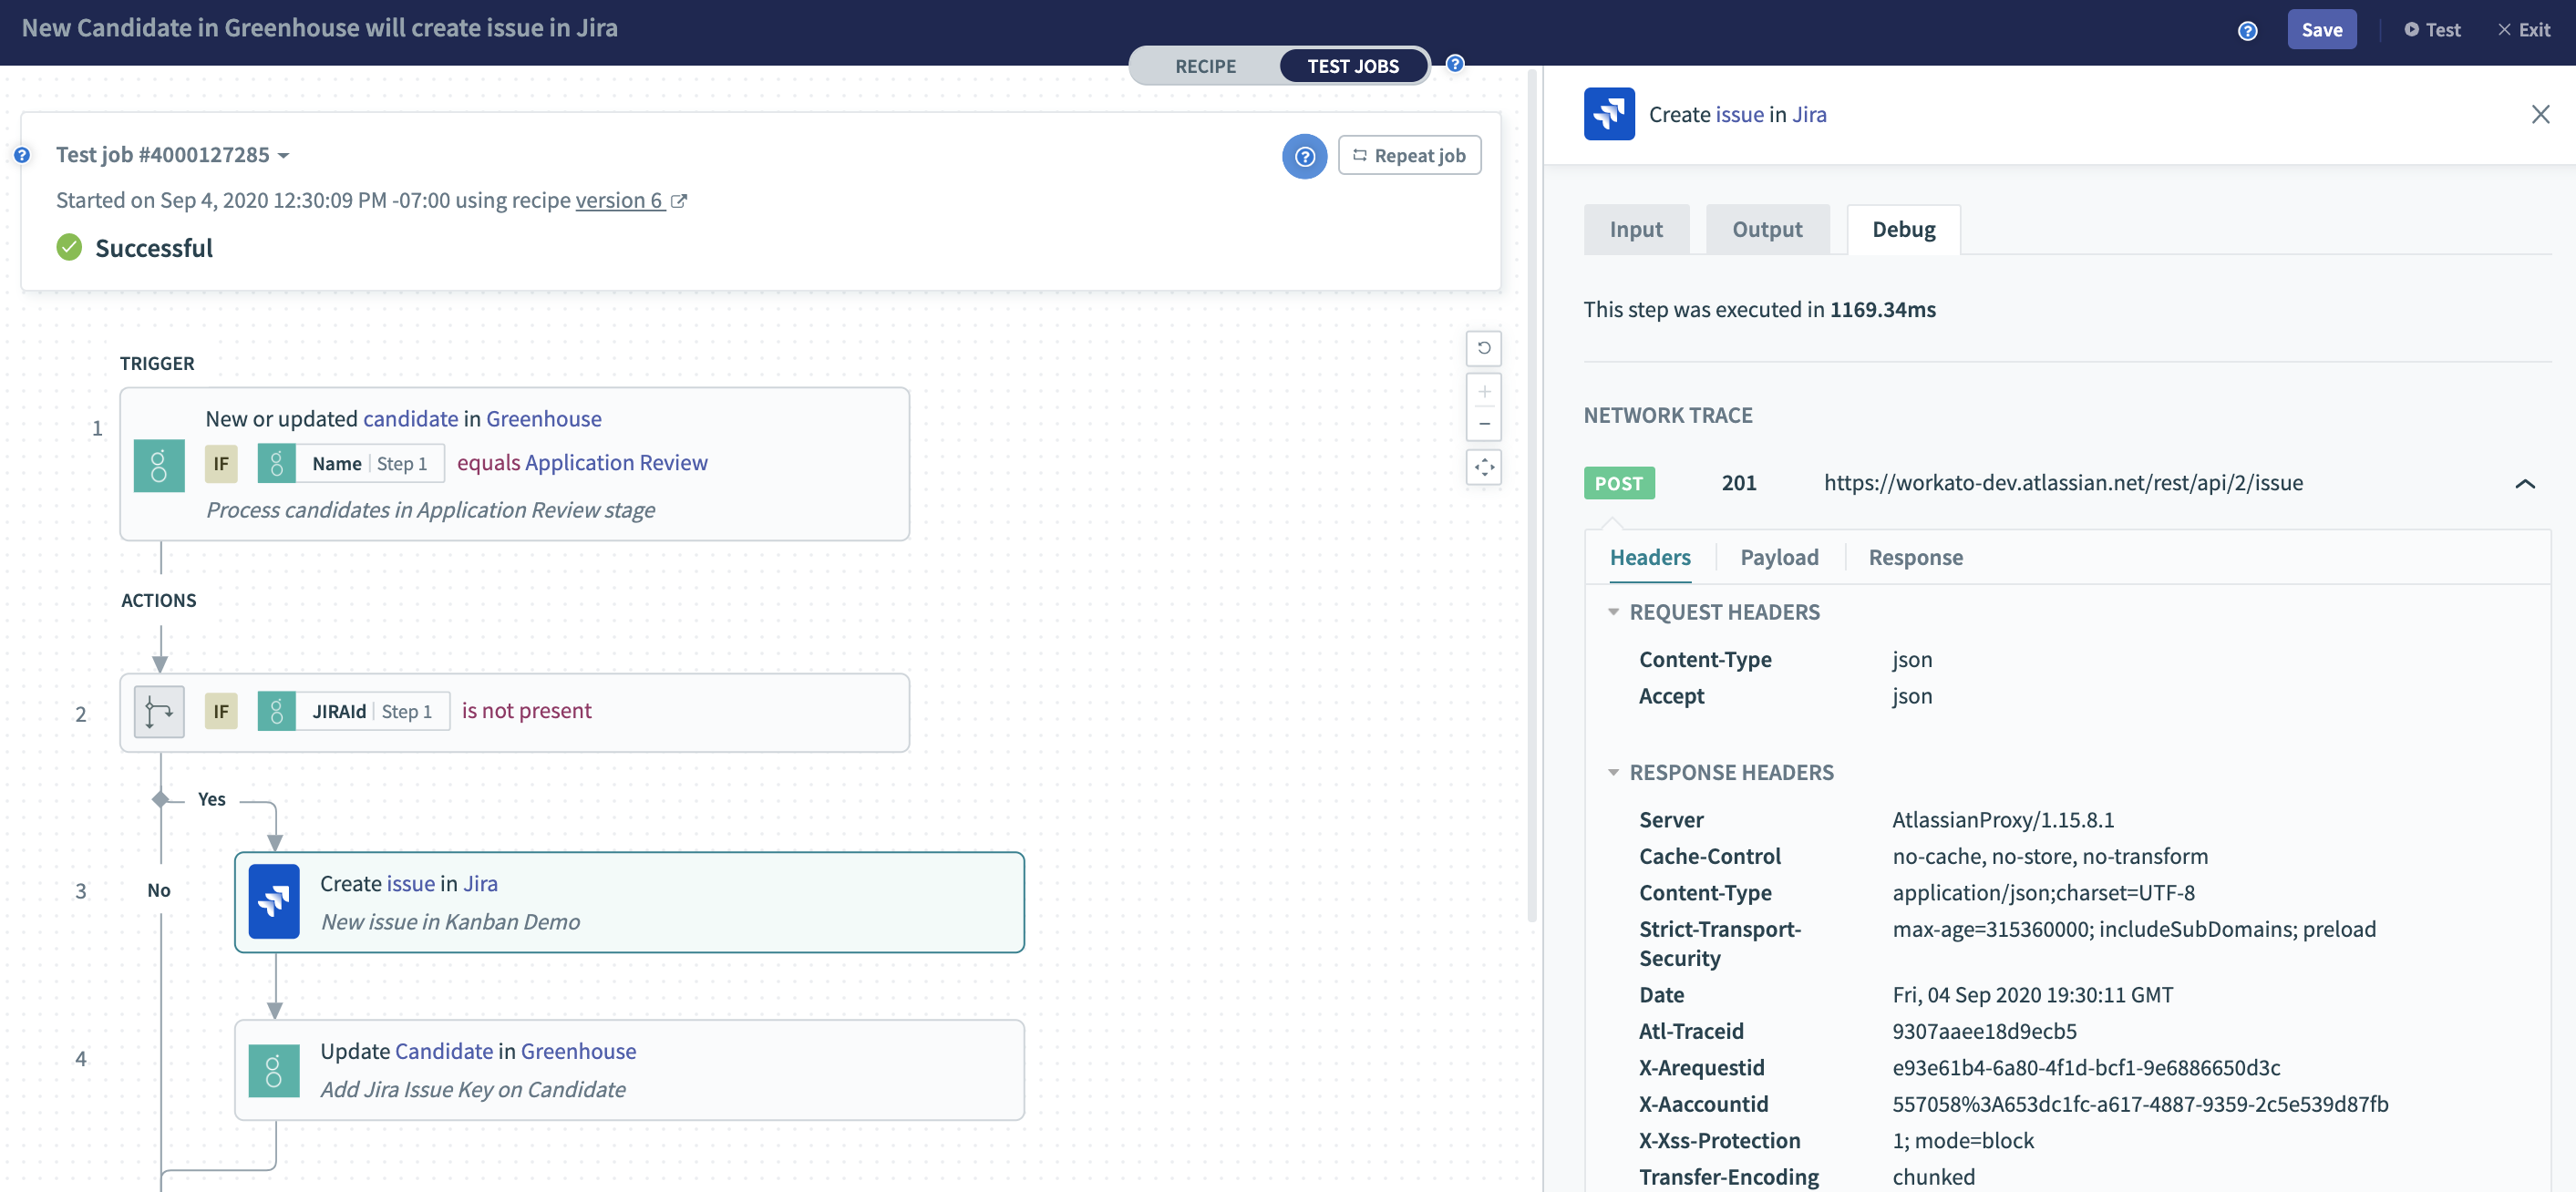 Test job - HTTP headers sent to the application API
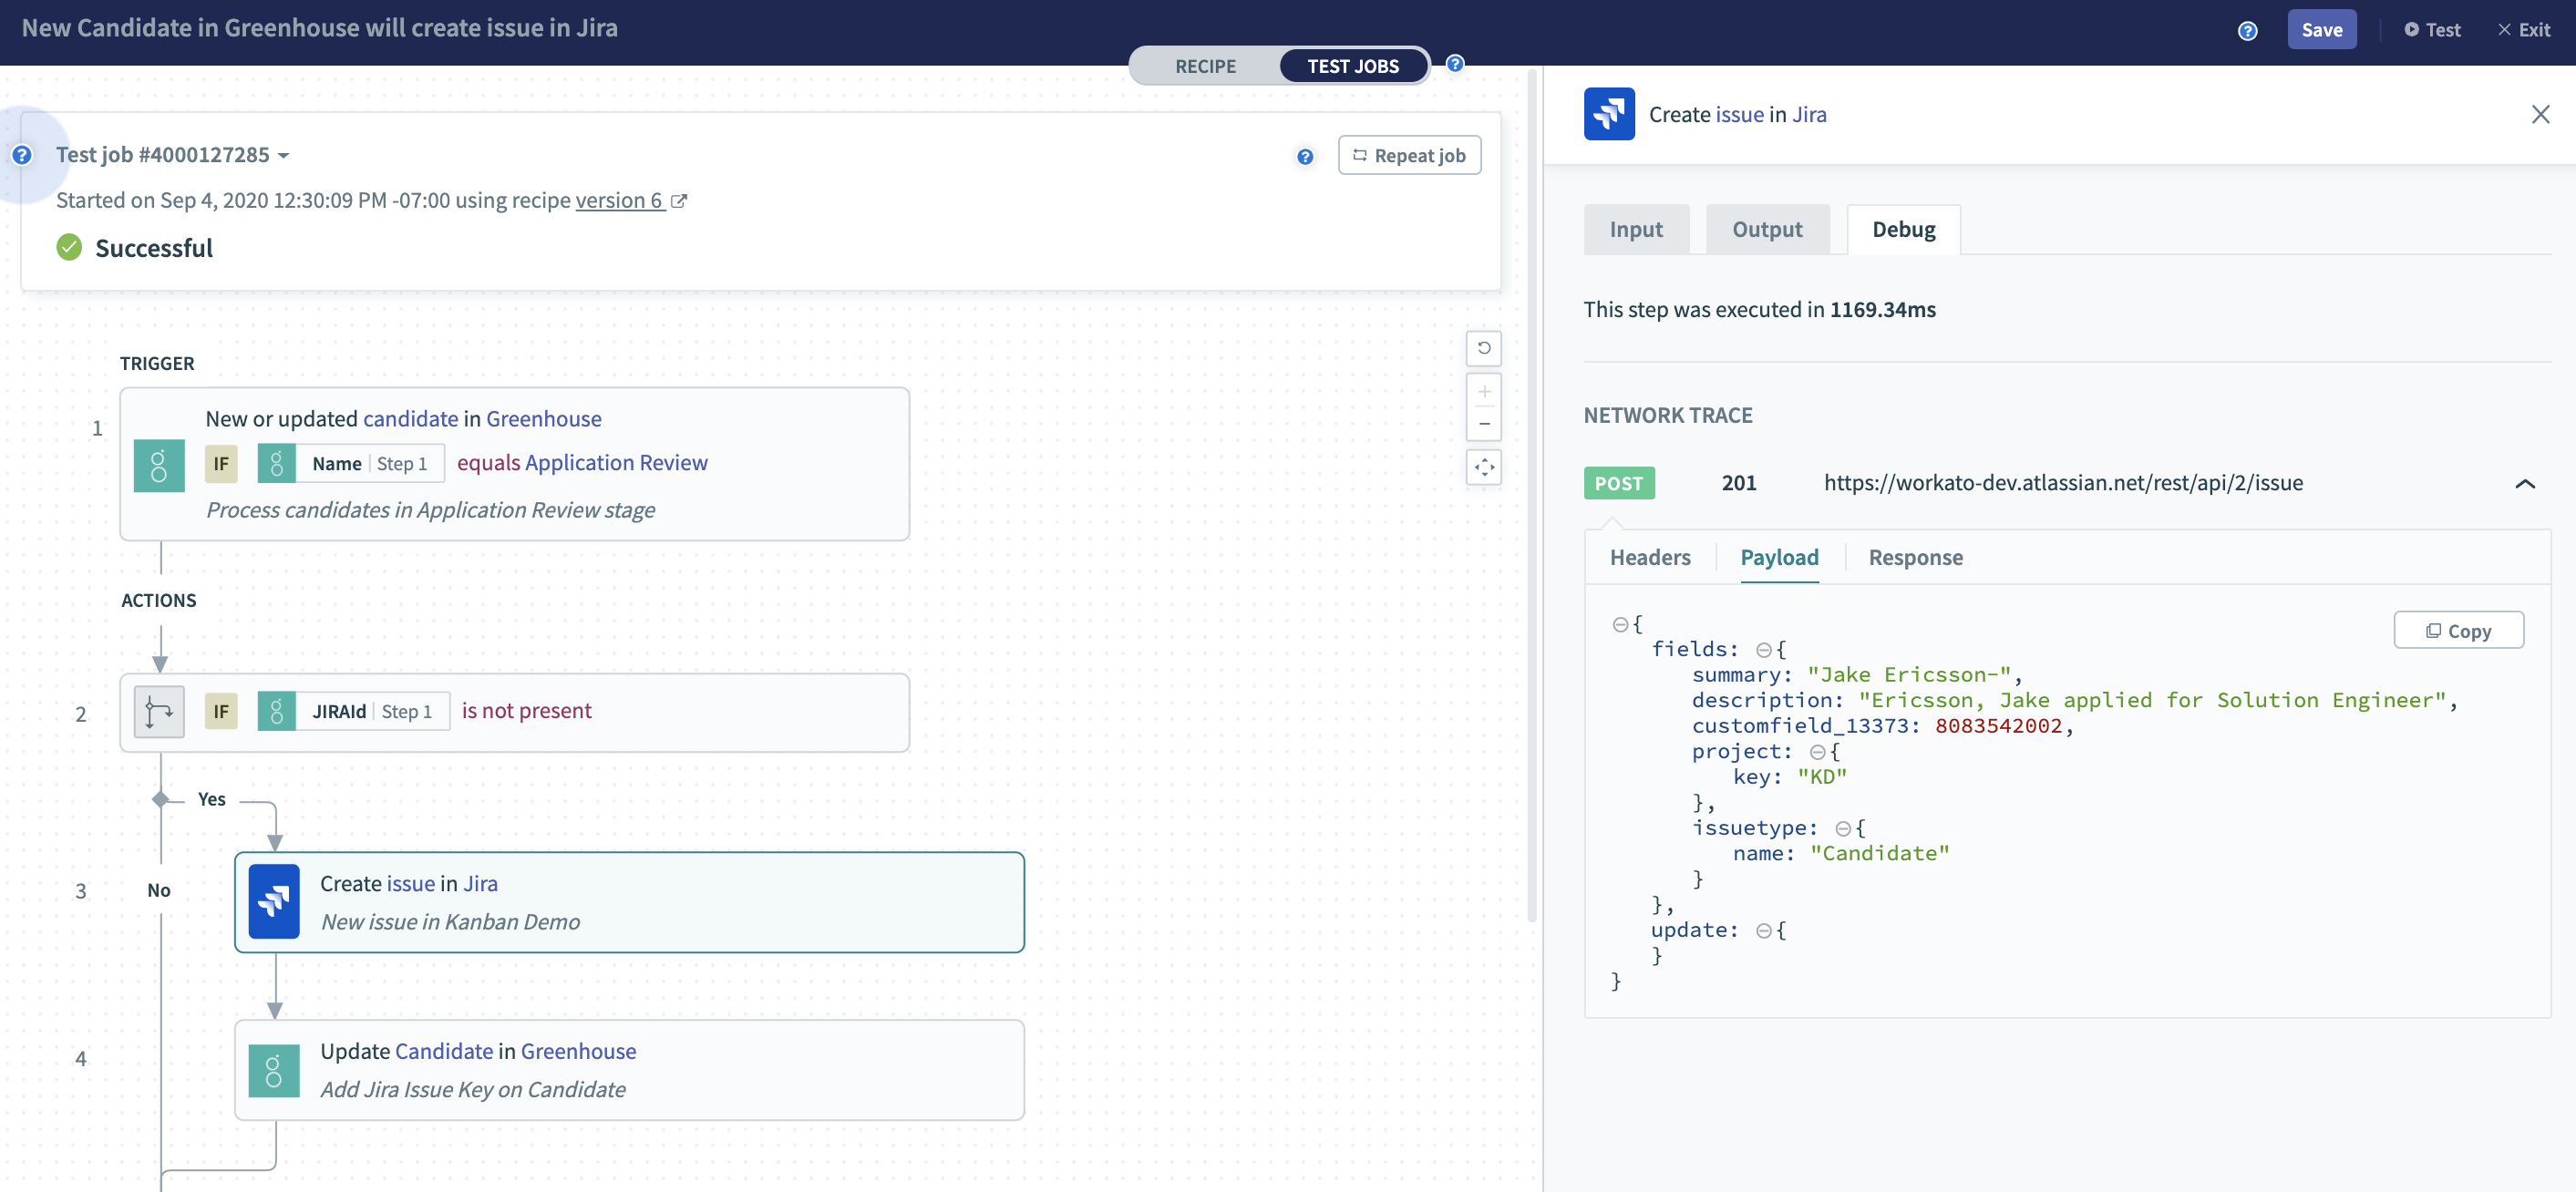 Test job - HTTP request payload sent to the application API
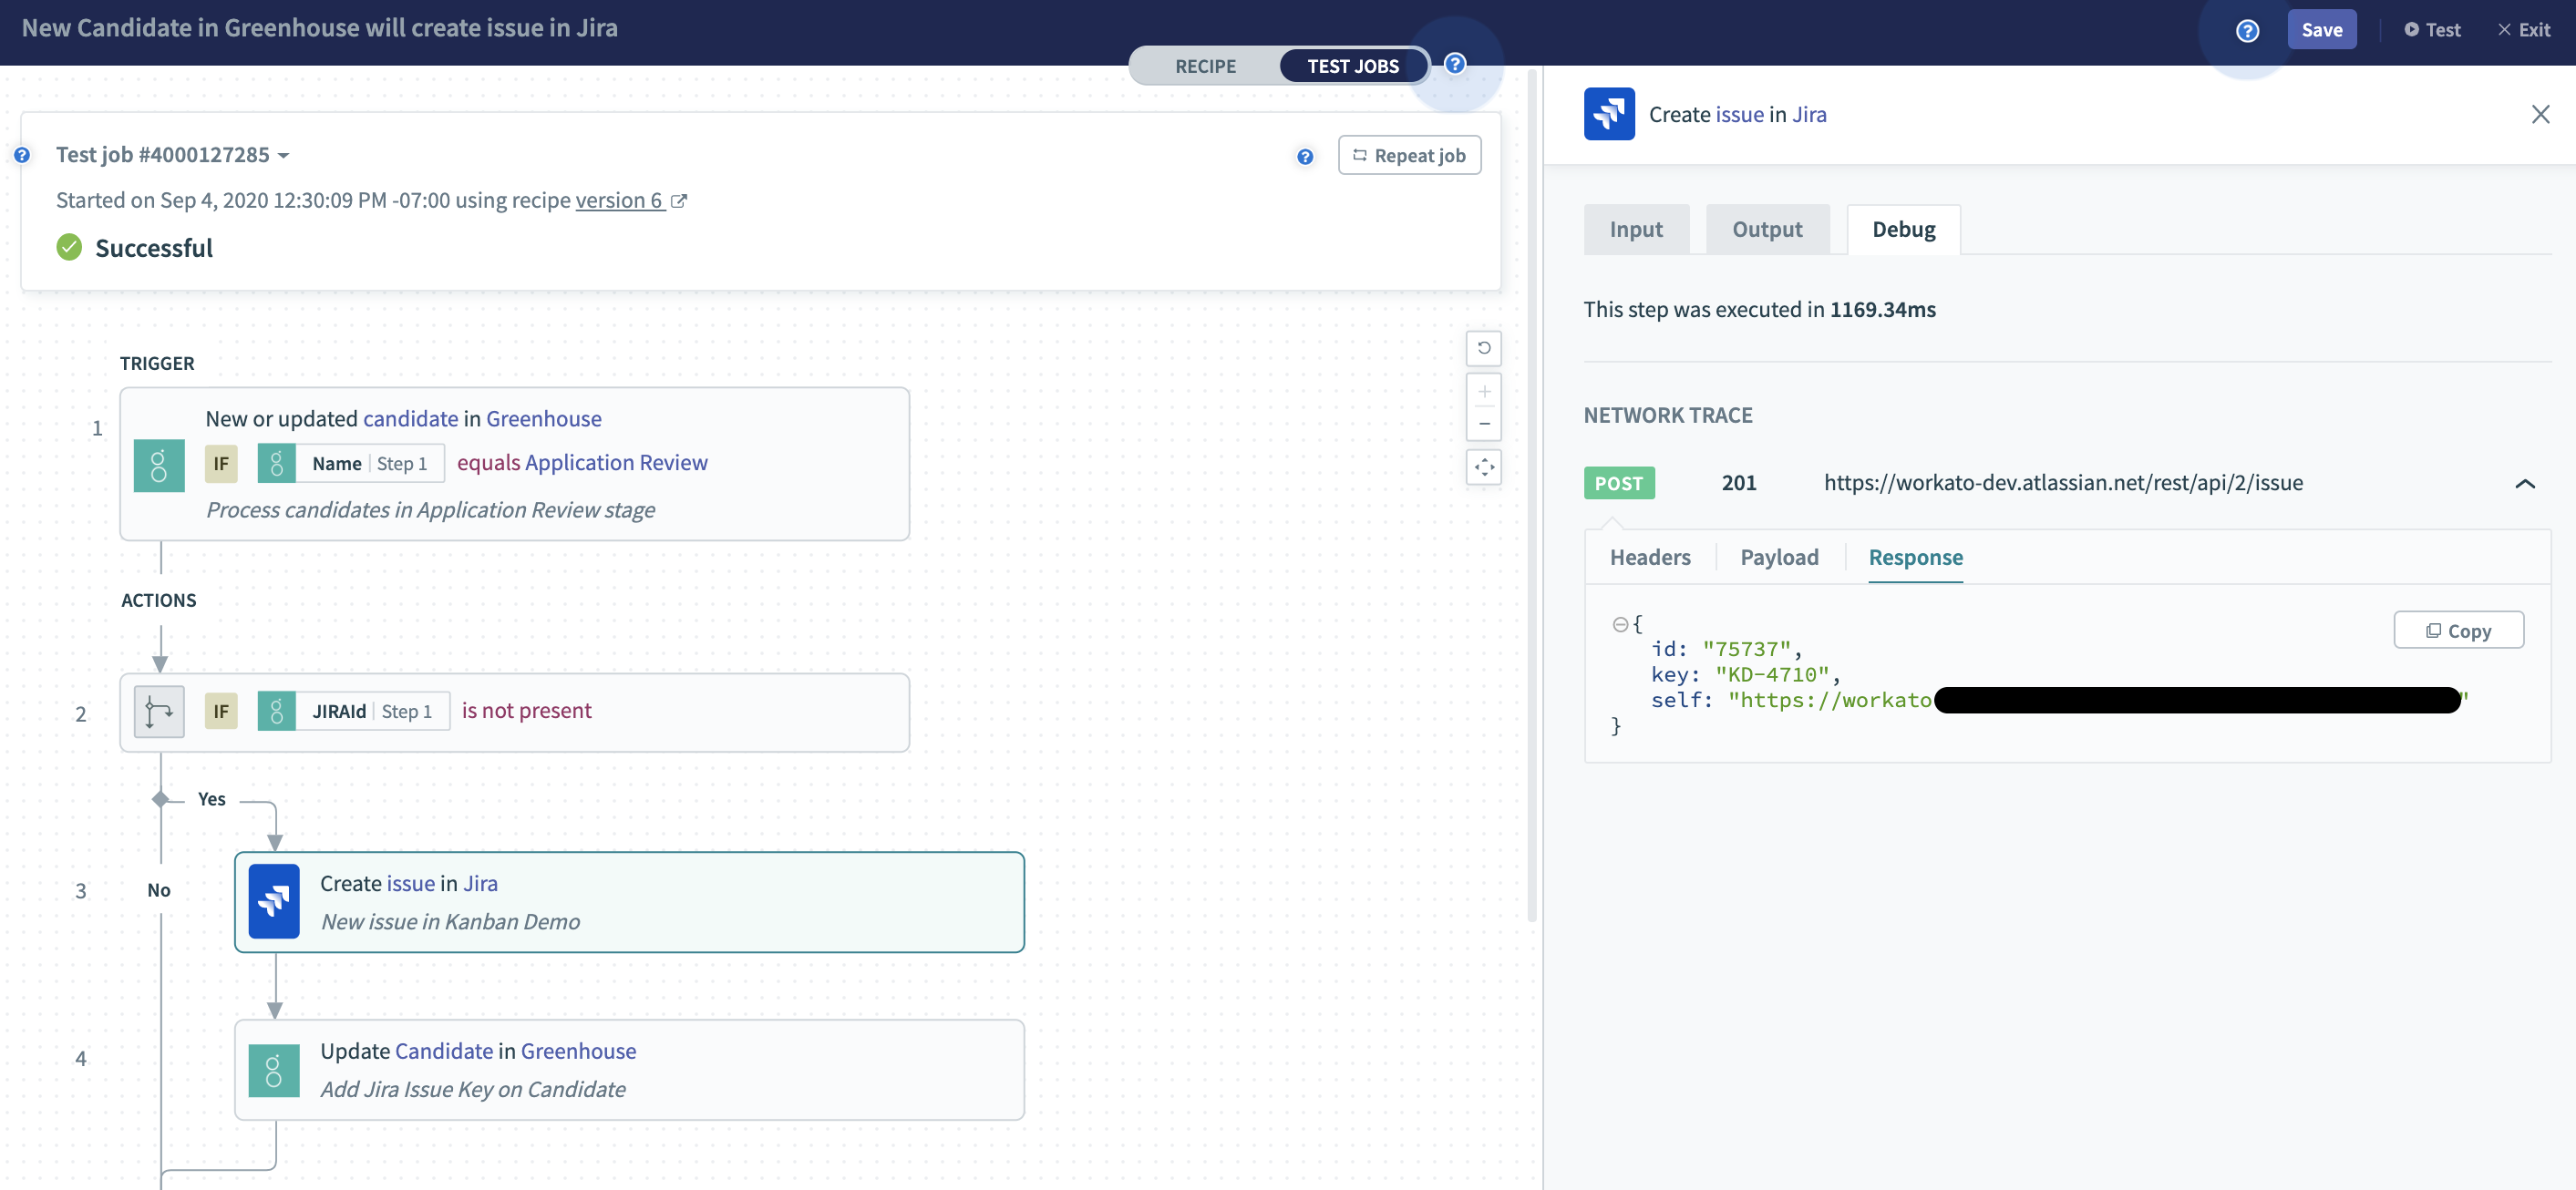 Test job - HTTP response received from the application API
Action failed with HTTP error
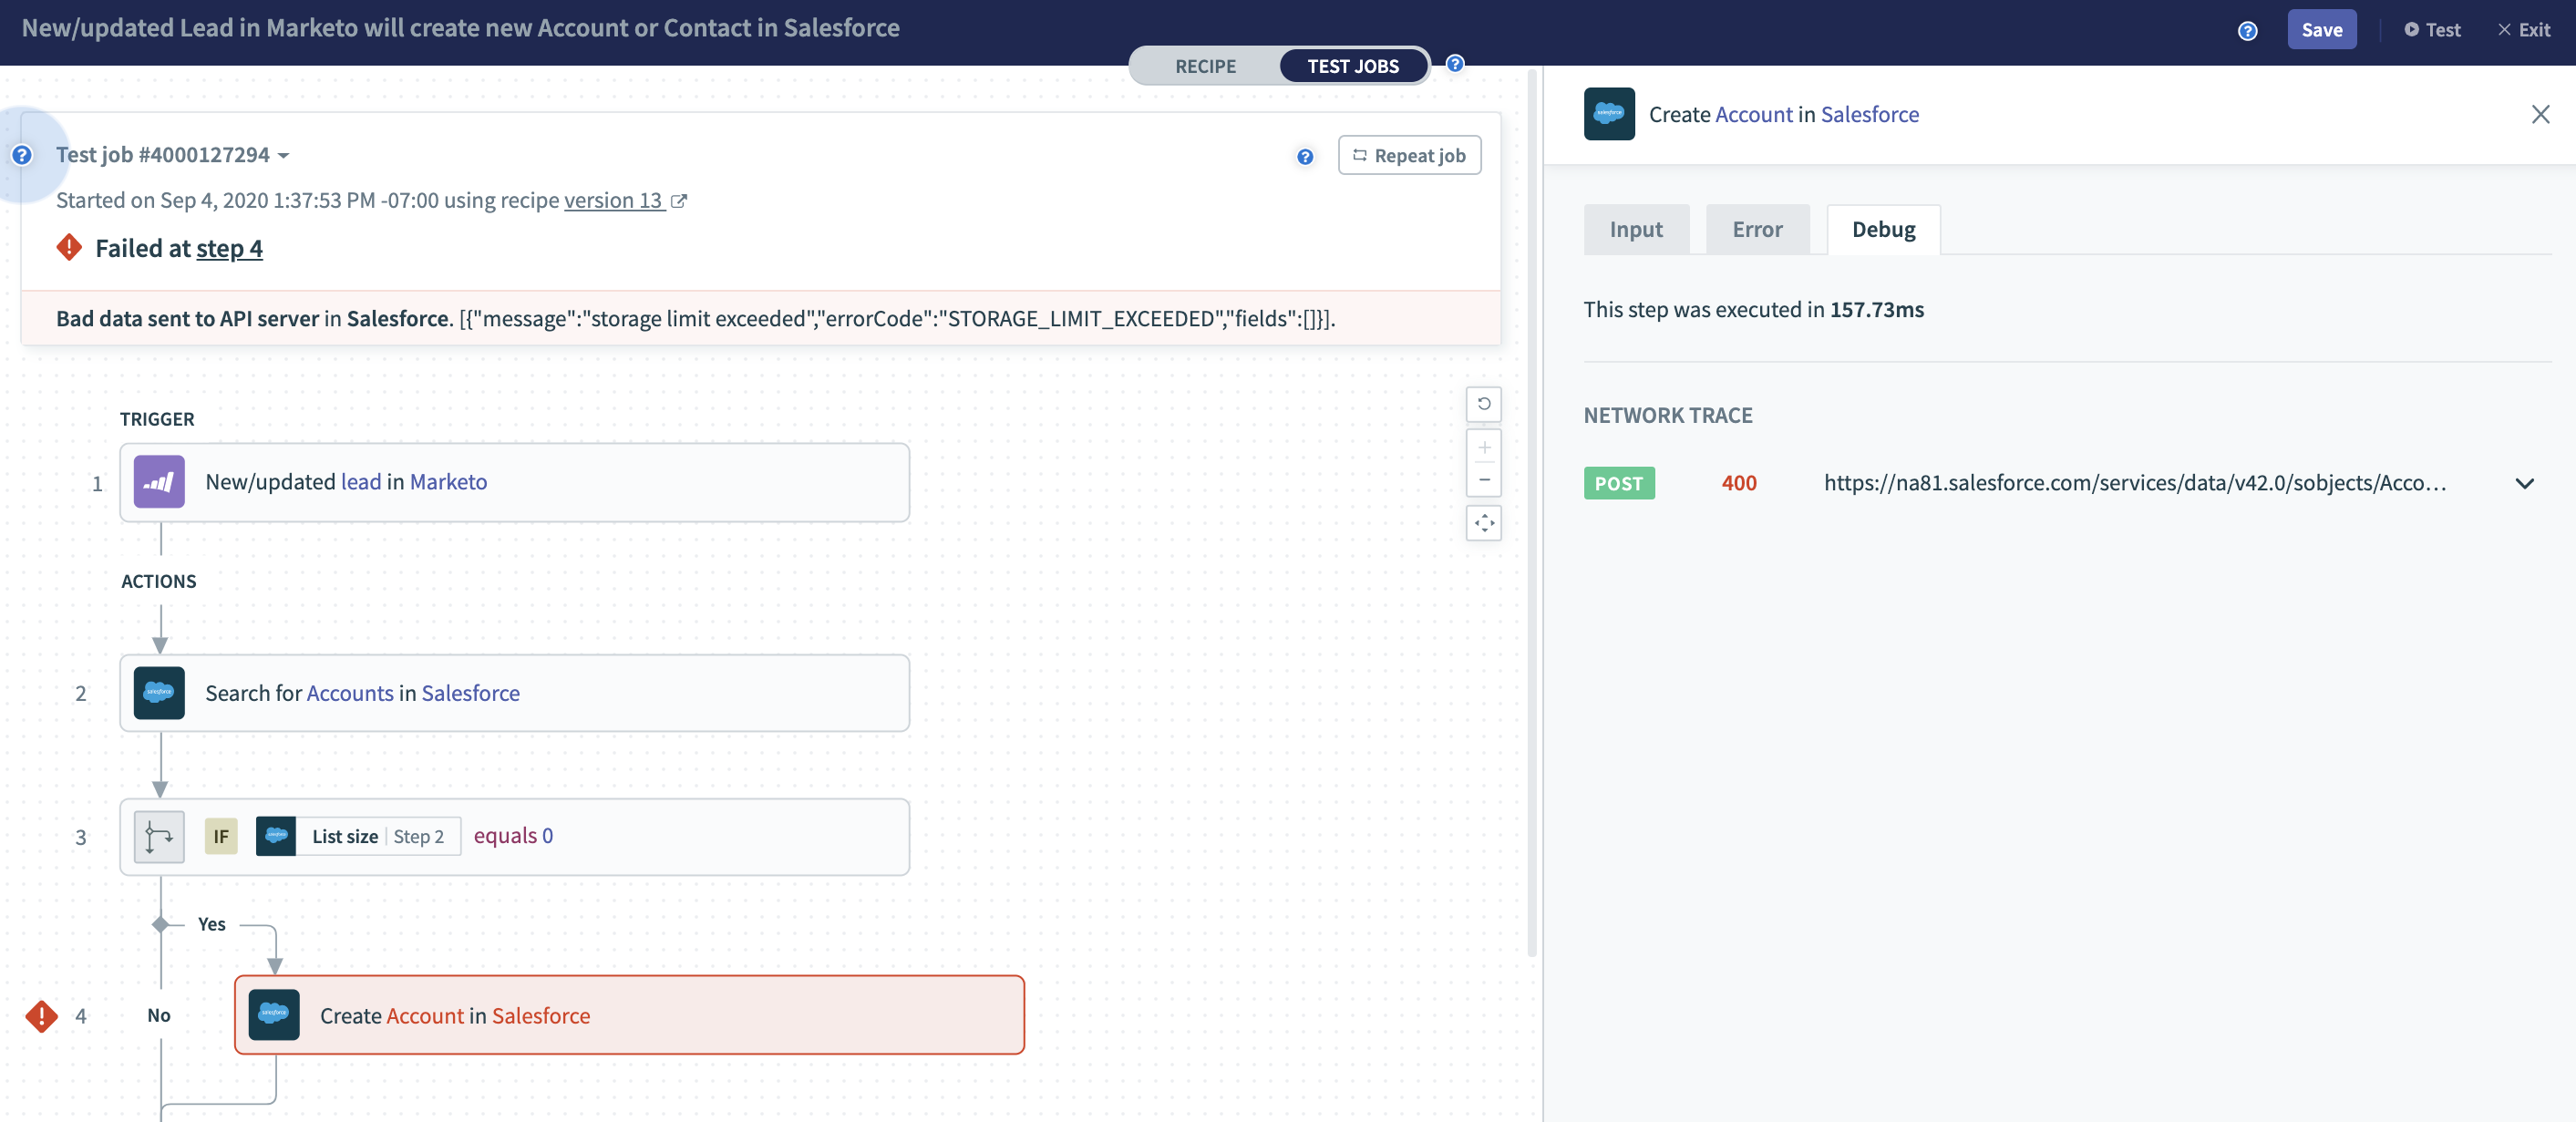 Test job - Failed HTTP request with HTTP 400 error code
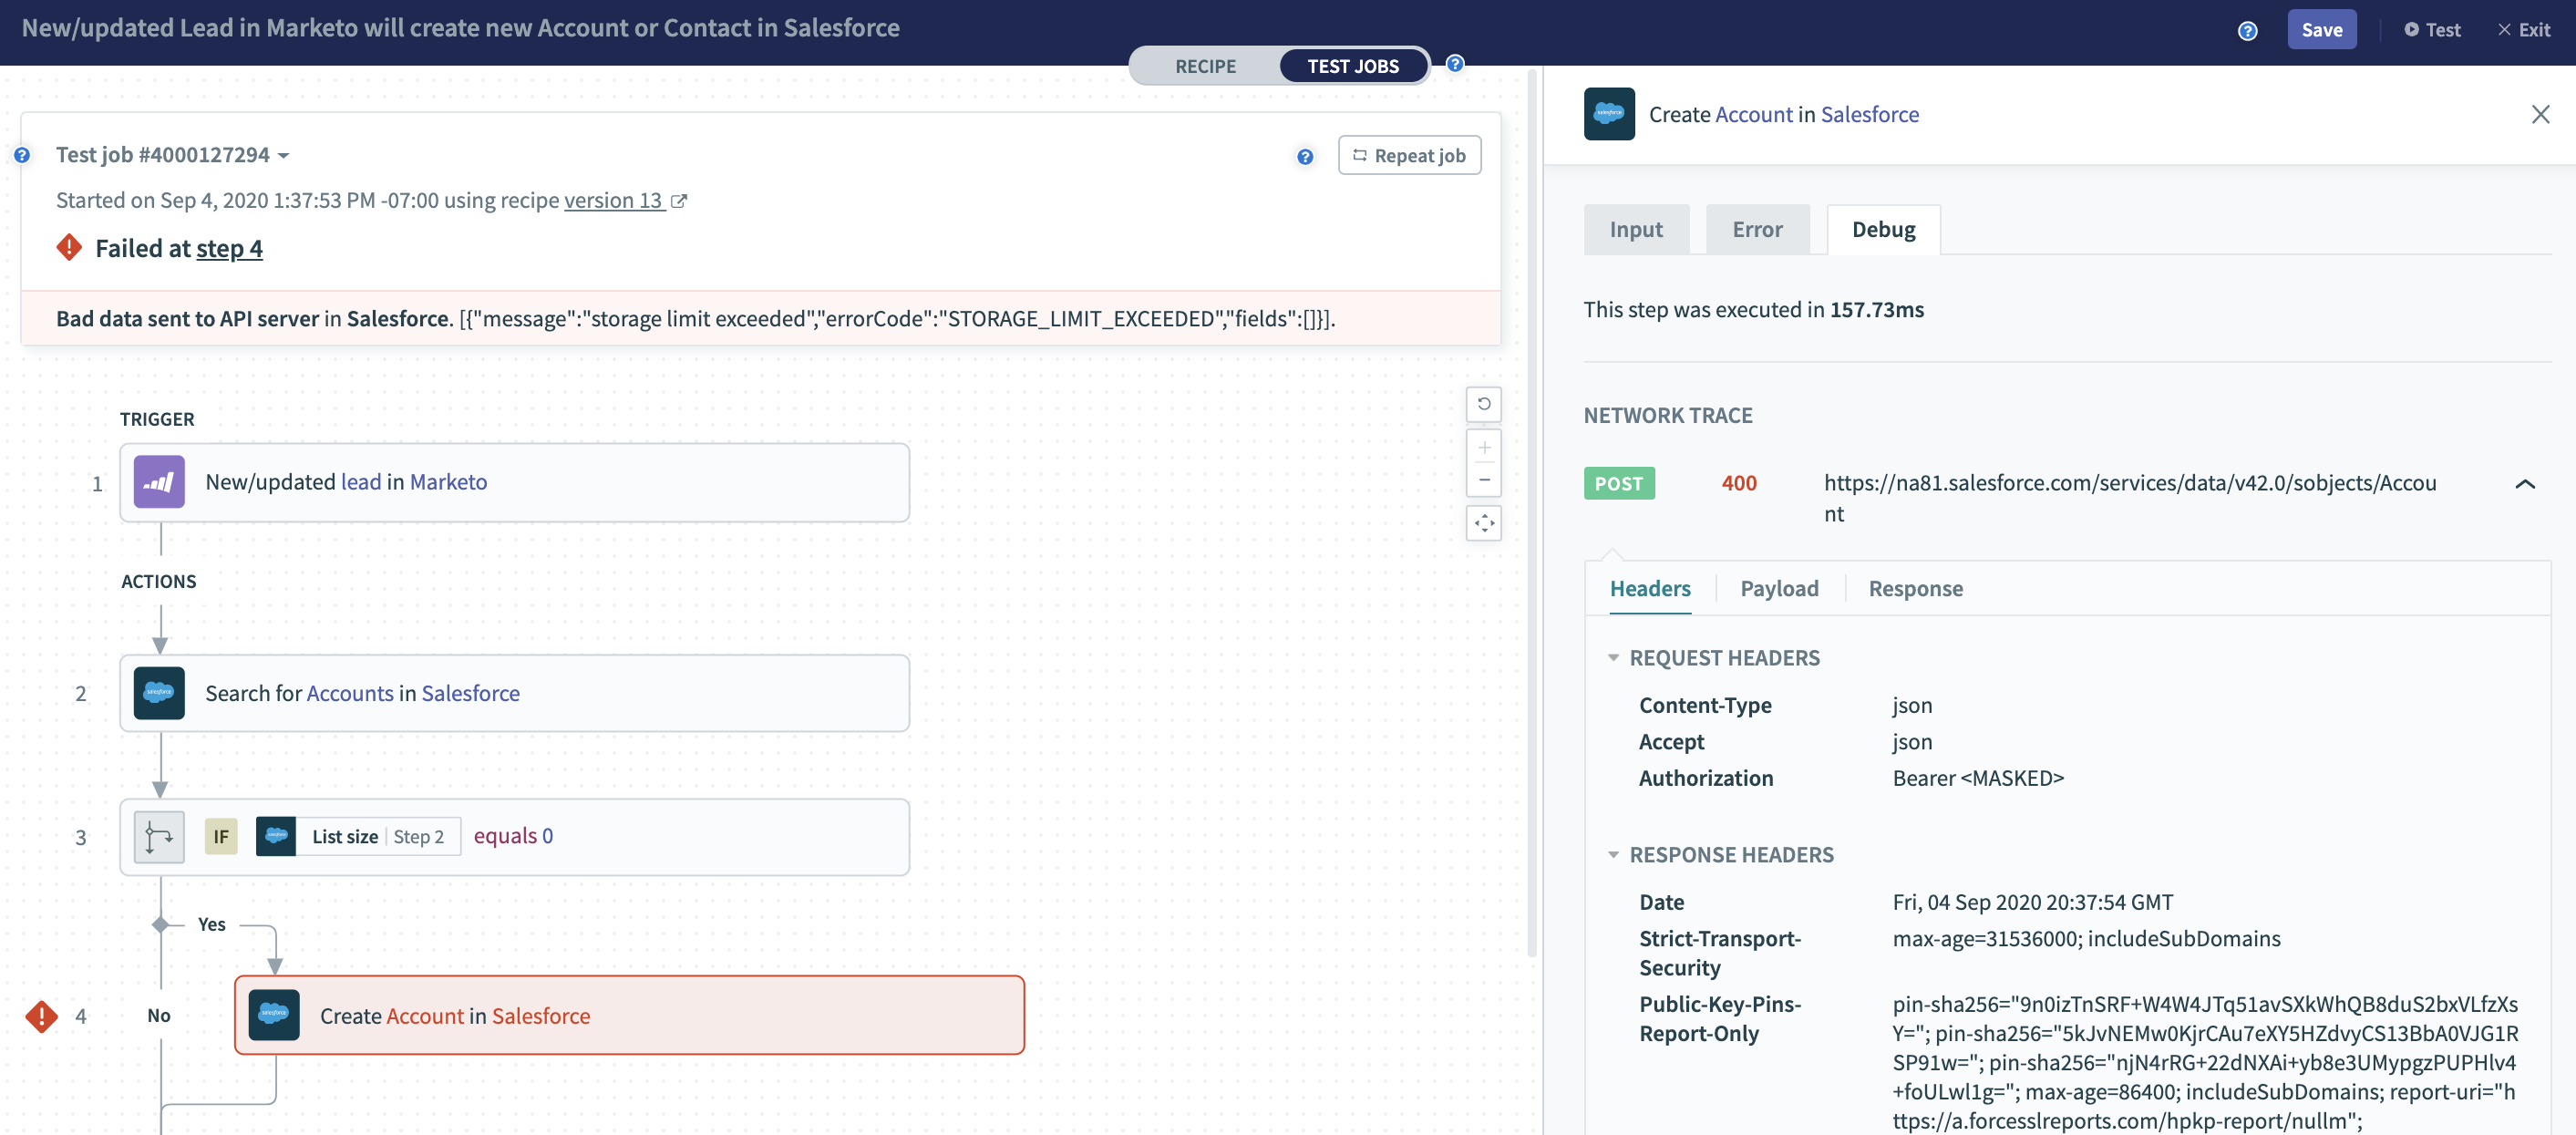 Test job - HTTP headers sent to the application API
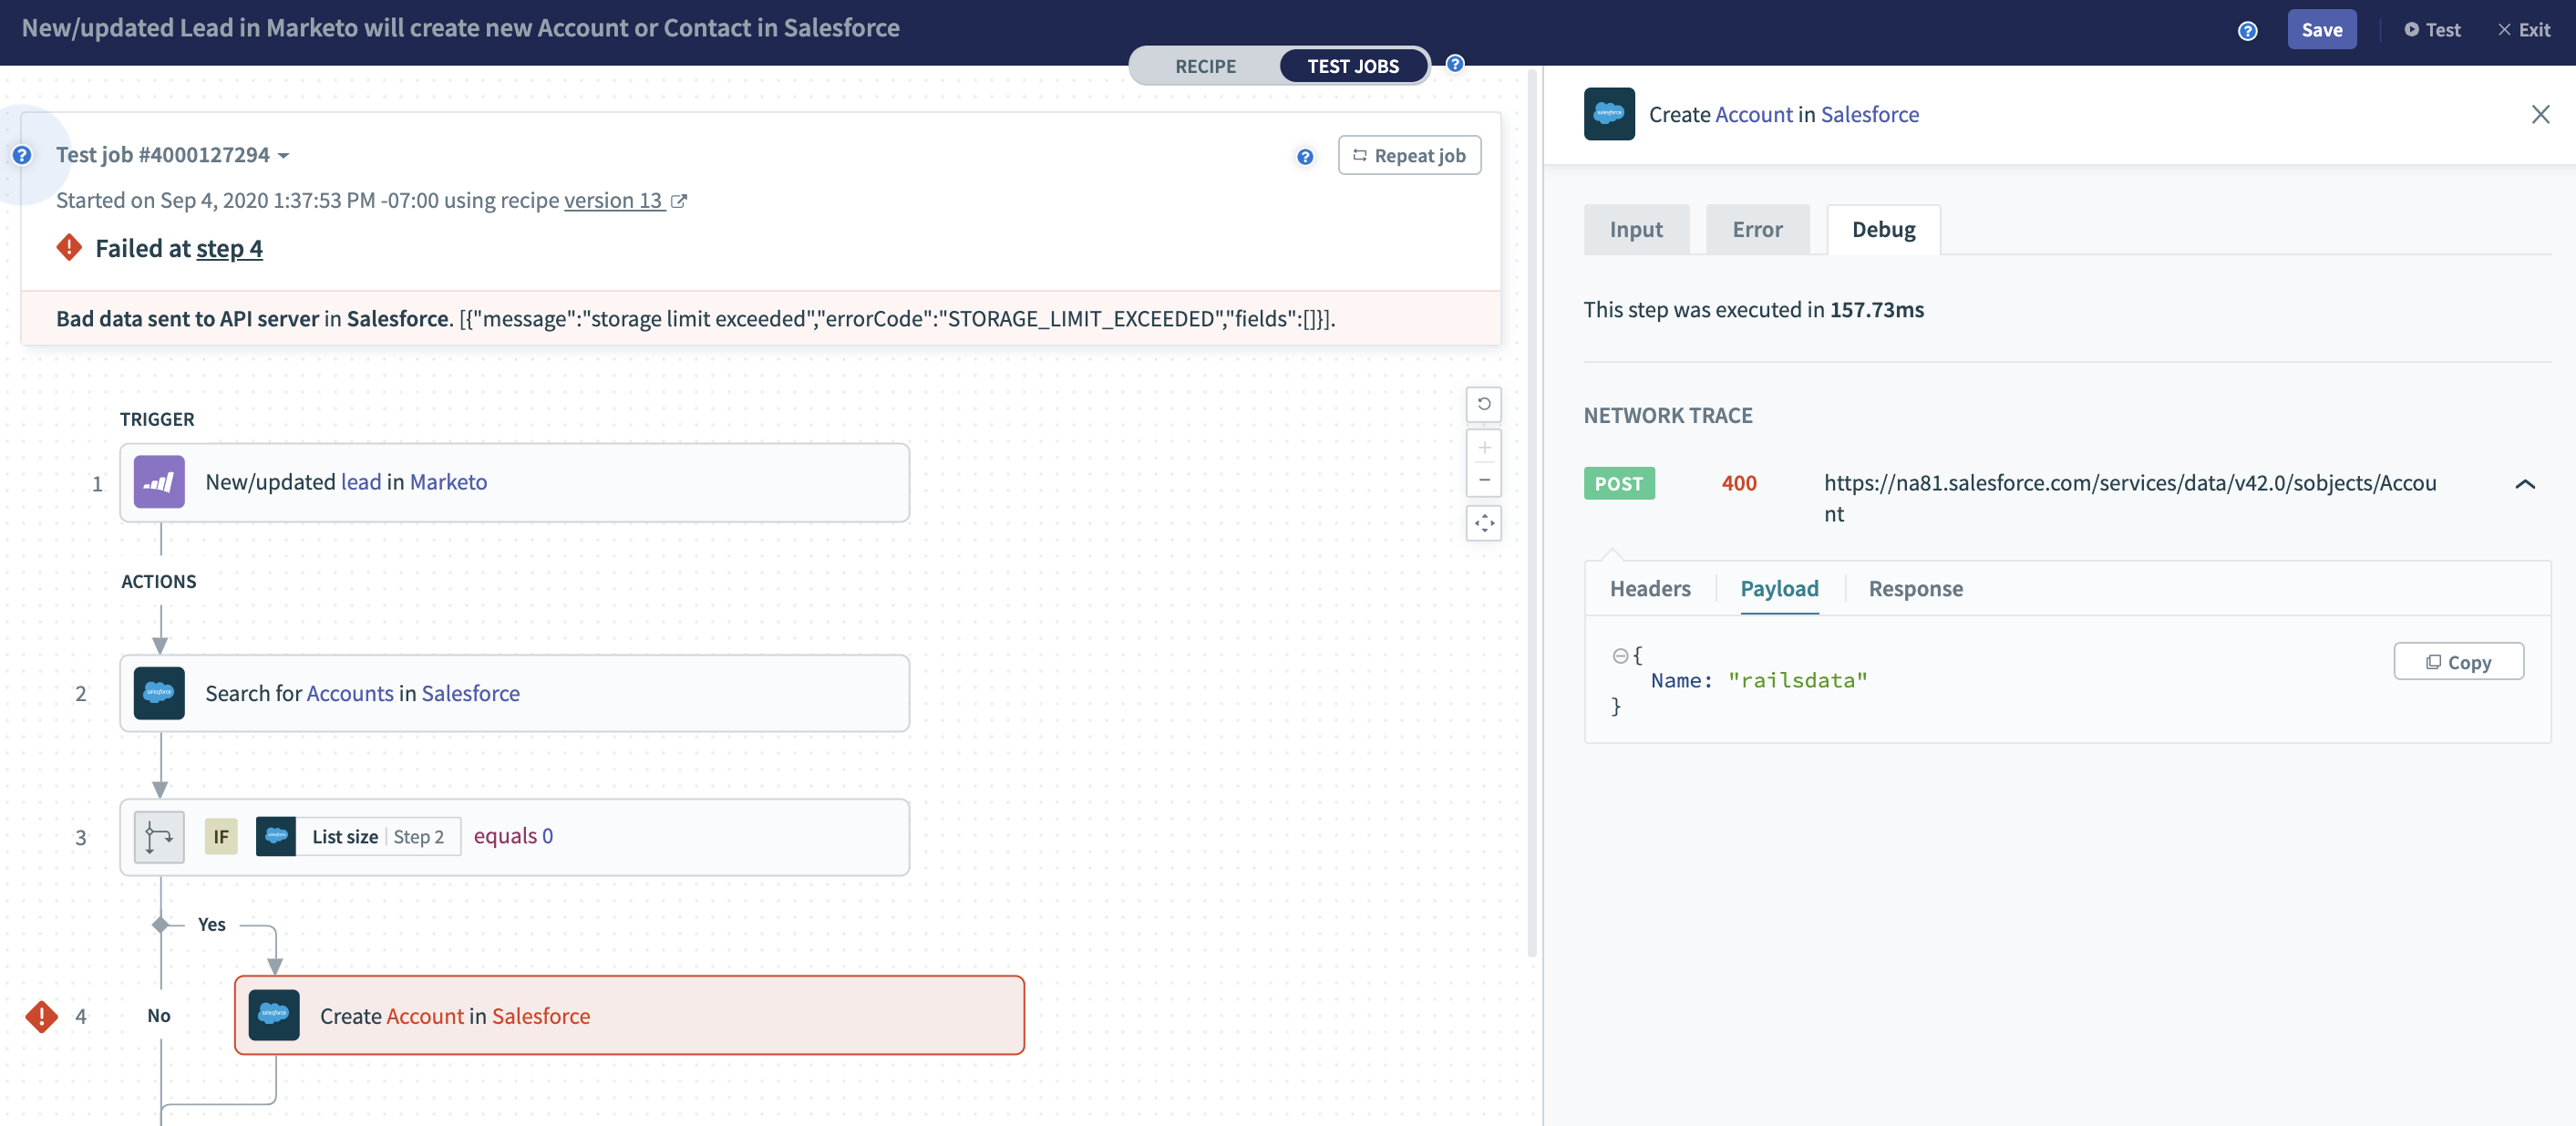 Test job - HTTP request payload sent to the application API
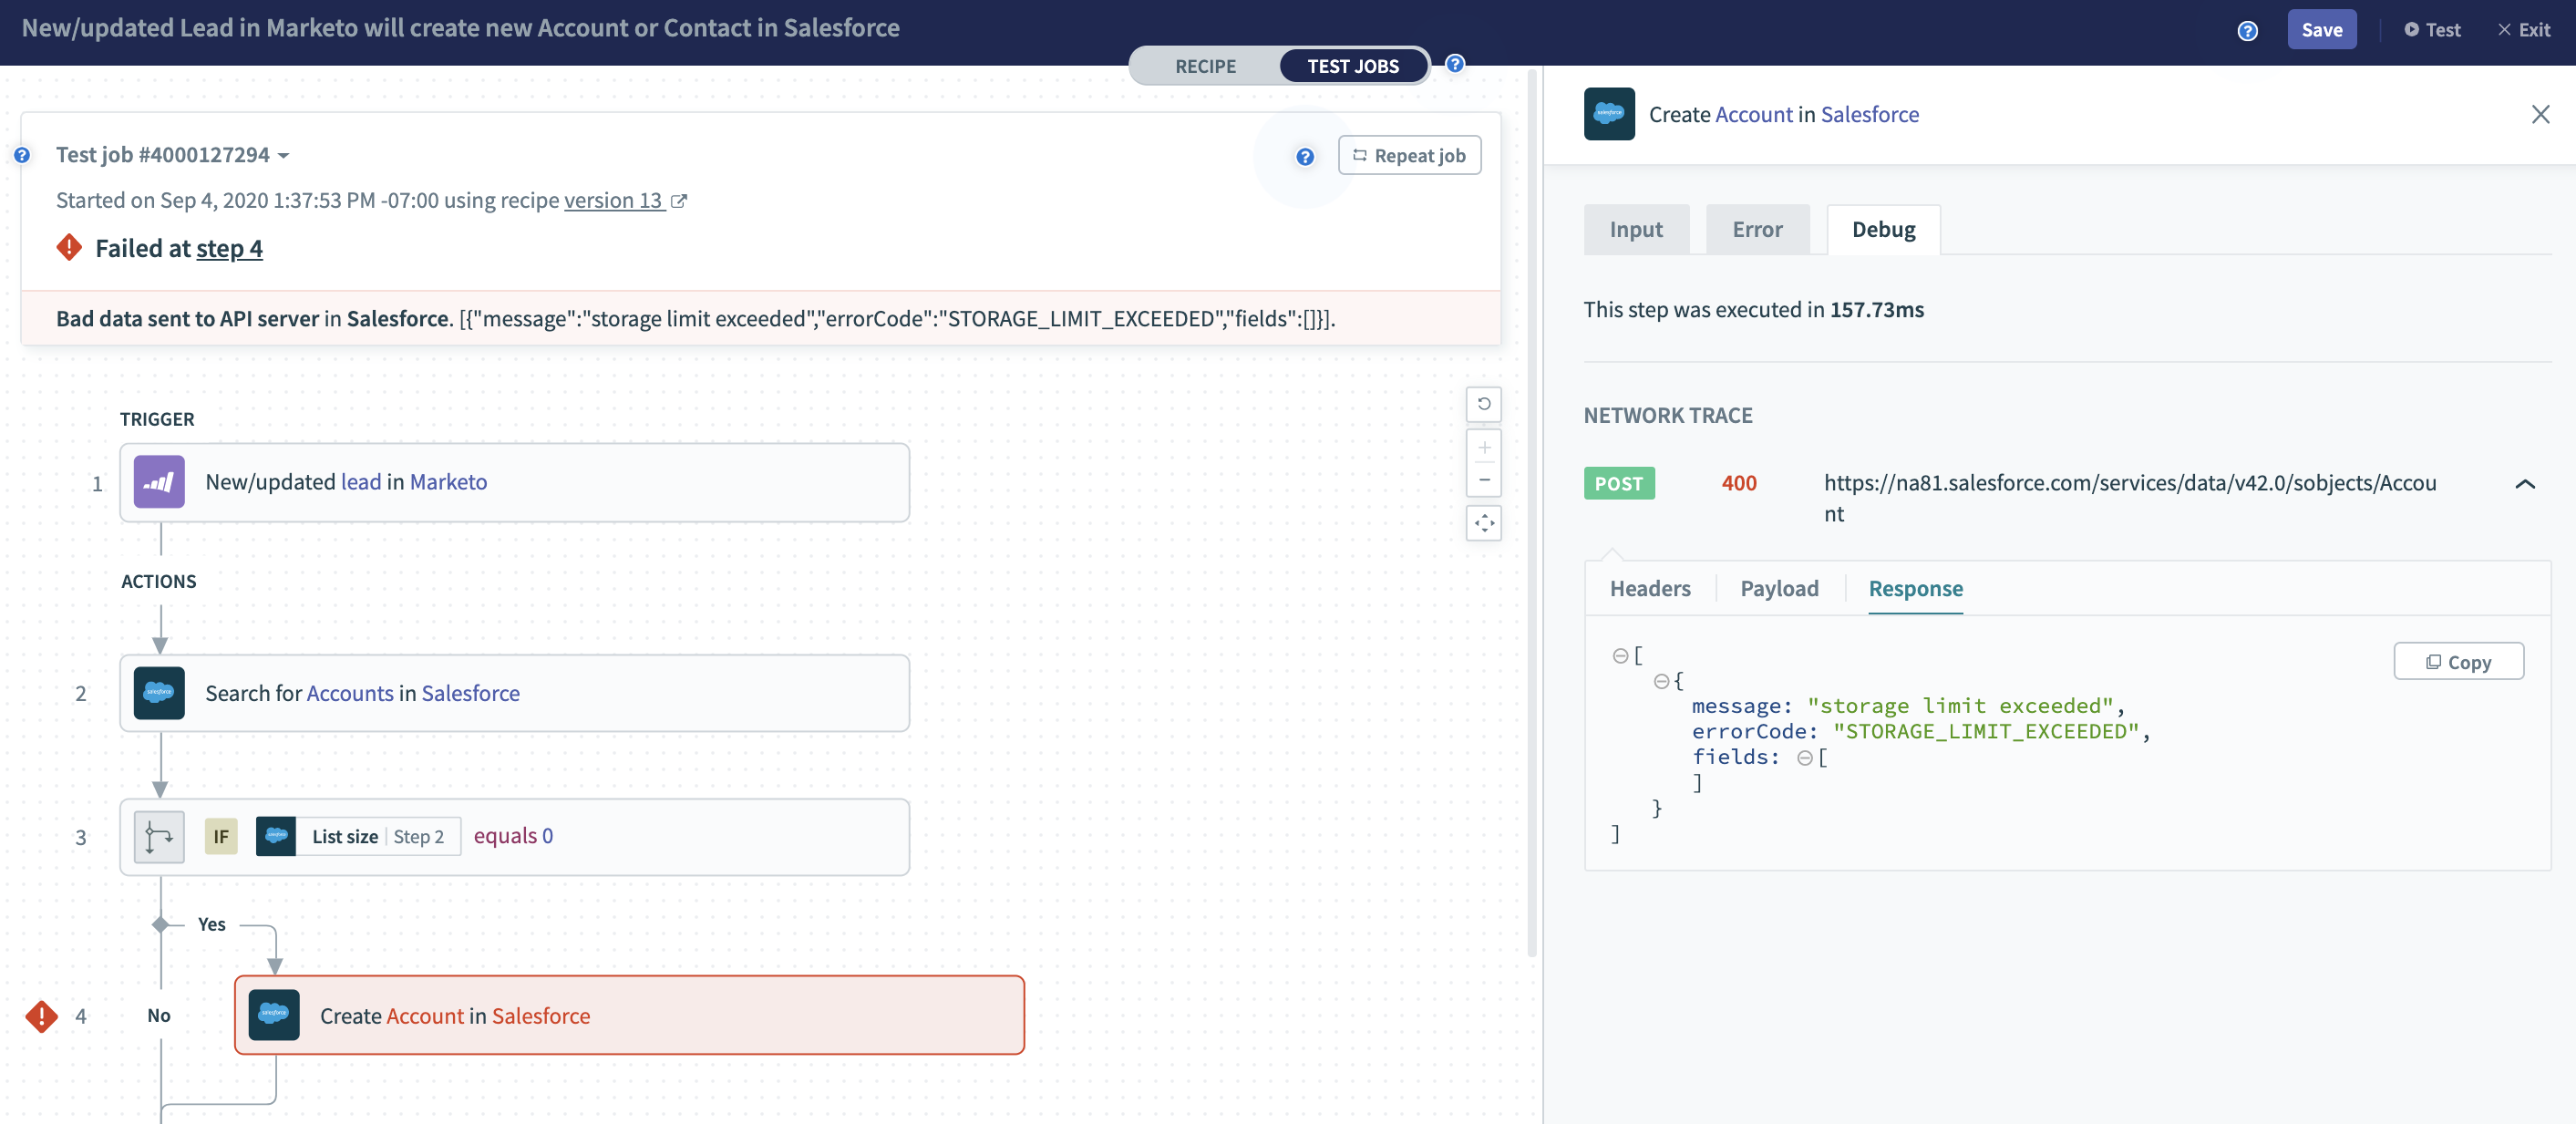 Test job - HTTP error response received from the application API
Jobs in error
Follow the steps below to generate and view the debug trace for a recipe whose job is in error.
In this example, the Update incident in ServiceNow recipe has jobs in error.
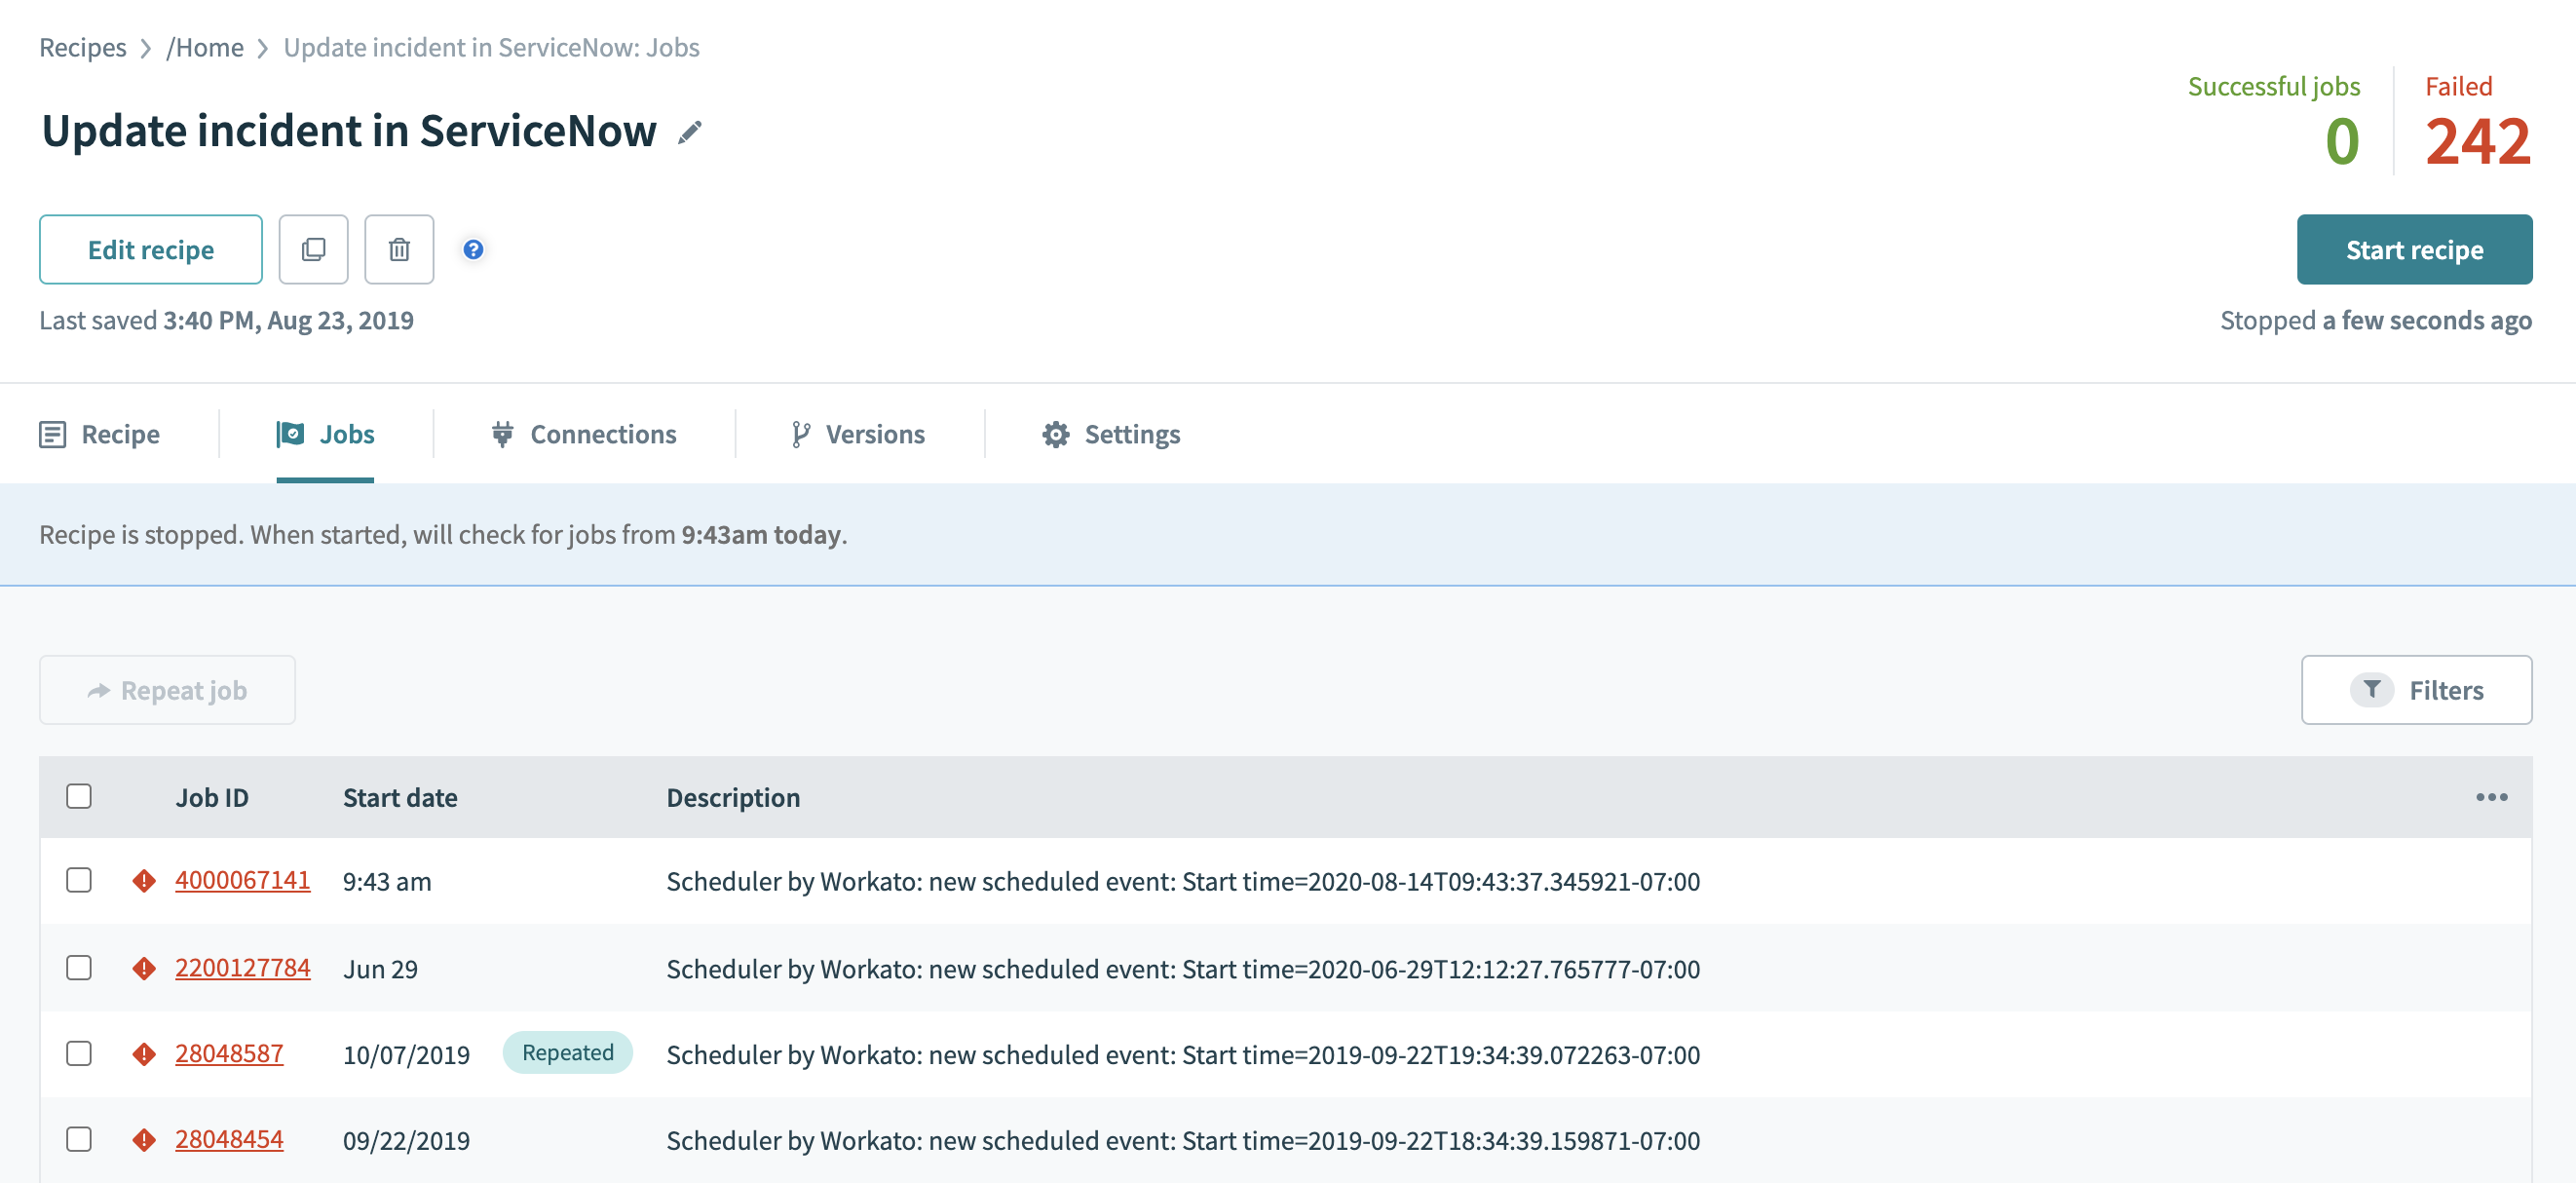 Jobs in error
You must repeat the job to generate the debug trace.
Repeat job
In the job details page, click Repeat job to generate the debug trace.
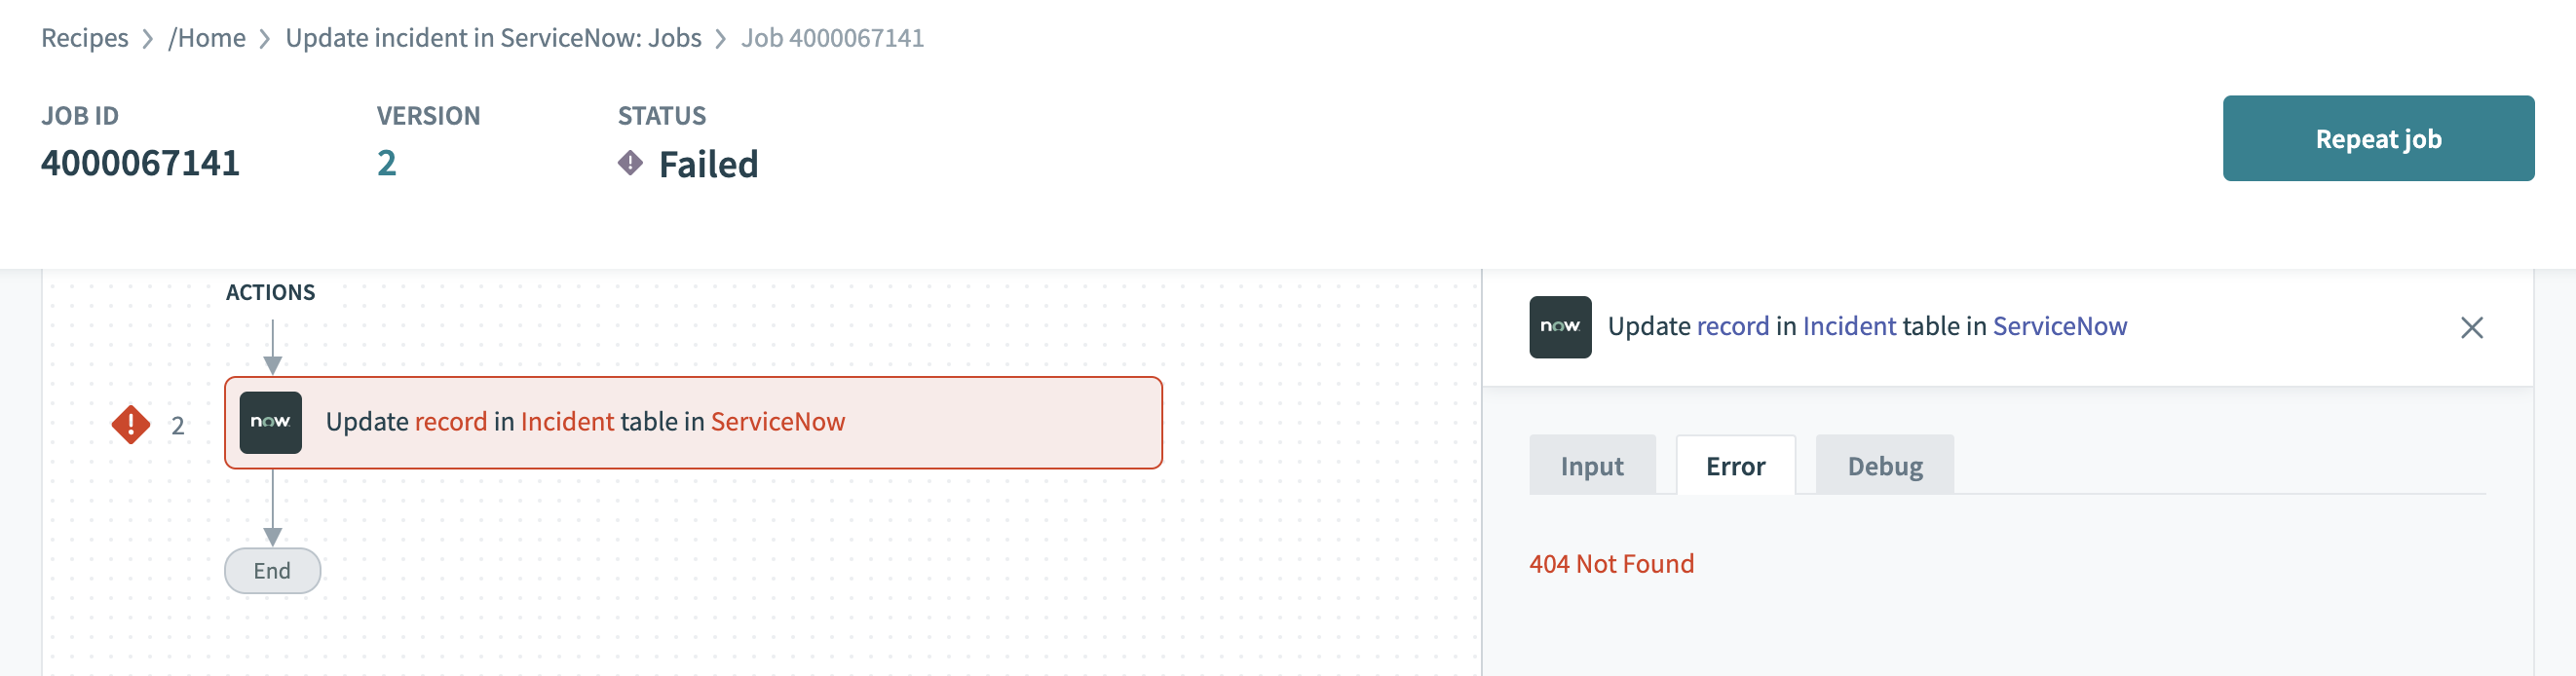 Repeat a job
Job debug tracing example
If you have seen HTTP 404 Not Found or 400 Bad Request or 403 Forbidden and wanted more details about the error, now you can with the job debug tracing. Here's an example scenario, where an update to incident table in ServiceNow fails with the 404 Not Found error. Job debug tracing enables you to quickly and efficiently understand the root cause of the error by providing you more details.
Viewing debug trace
Once the job is repeated, the latest repeat of the job shows the debug trace in the Debug tab of the action line.
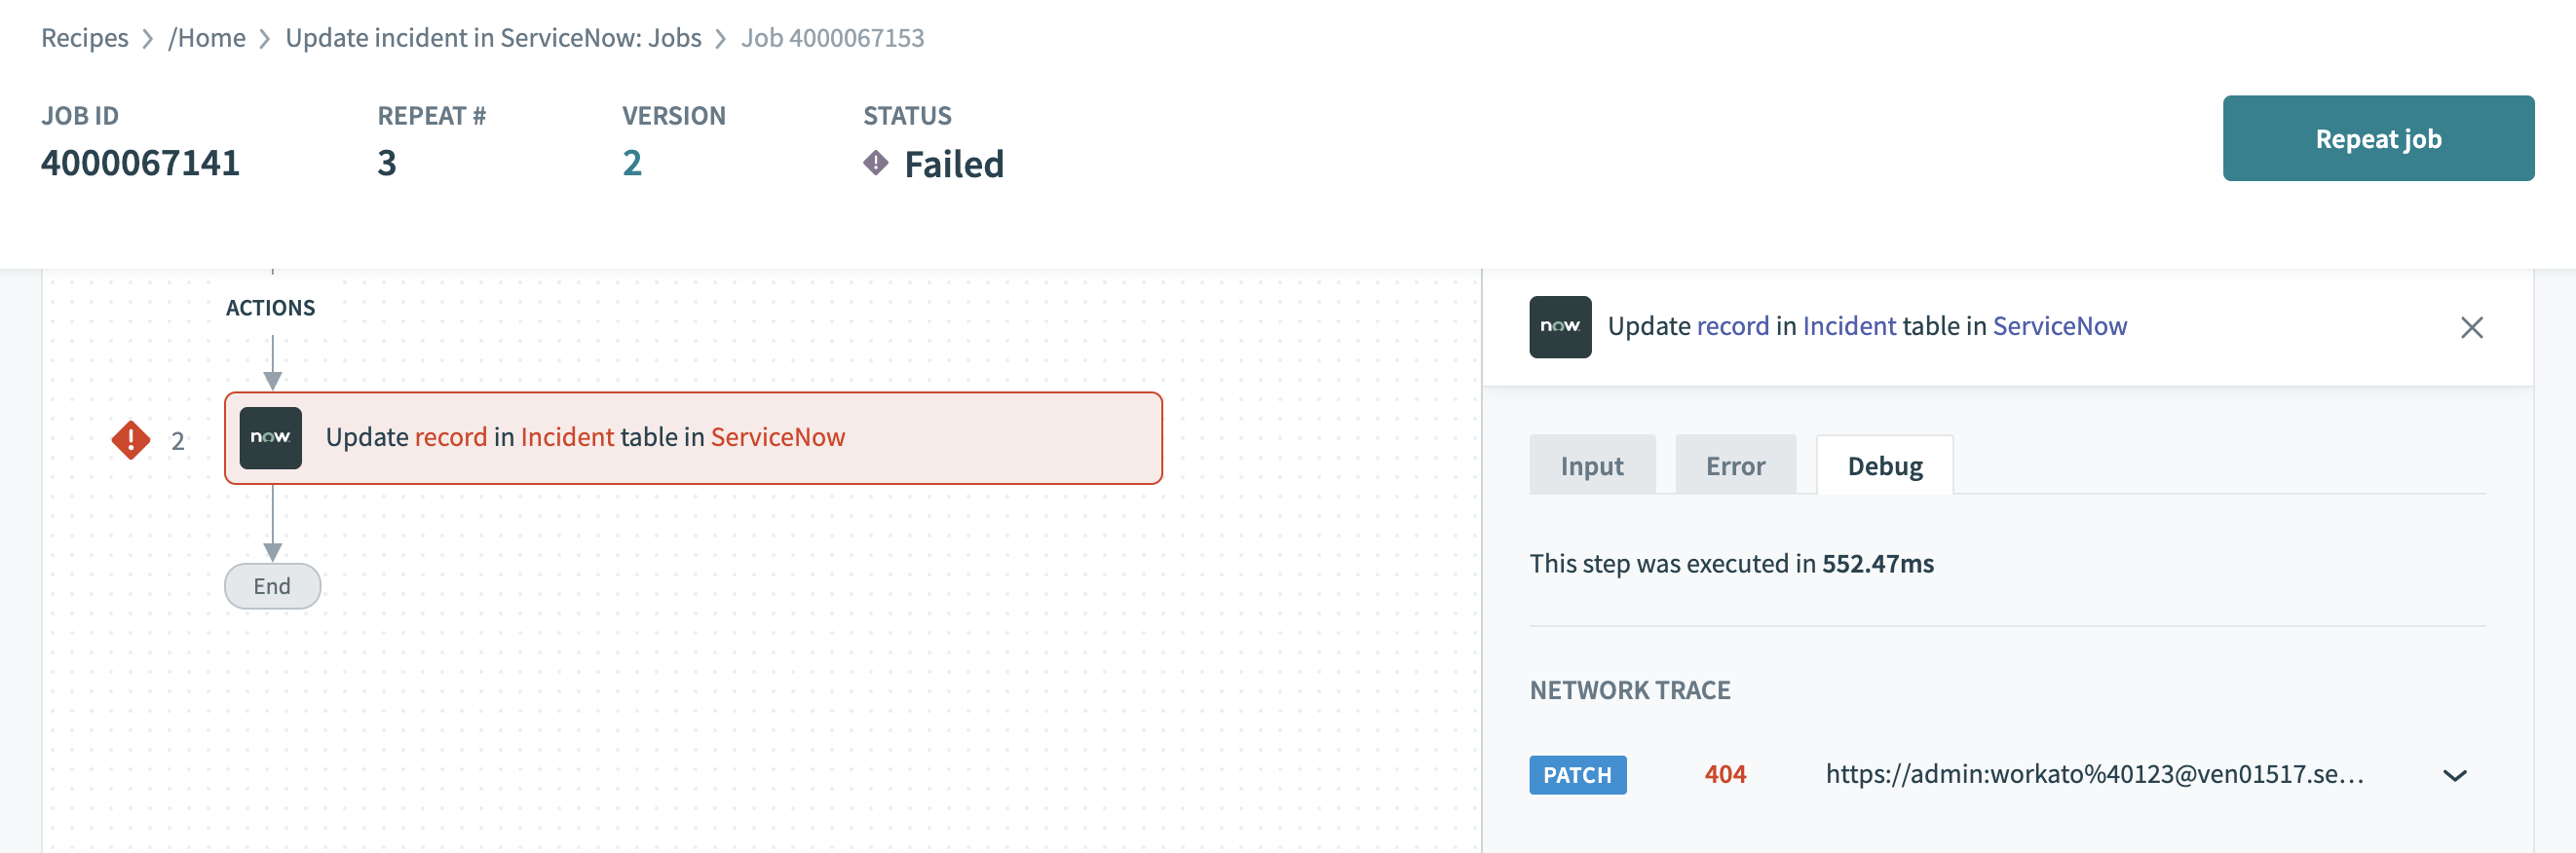 404 Not Found
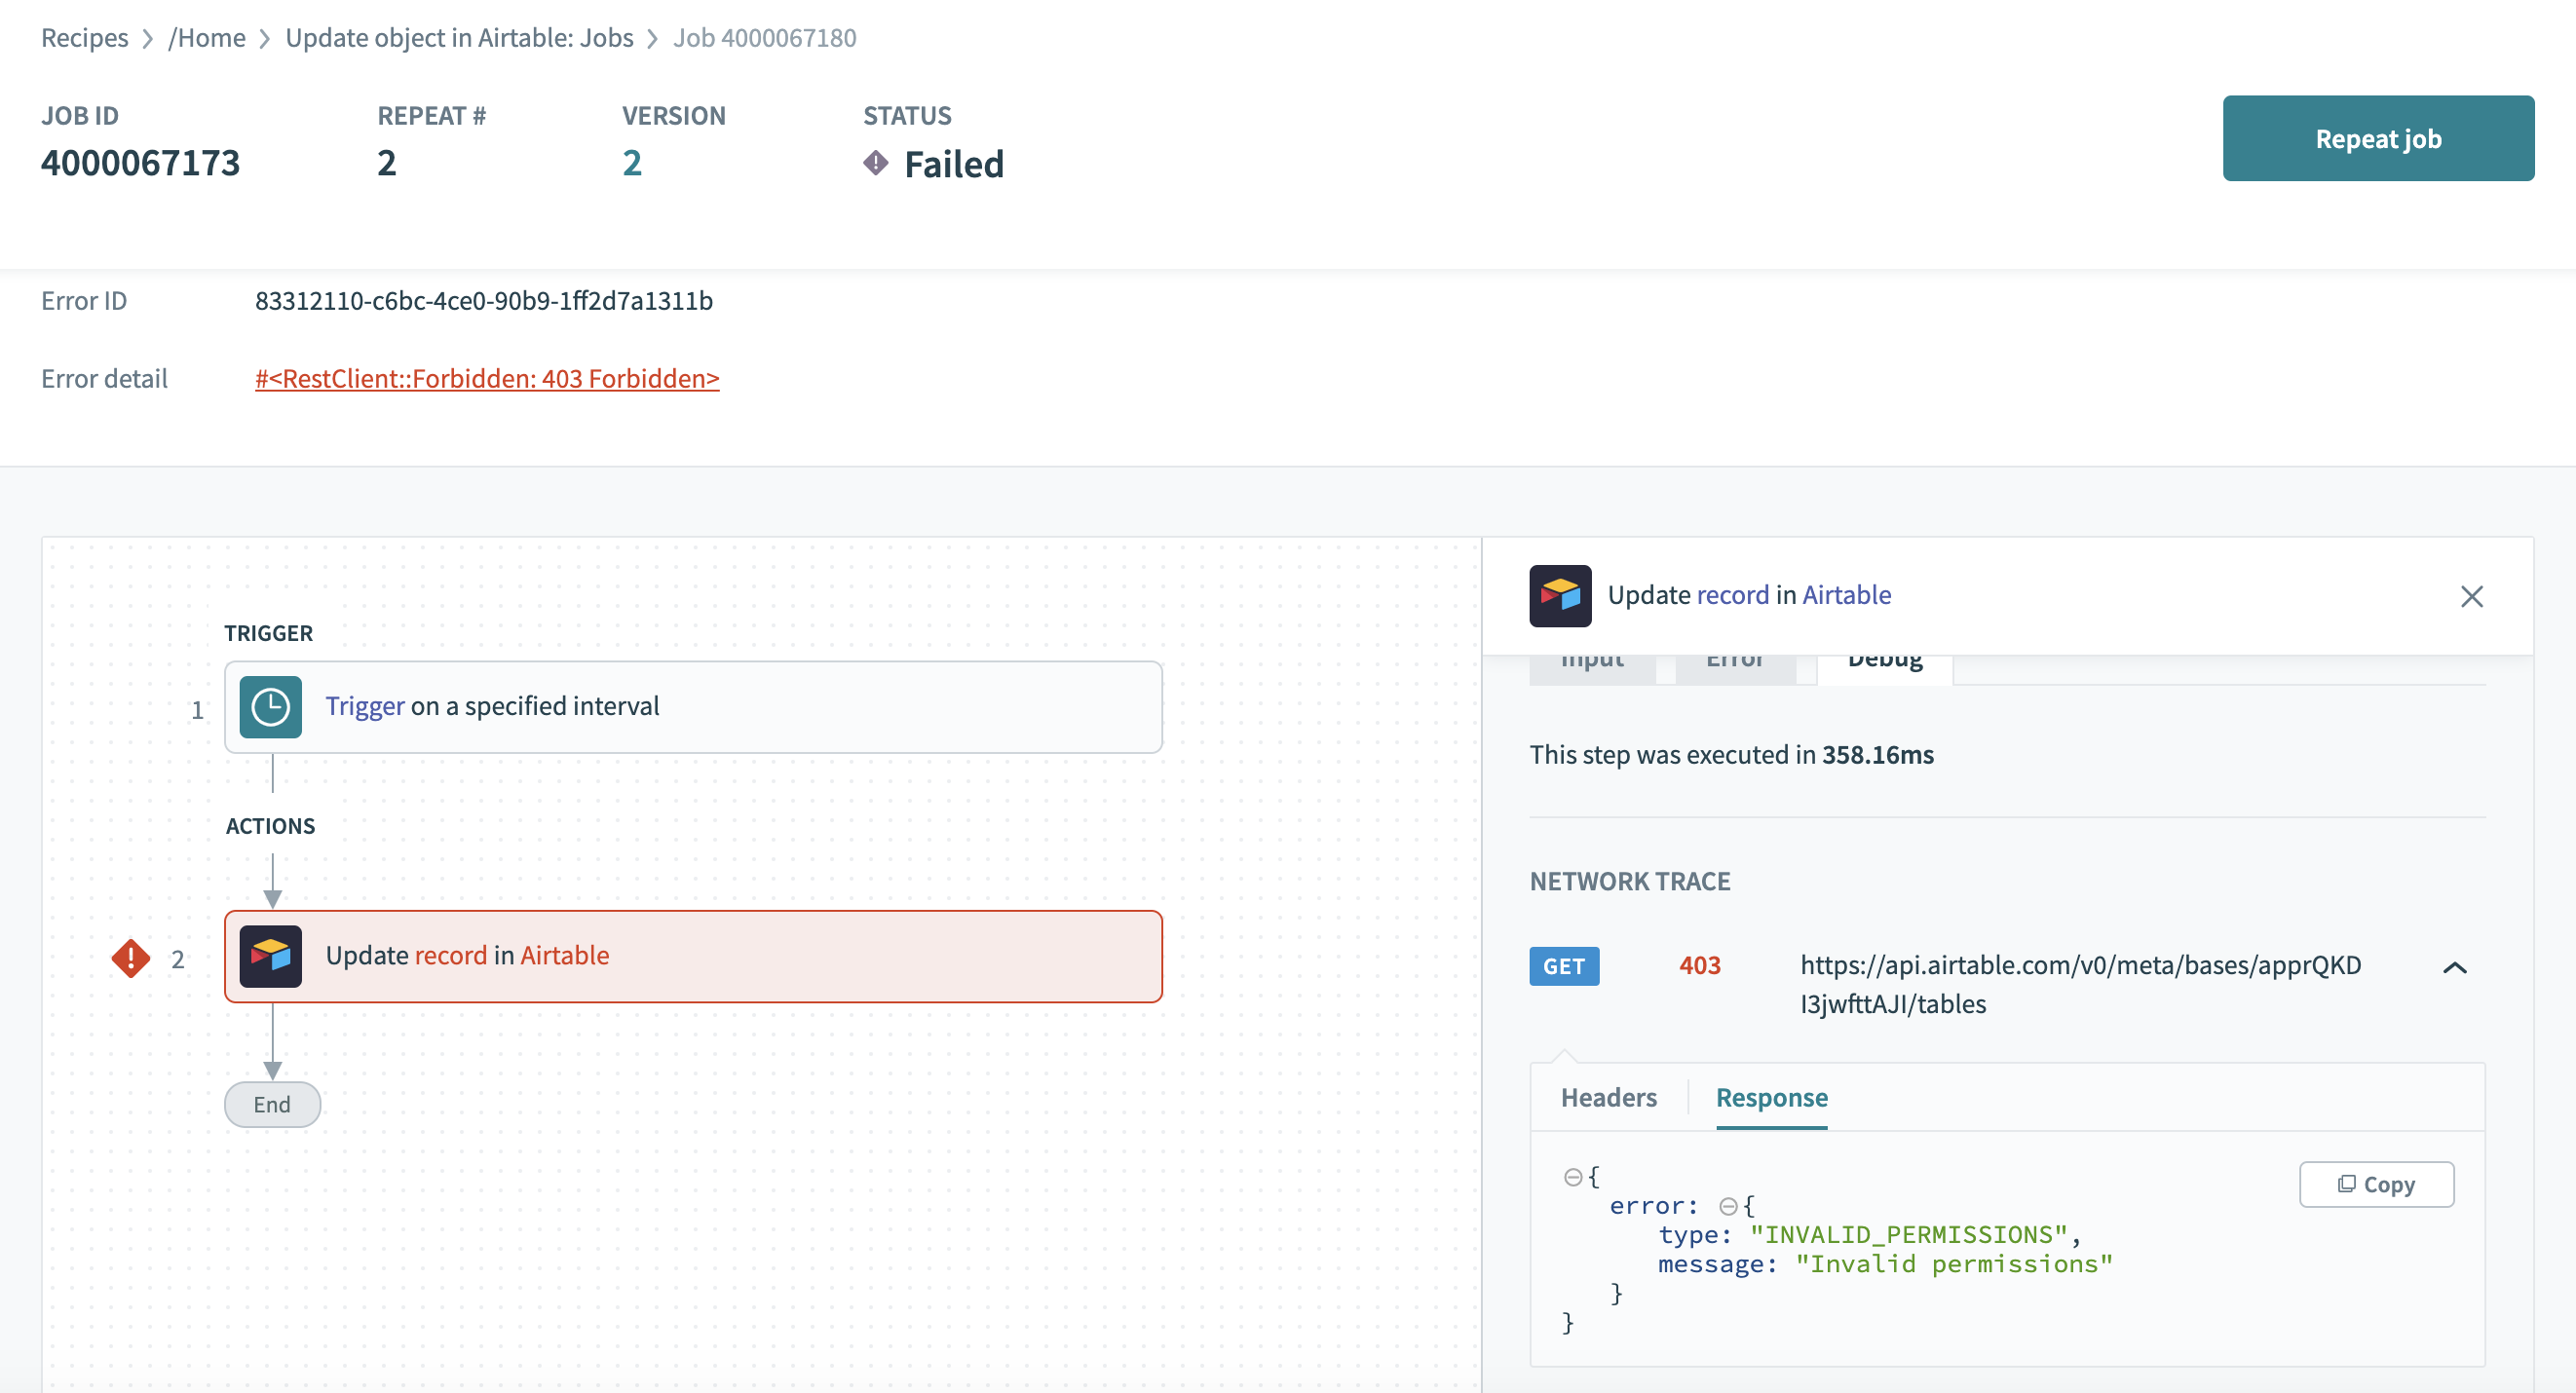
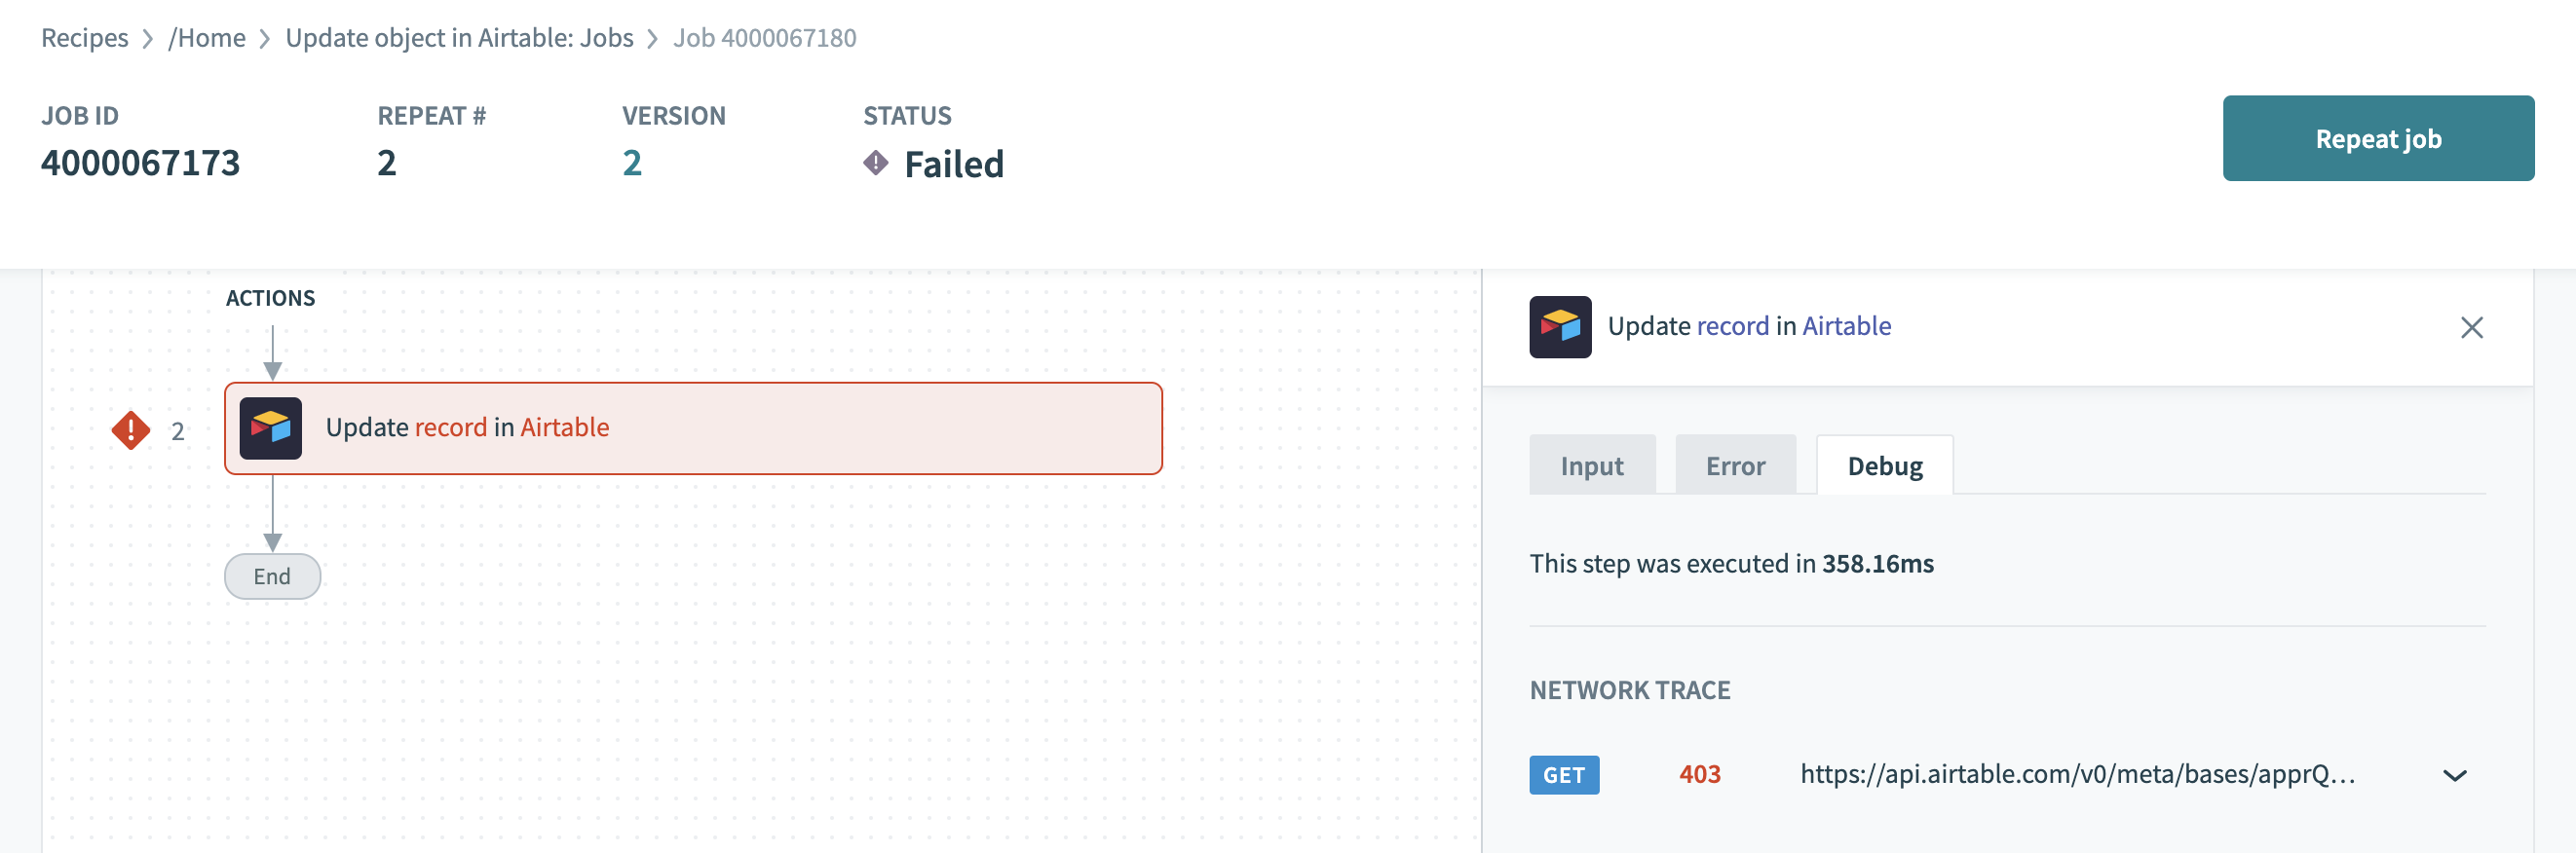 403 Forbidden
Select the HTTP request line to expand and get more information on the request.
HTTP Headers, Request, and Response
To view headers sent as part of the request, select the Headers tab.
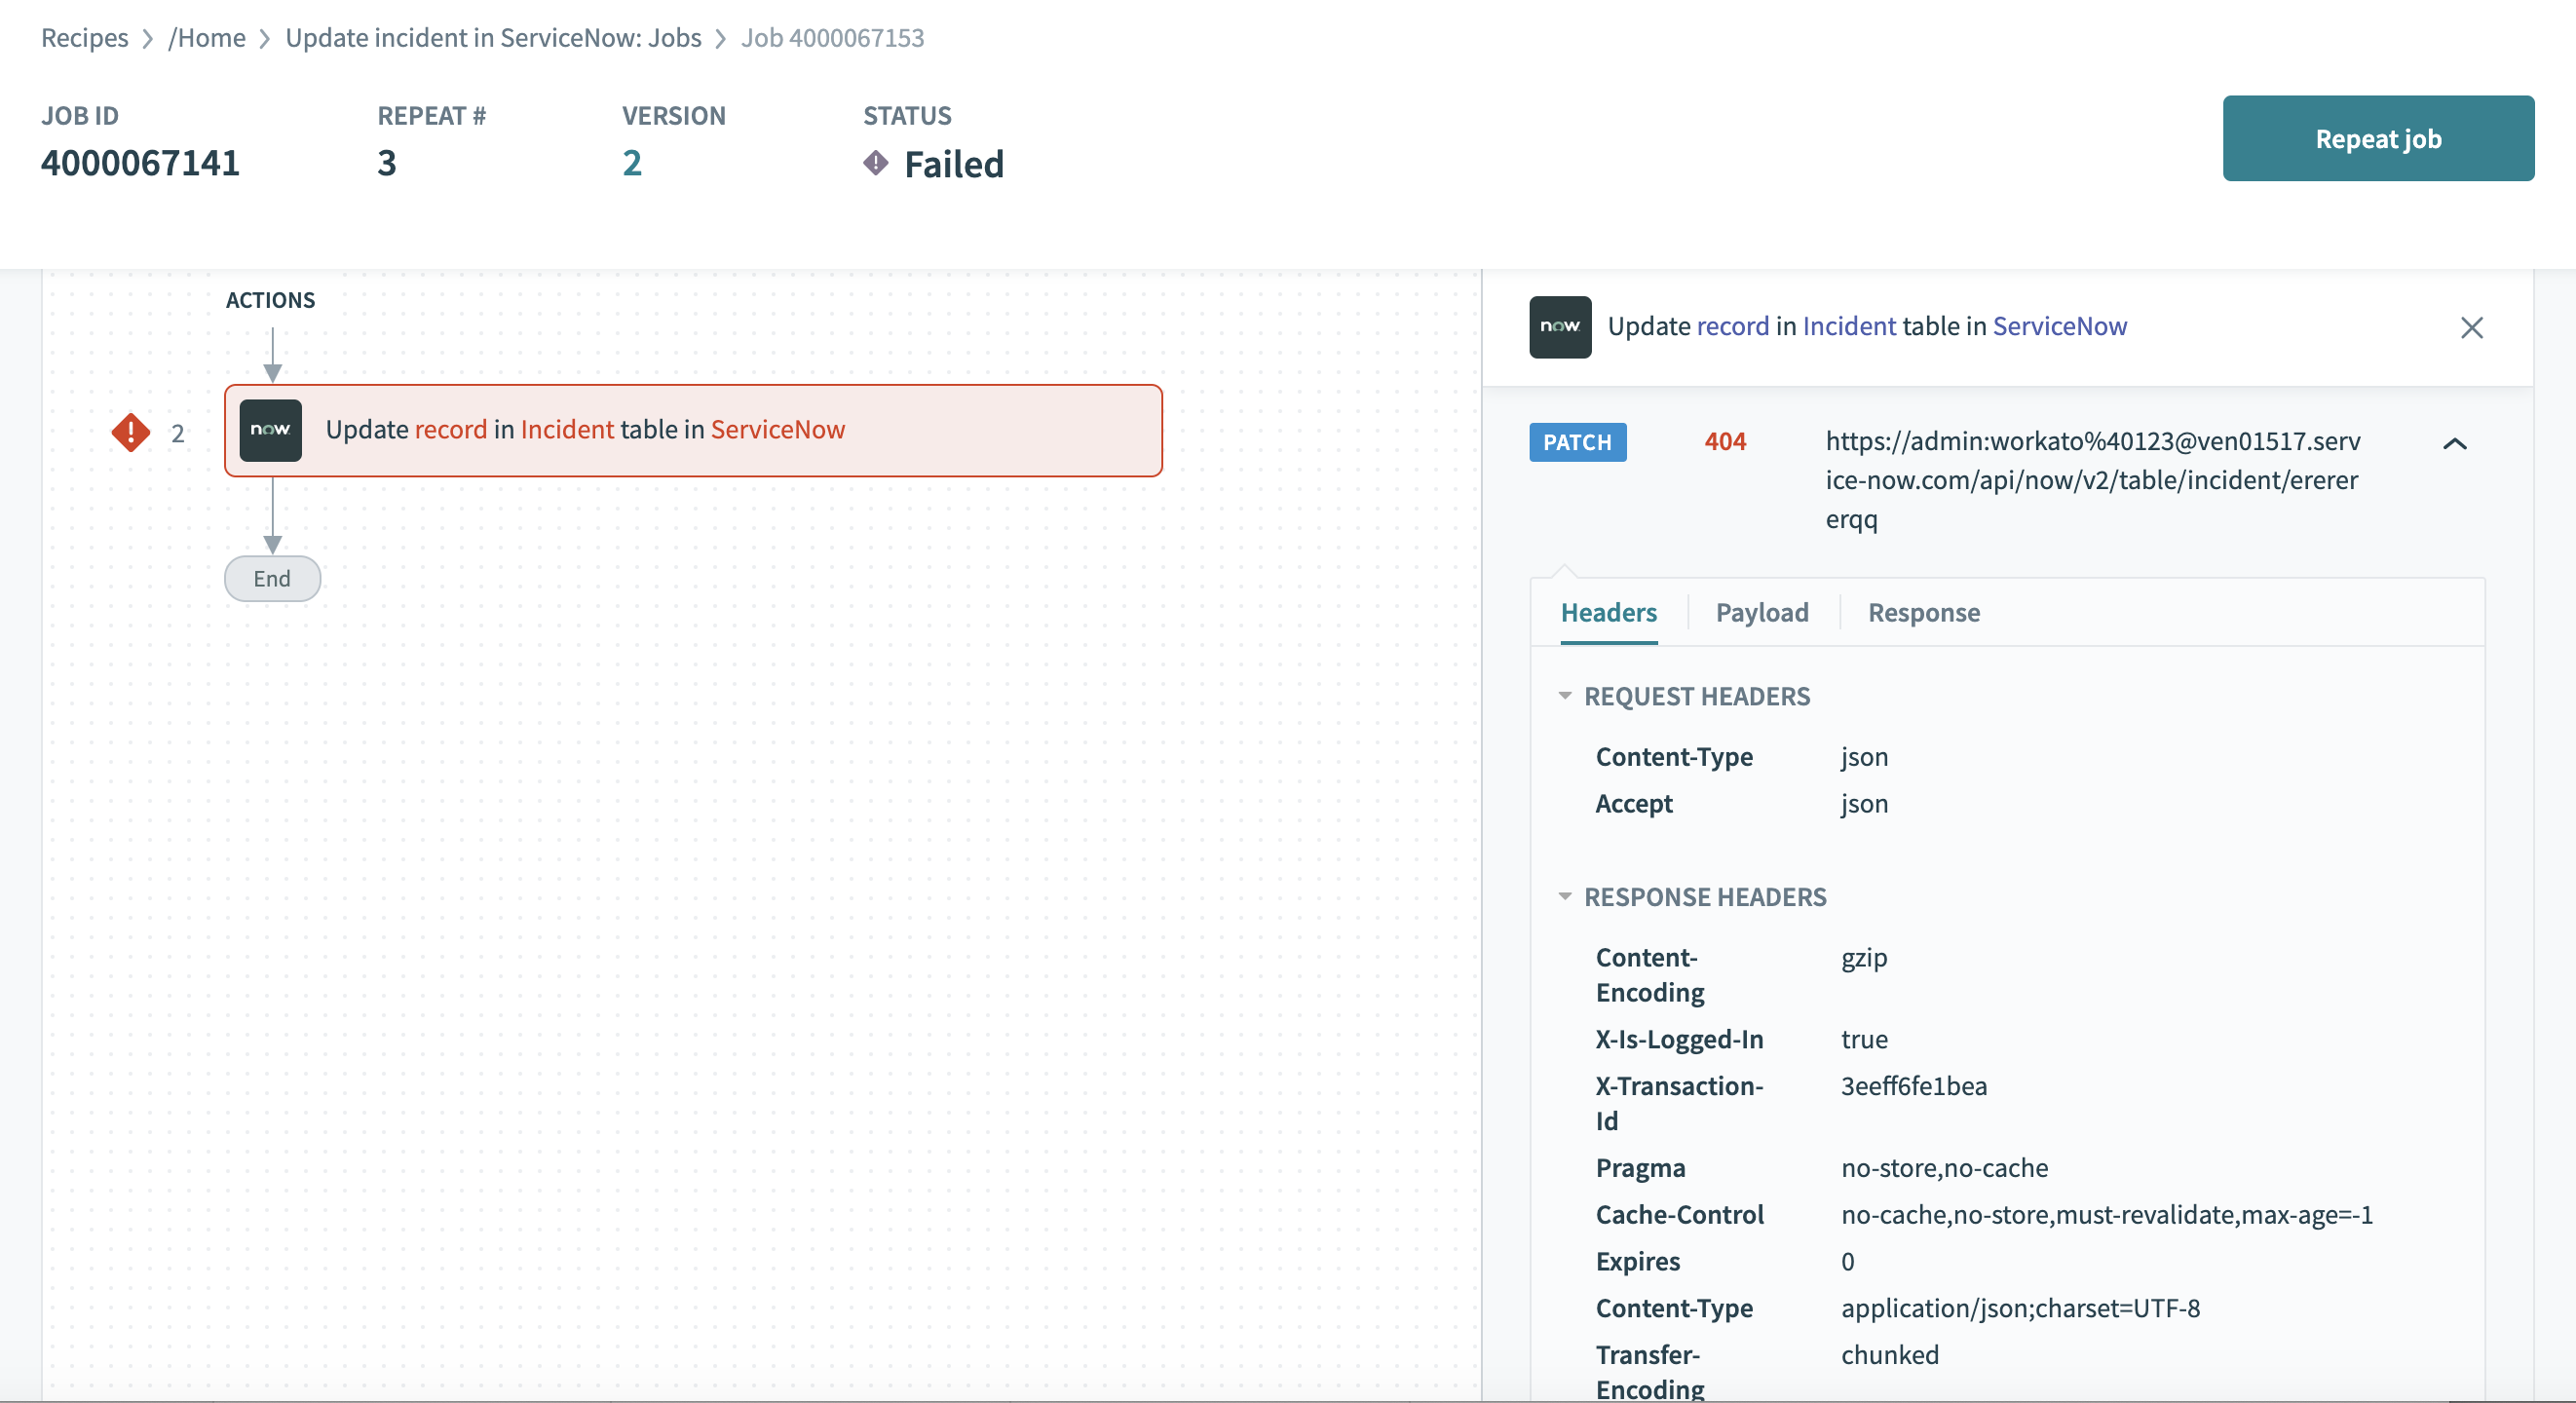 HTTP request and response headers
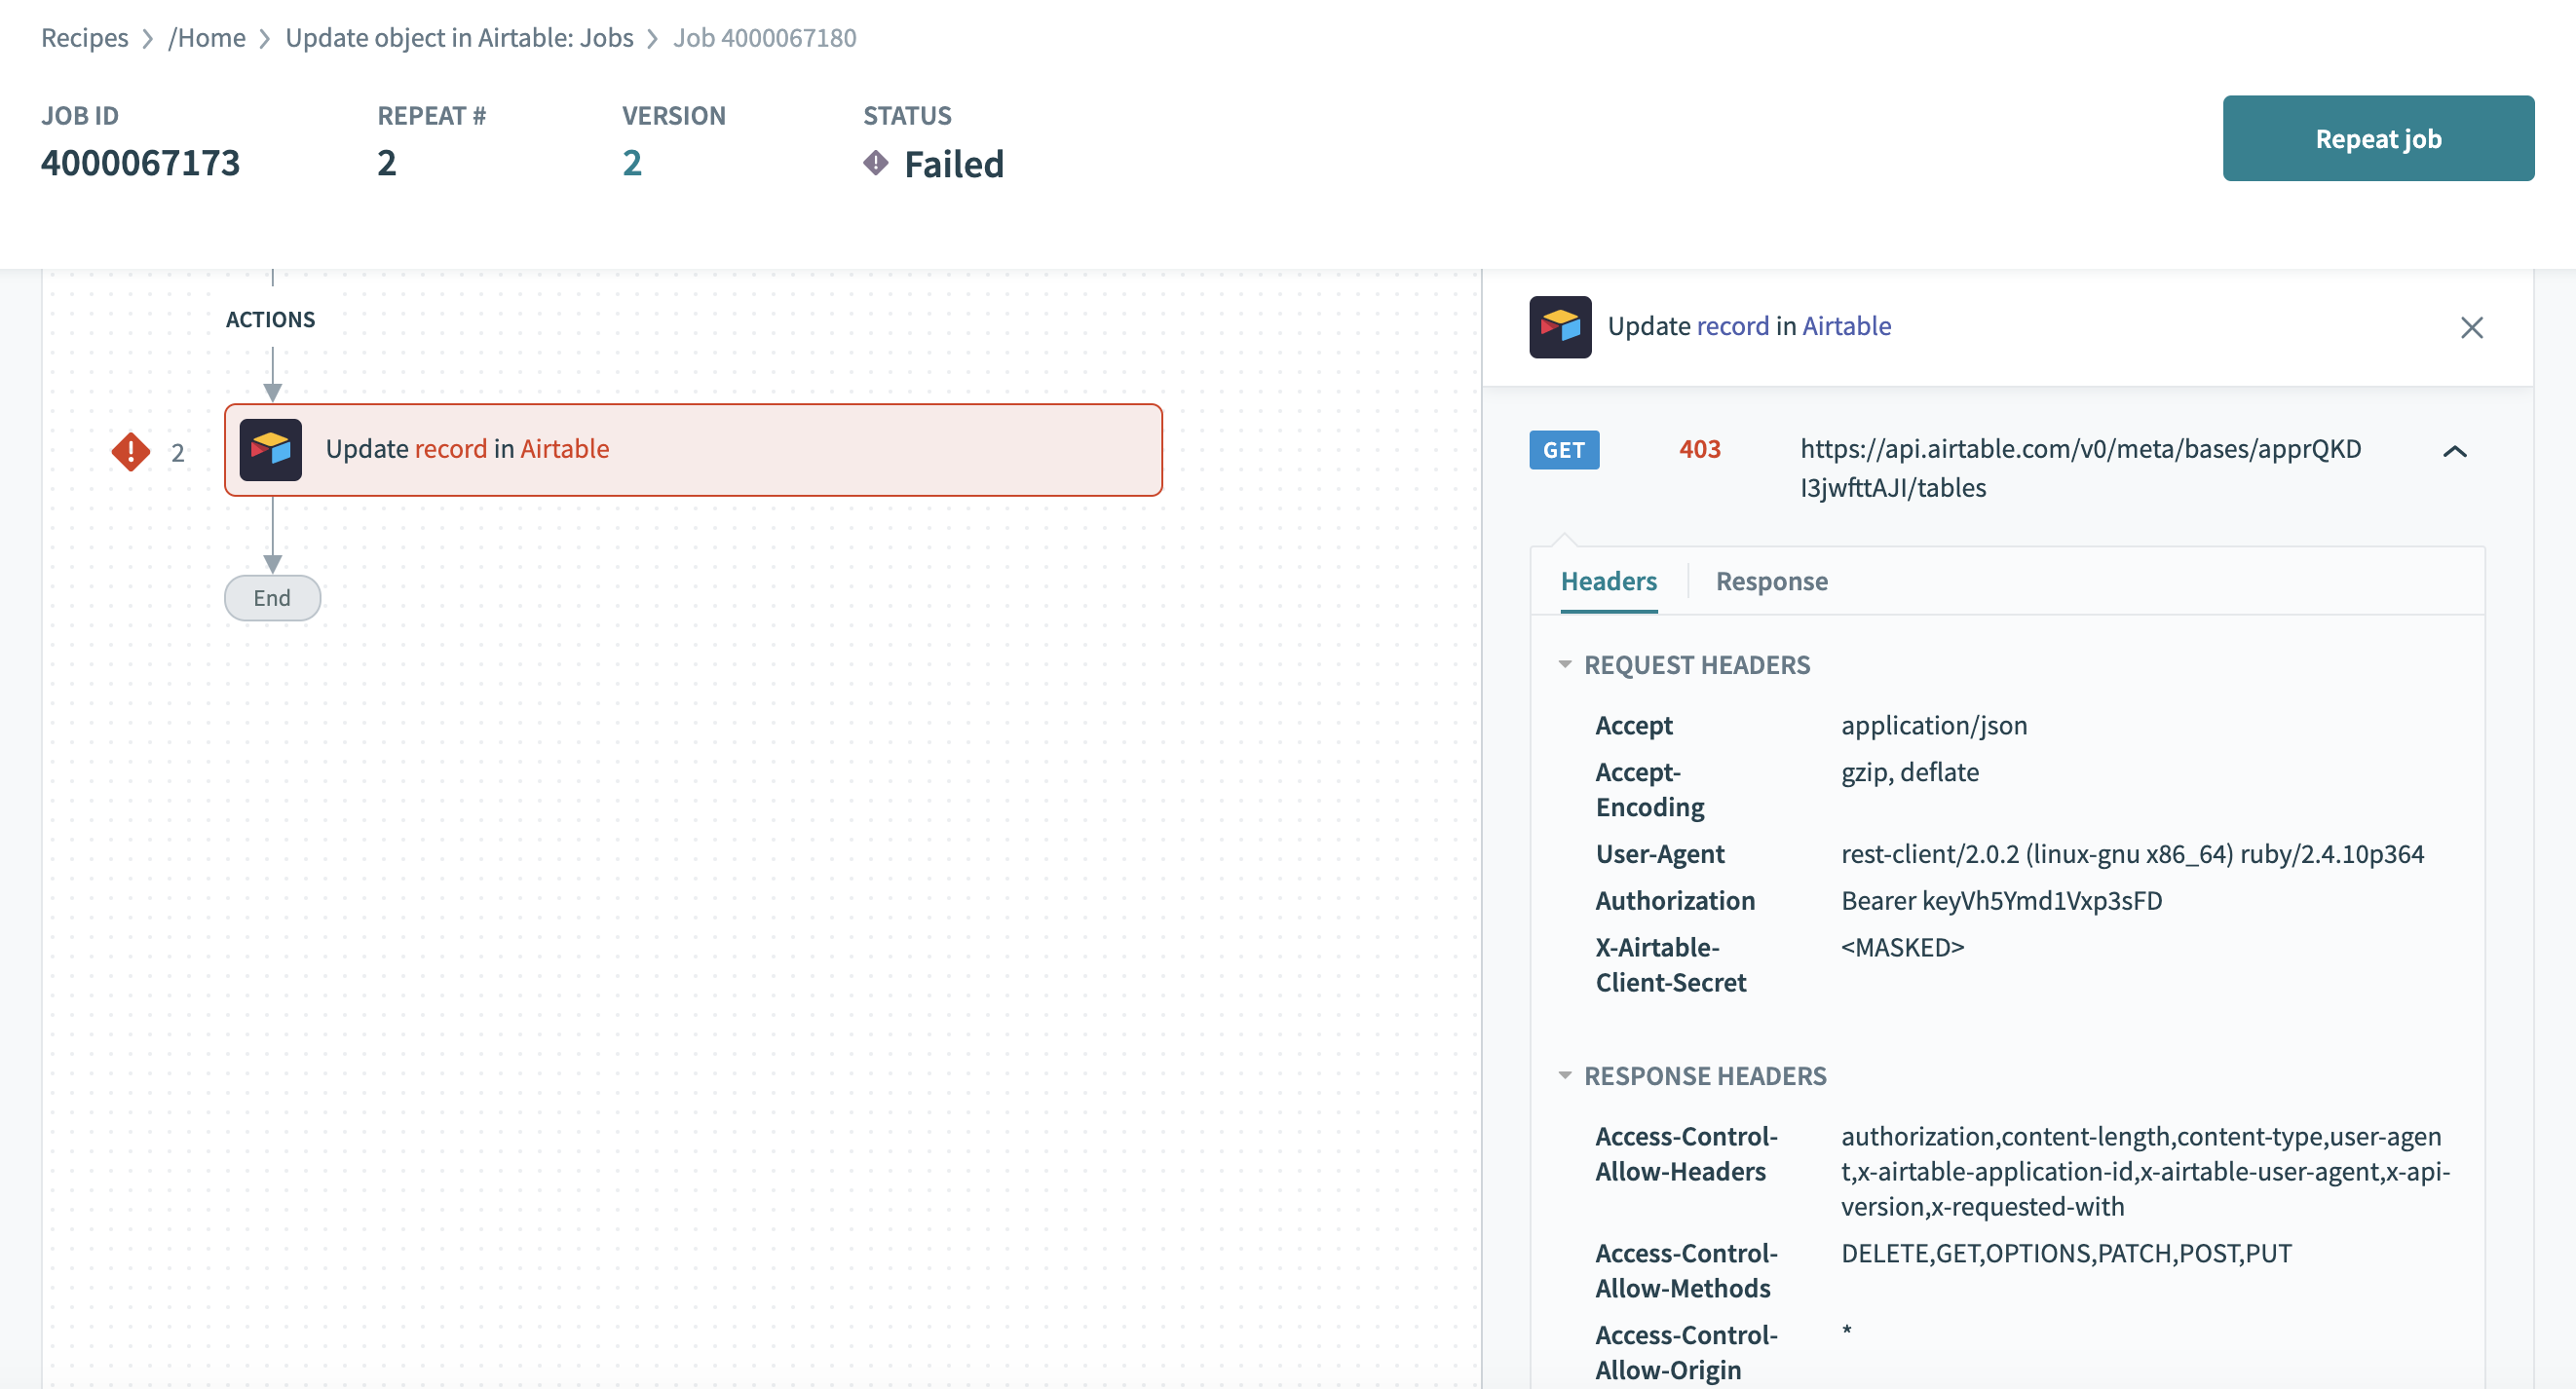 HTTP request and response headers
The Payload tab shows the request payload sent with the request.
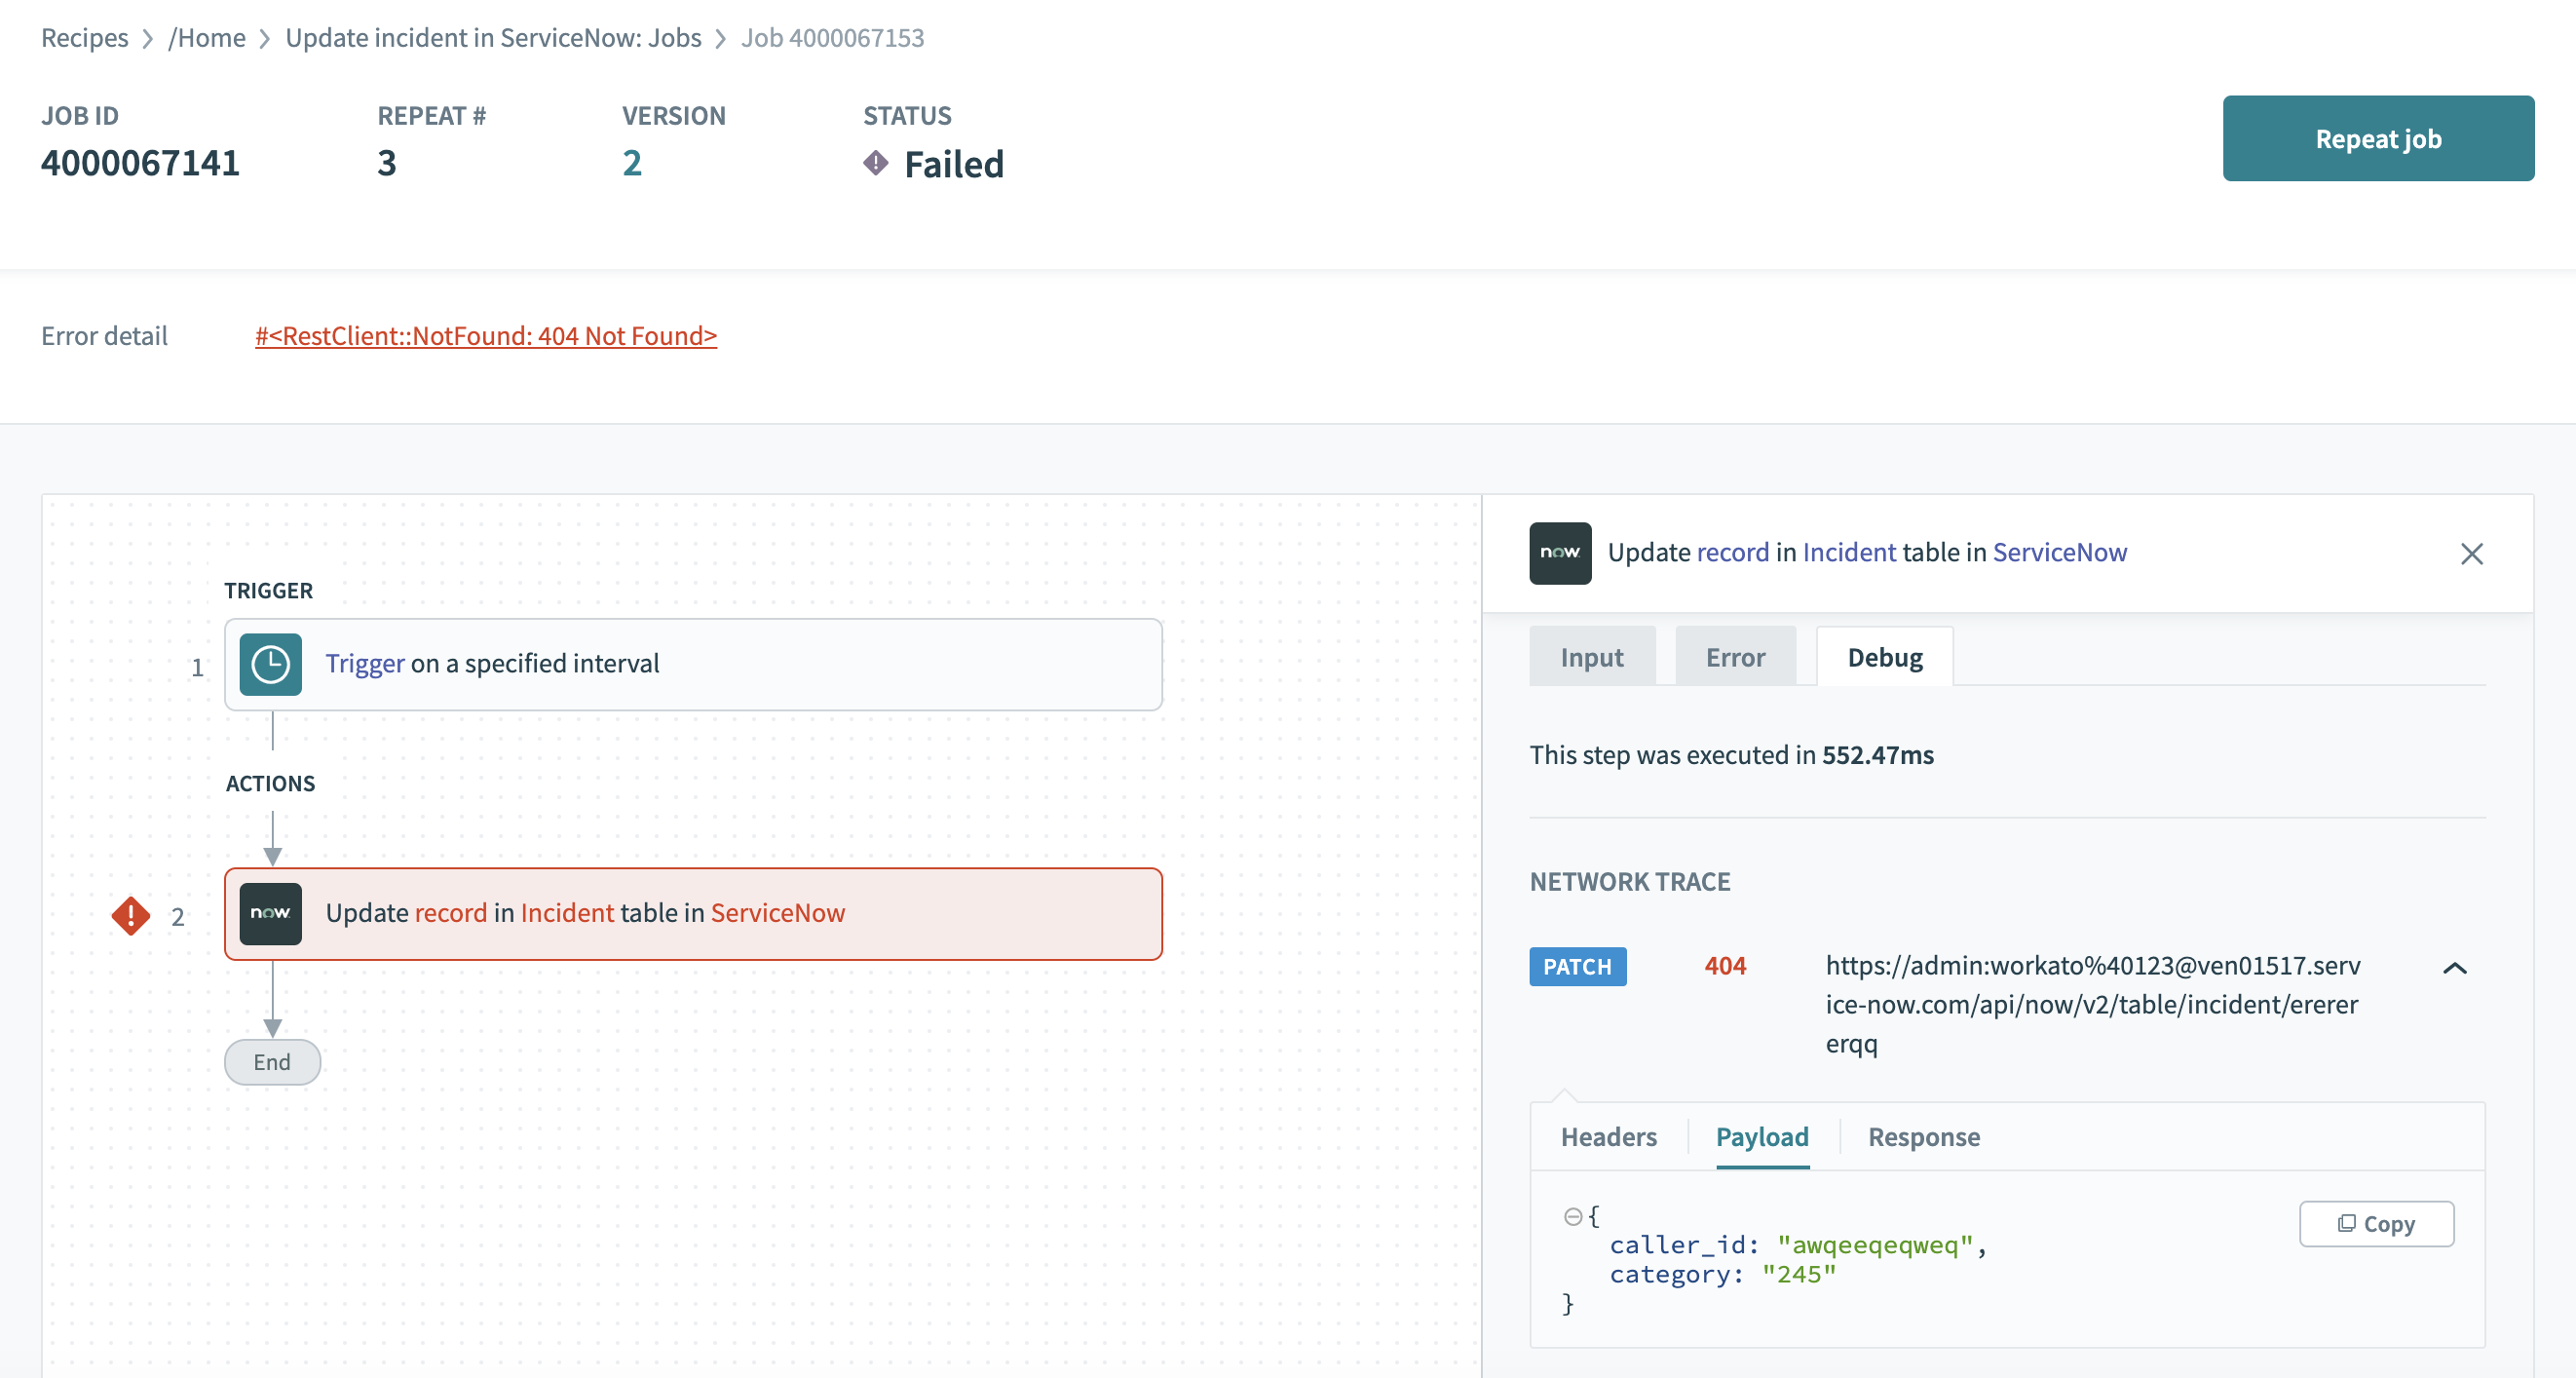 Request payload
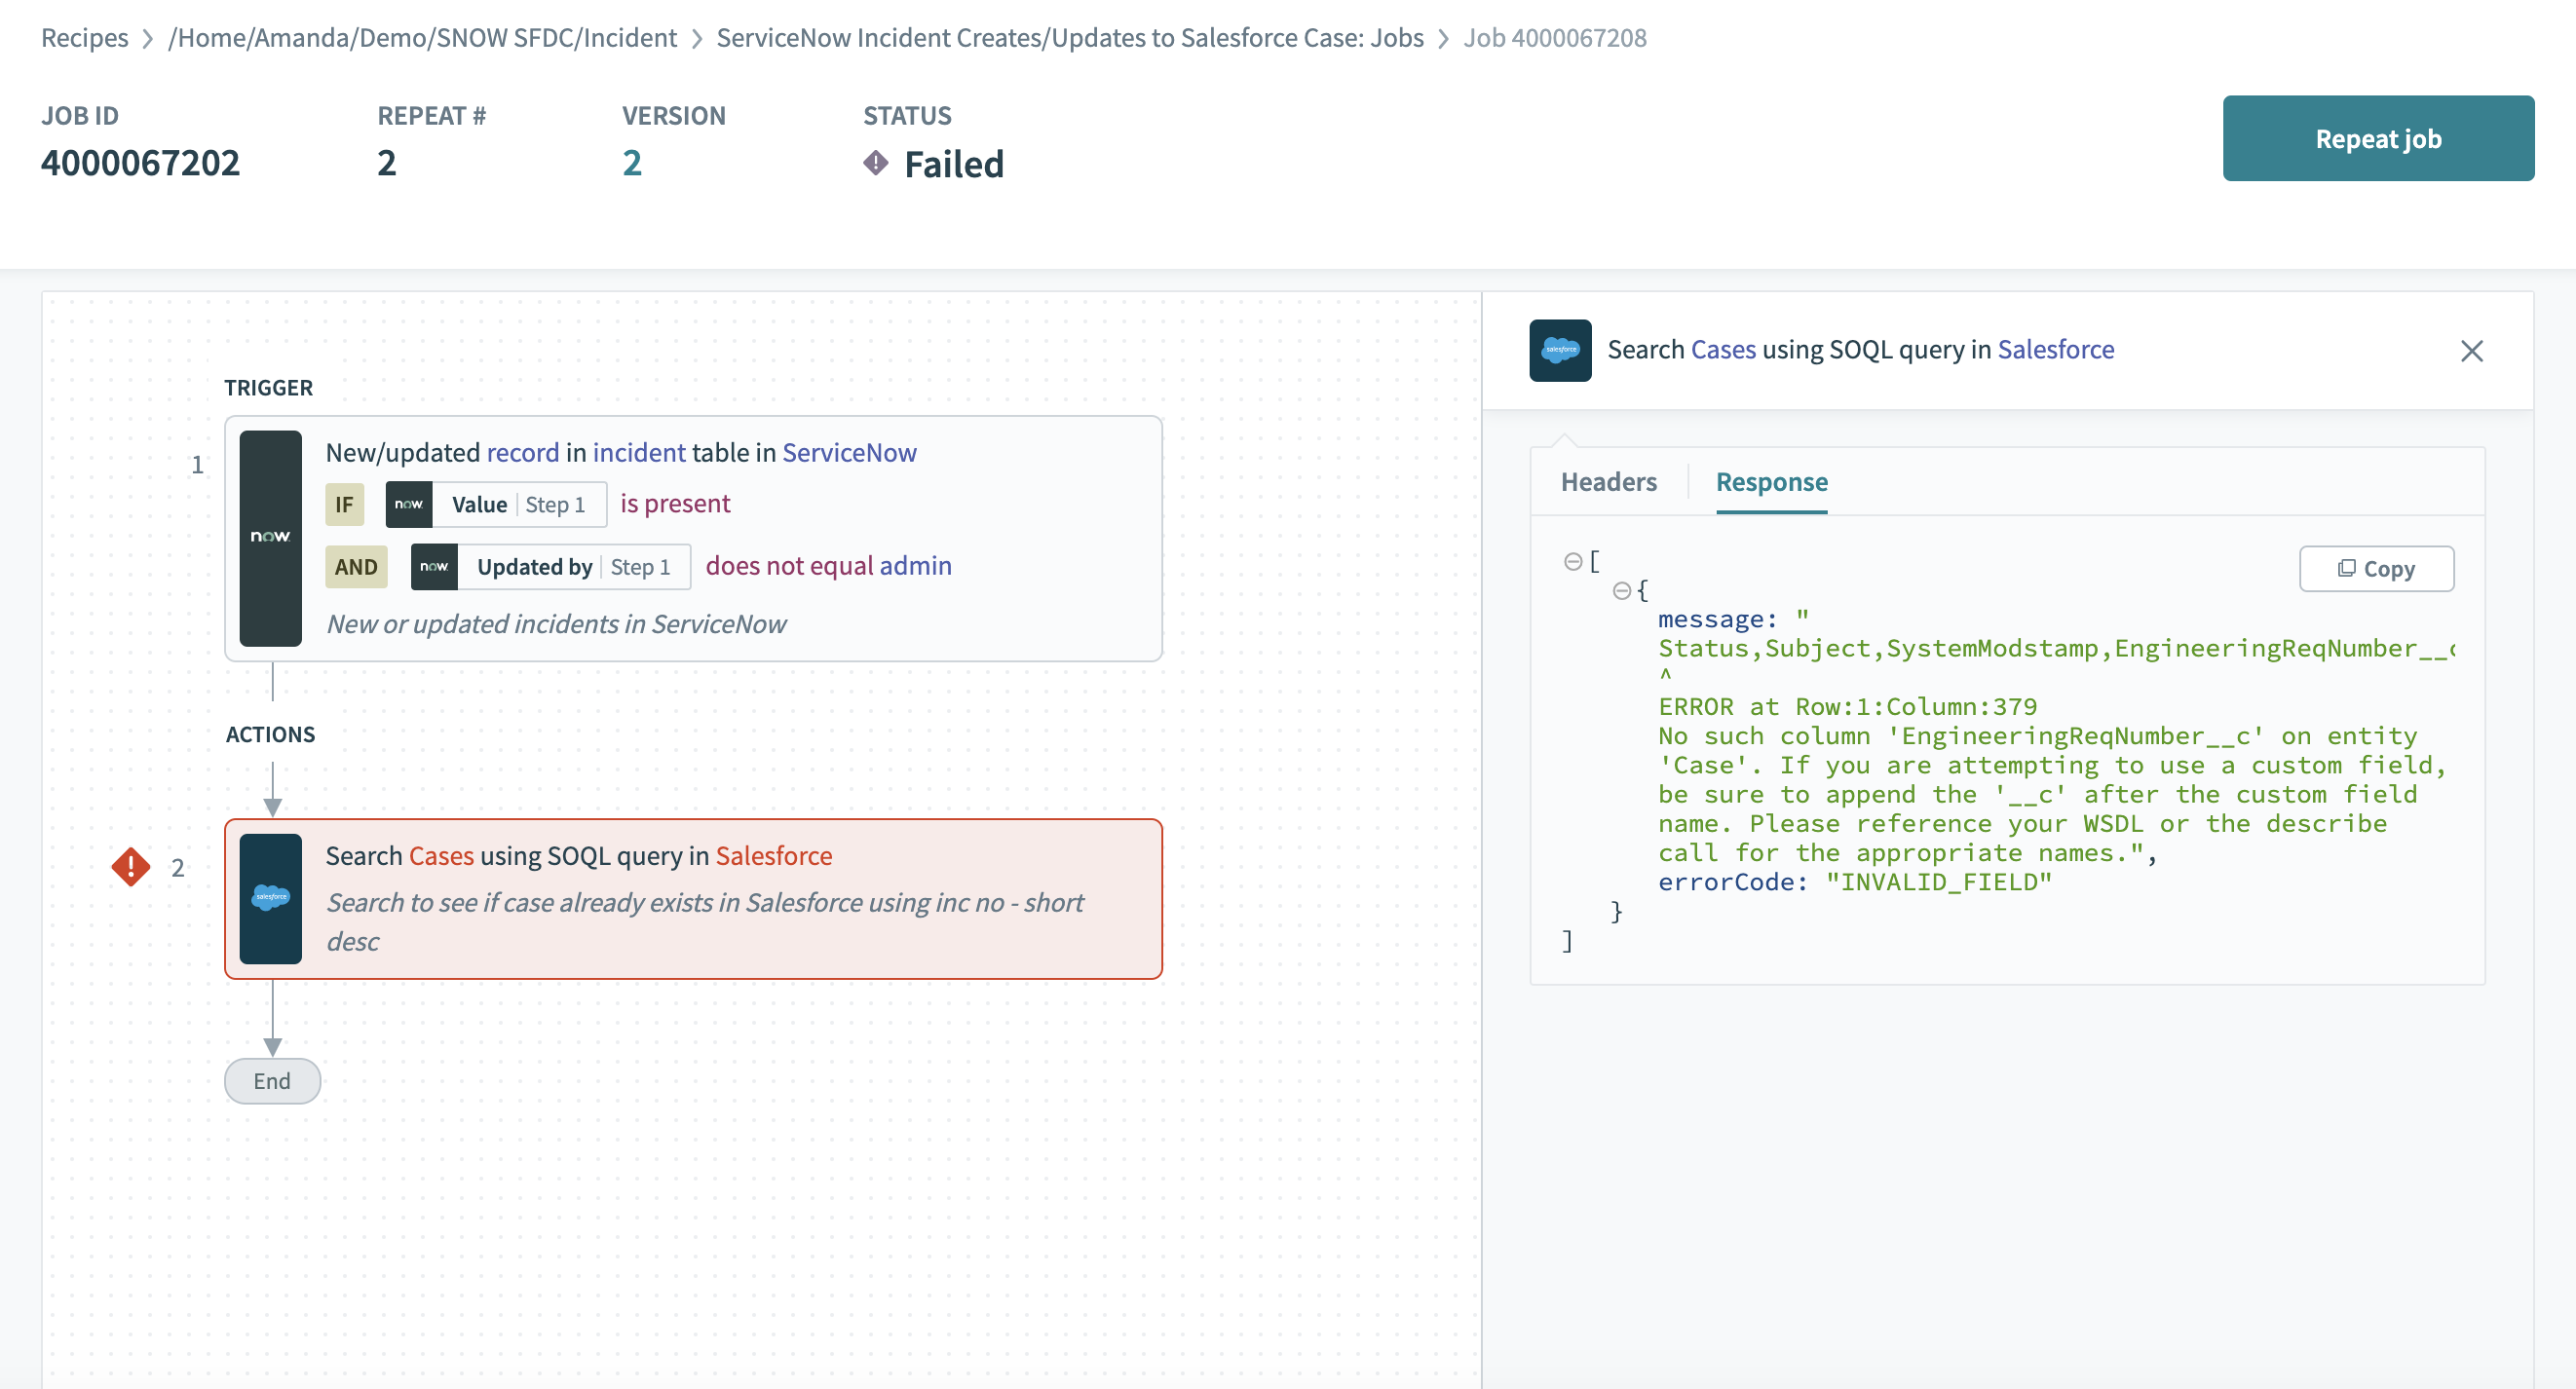
To see the response returned by the HTTP request, select Response tab.
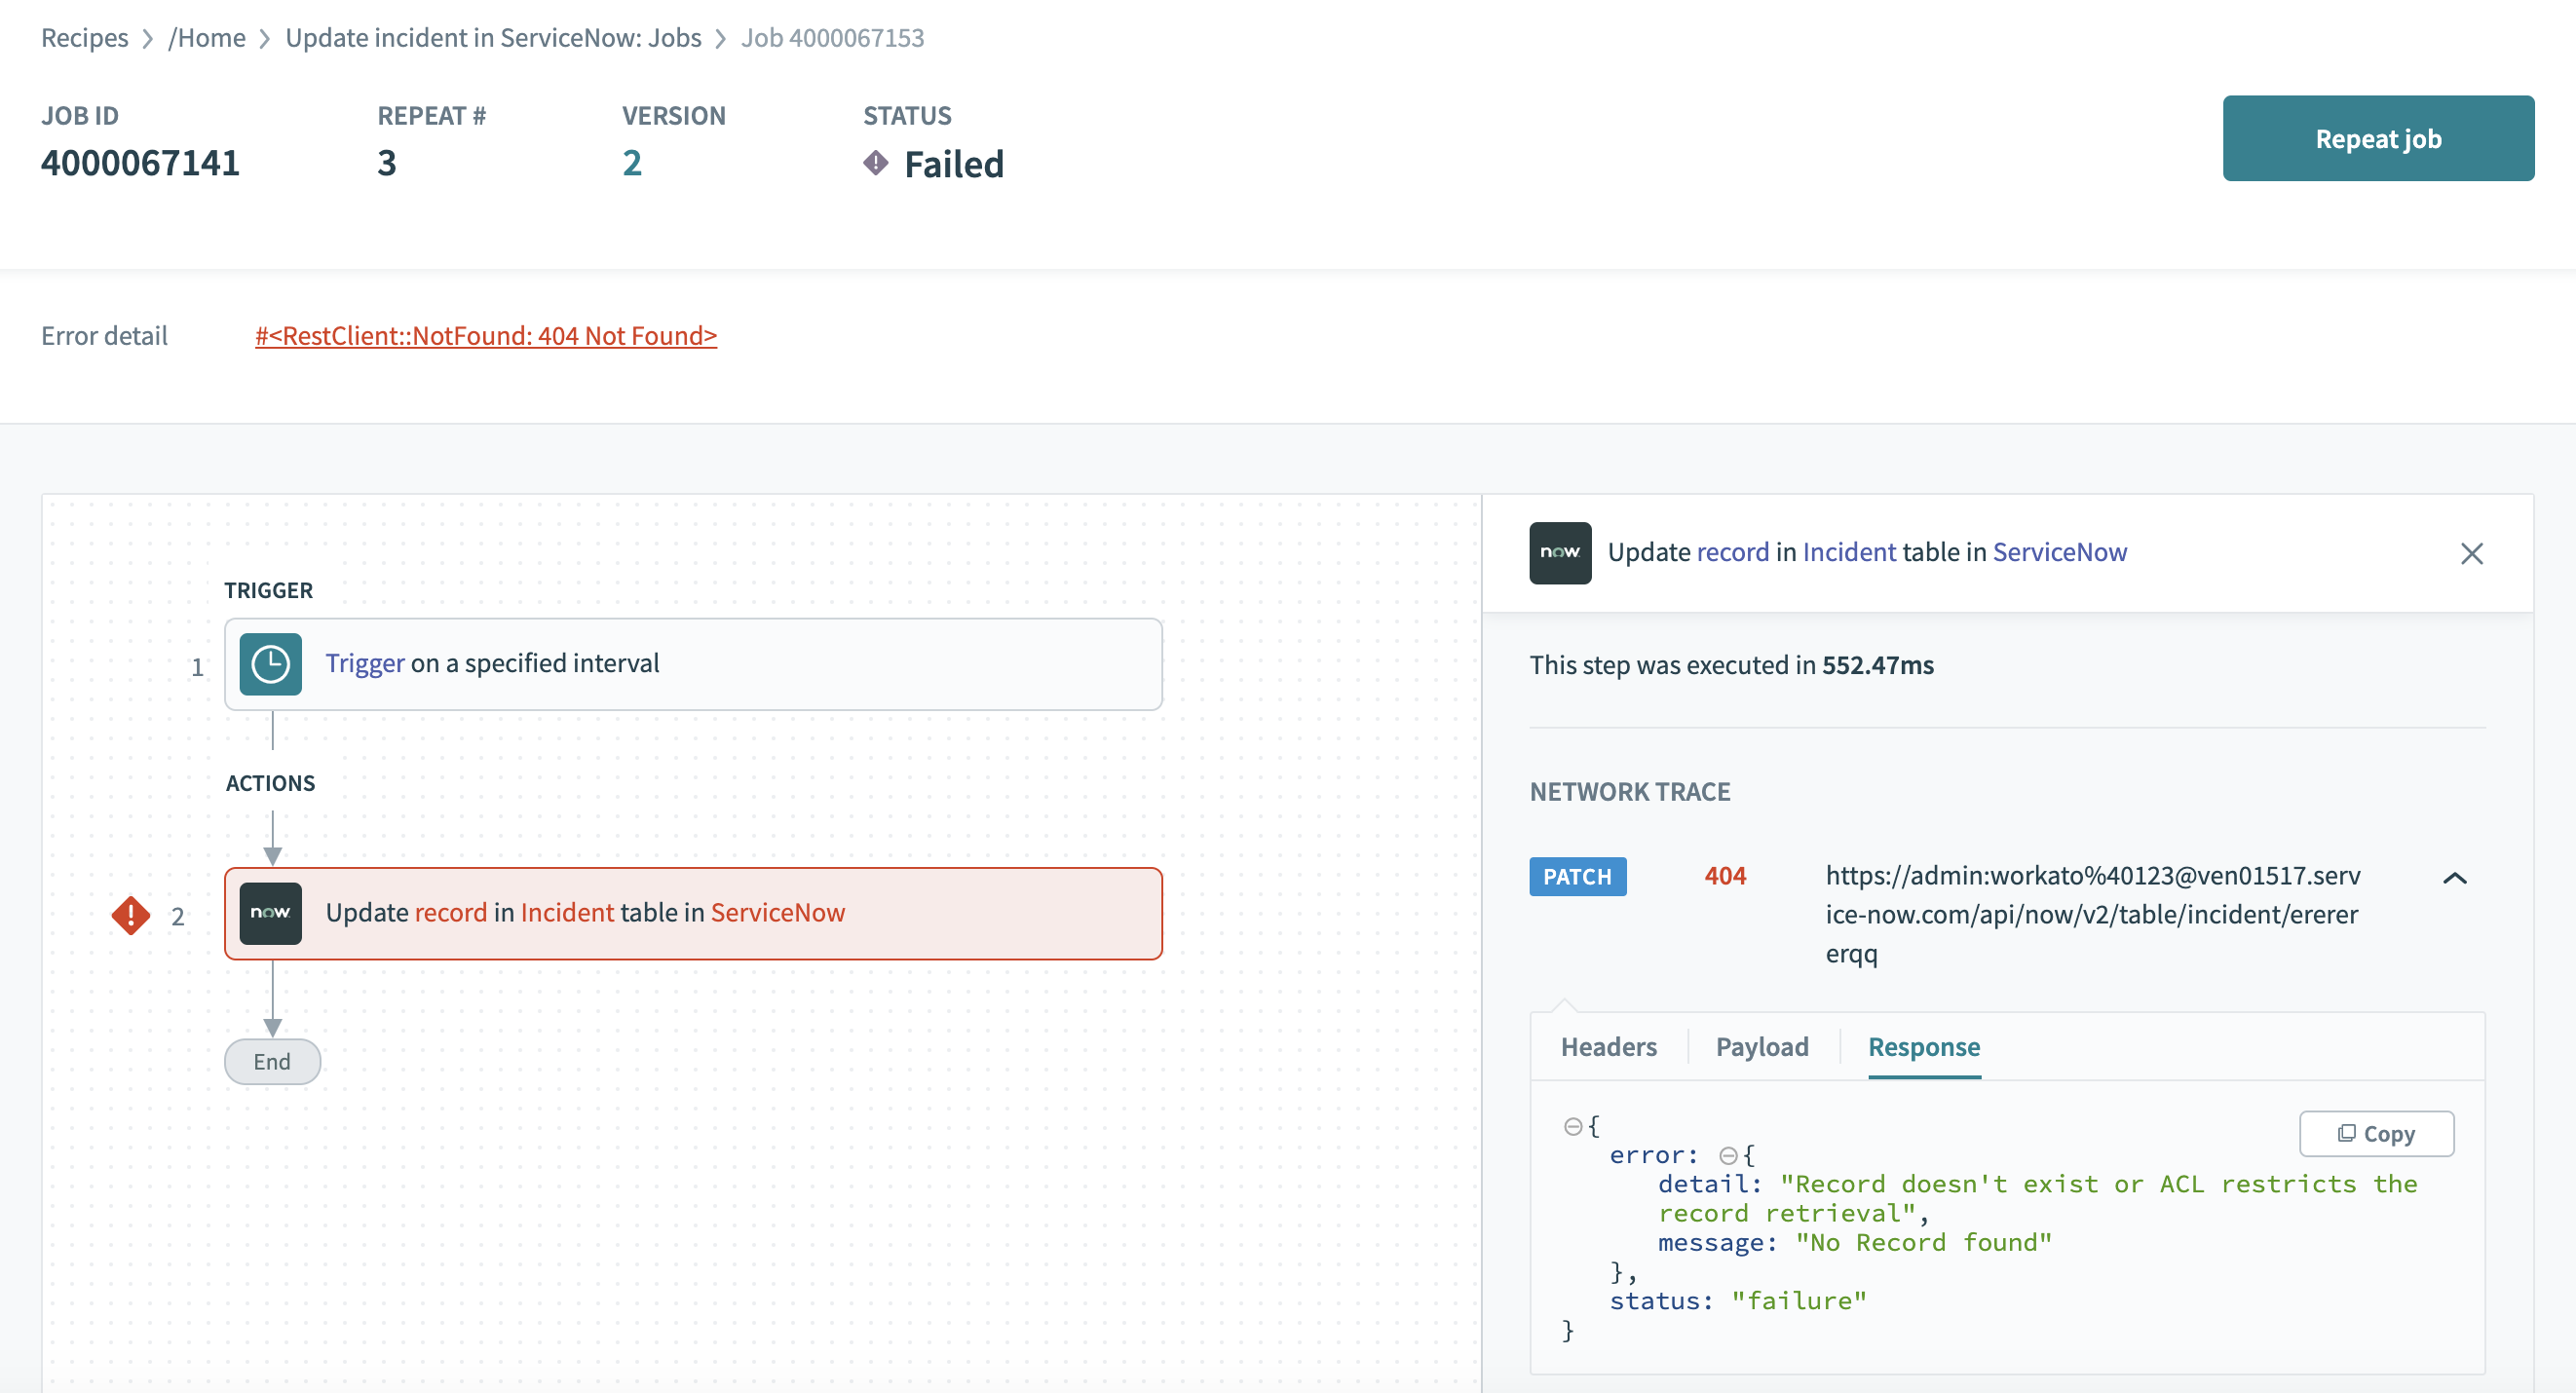 HTTP response received from the API
 HTTP response received from the API
 HTTP response received from the API
FAQ
How long is the tracing data available for?
Tracing data is available for 1 day from the time it was generated by repeating a job. If you want to access the data after one (1) day, you can repeat the job to generate the debug tracing.
List of connectors not supported
- Active Directory
- ADP
- Ariba
- AWS Cognito
- AWS SNS
- eTapestry
- Expensify
- FTP
- Google Drive
- JDBC
- JMS
- Kafka
- MSSQL
- MYSQL
- NetSuite
- On-prem files
- Oracle
- Oracle Fusion
- Redshift
- Salesforce Marketing Cloud
- SFTP
- SMS
- Snowflake
- SOAP
Last updated: