API Platform dashboard
The API platform dashboard allows owners of the API platform to visualize real-time data pertaining to the endpoints and API collections at a glance.
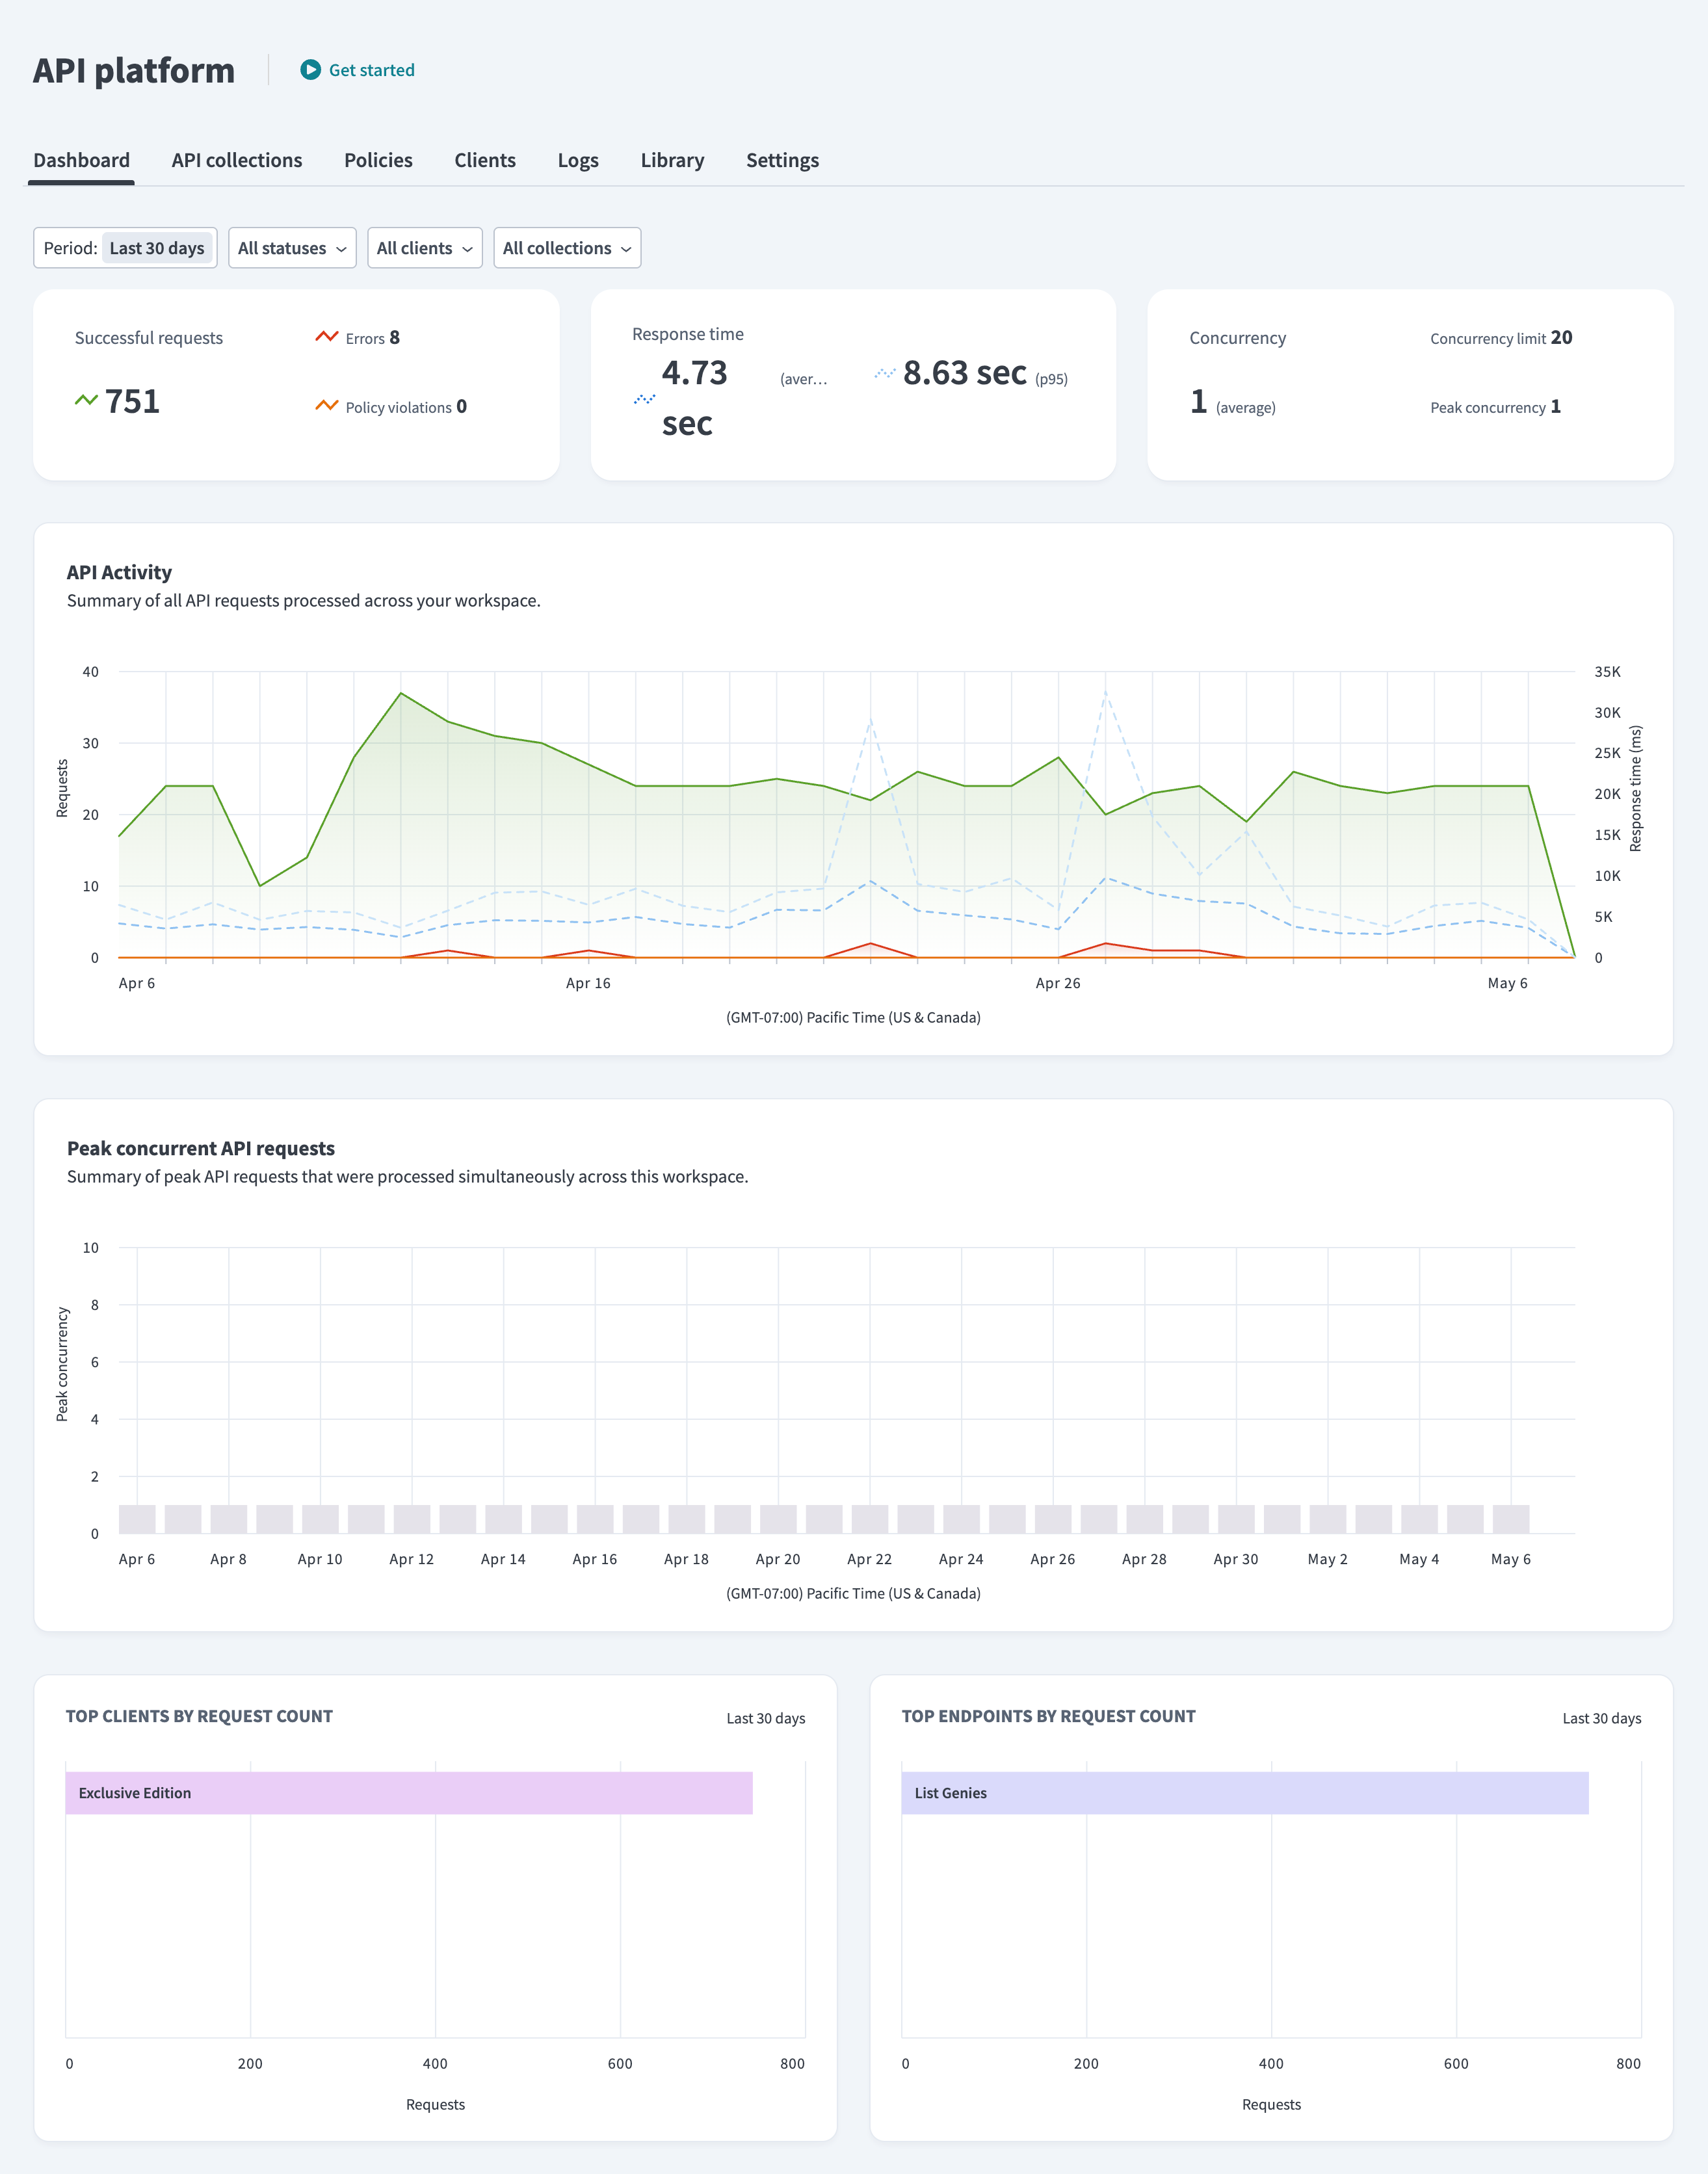 API dashboard tab
Monitor the performance of your API platform as a whole, or get granular data about a specific endpoint collection or requesting customer.
Successful request and Errors provide a big picture view of the health of your API endpoints.
Use the Policy violations metric to identify key clients or collections that produce abnormal API calls. See here for more information on API Access Policies.
Filters
Use filter parameters to adjust the API dashboard view. The dashboard shows data for the last 30 days, all clients, and all collections by default. You can change the filters to find your preferred dashboard view. Filters reset after you leave the page.
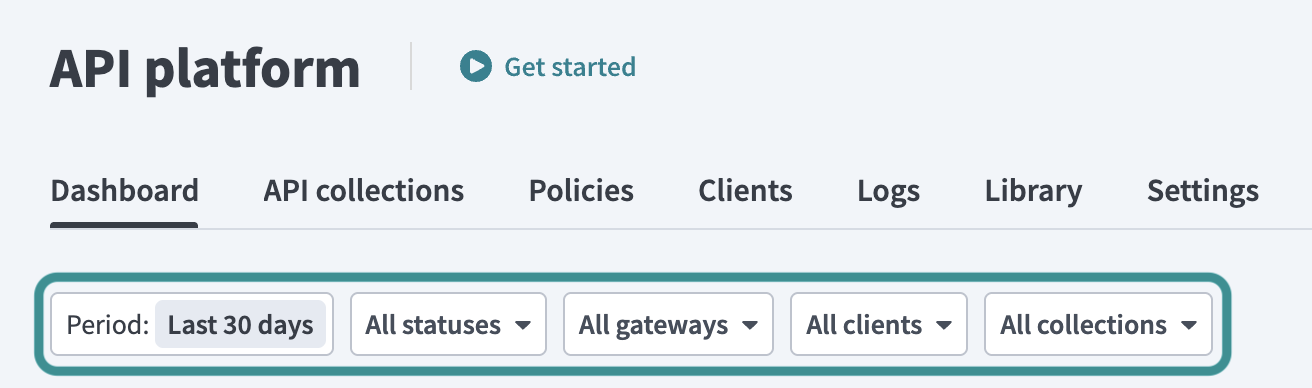 API dashboard filters
You can filter dashboard results by the following:
- Period: Choose a time window such as the last 30 days or a custom range.
- Status: Filter based on API request status.
- Clients: View metrics for one or more API clients.
- Gateway: Select either Cloud or Edge to filter traffic routed through specific gateways. The Collections filter shows only API proxy collections deployed to edge gateways when you select Edge.
- Collections: Narrow results by specific API collections or endpoints.
API Activity
The API Activity graph summarizes all API requests processed. This visualization helps identify trends, spikes, or drops in API usage, highlighting periods of high activity or potential issues with your API.
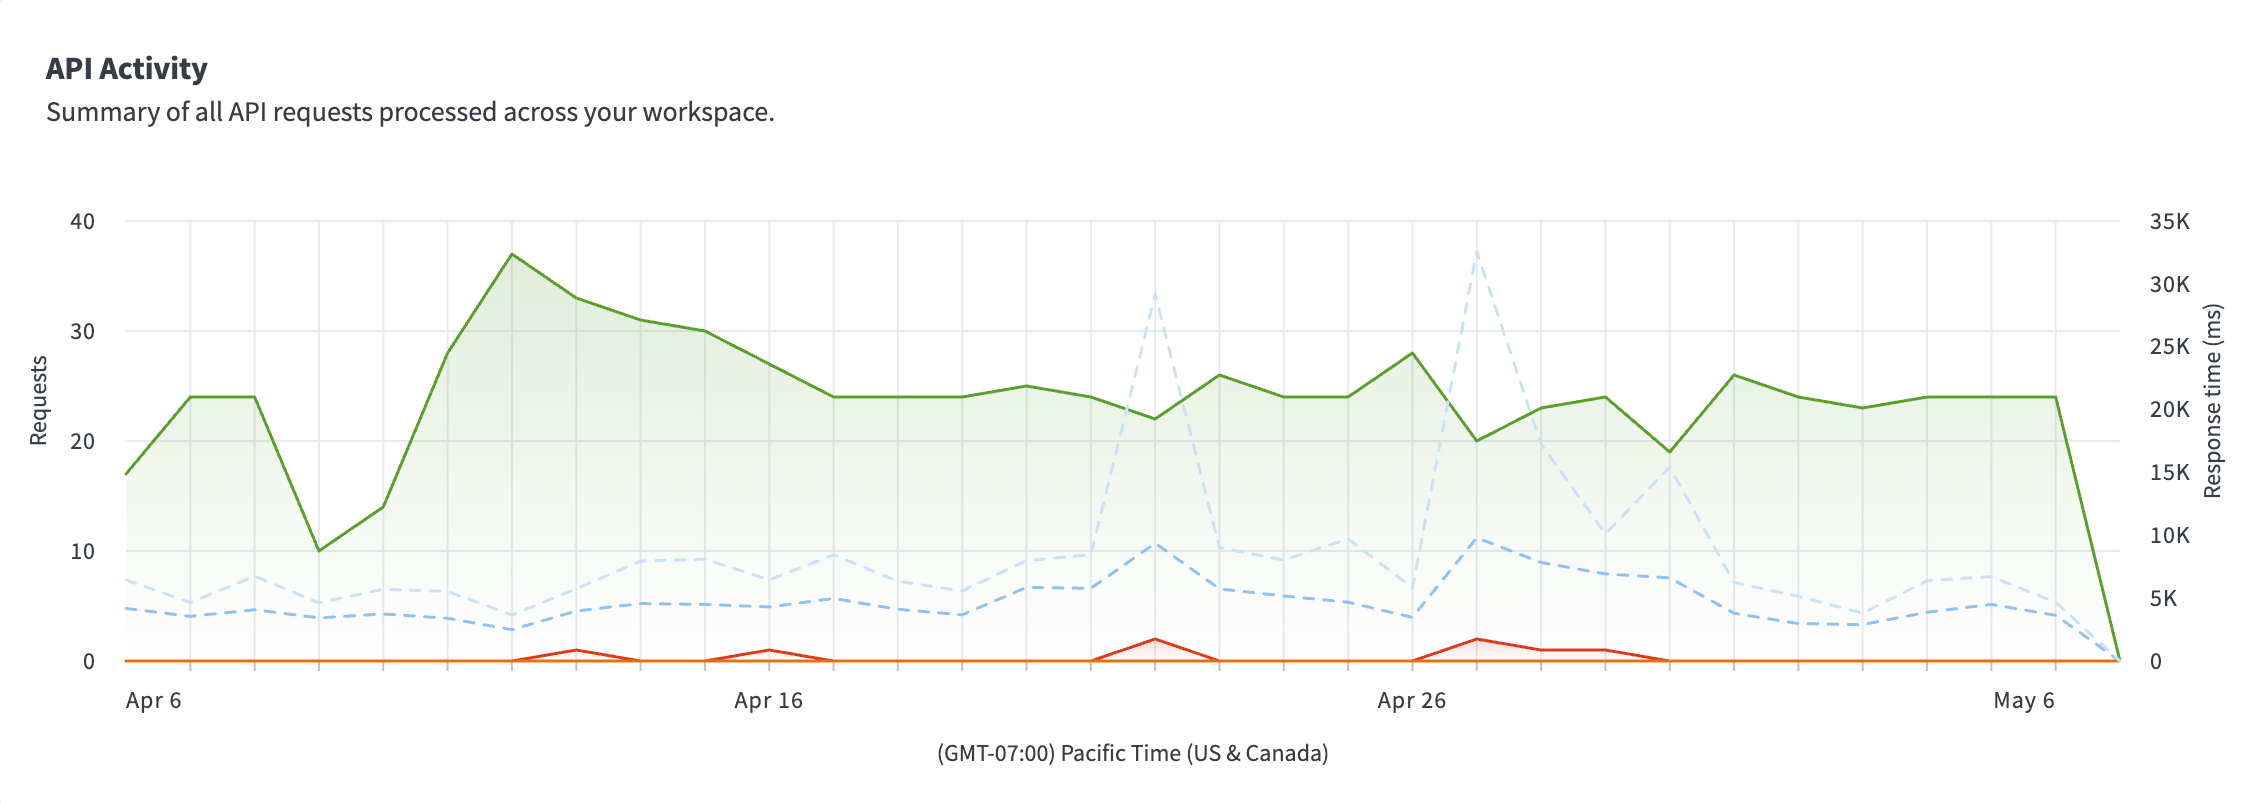 API Activity
Peak concurrent API requests
The Peak concurrent API requests graph summarizes the peak number of API requests that were processed simultaneously. The height of the bars indicates the number of concurrent requests at the highest points of activity.
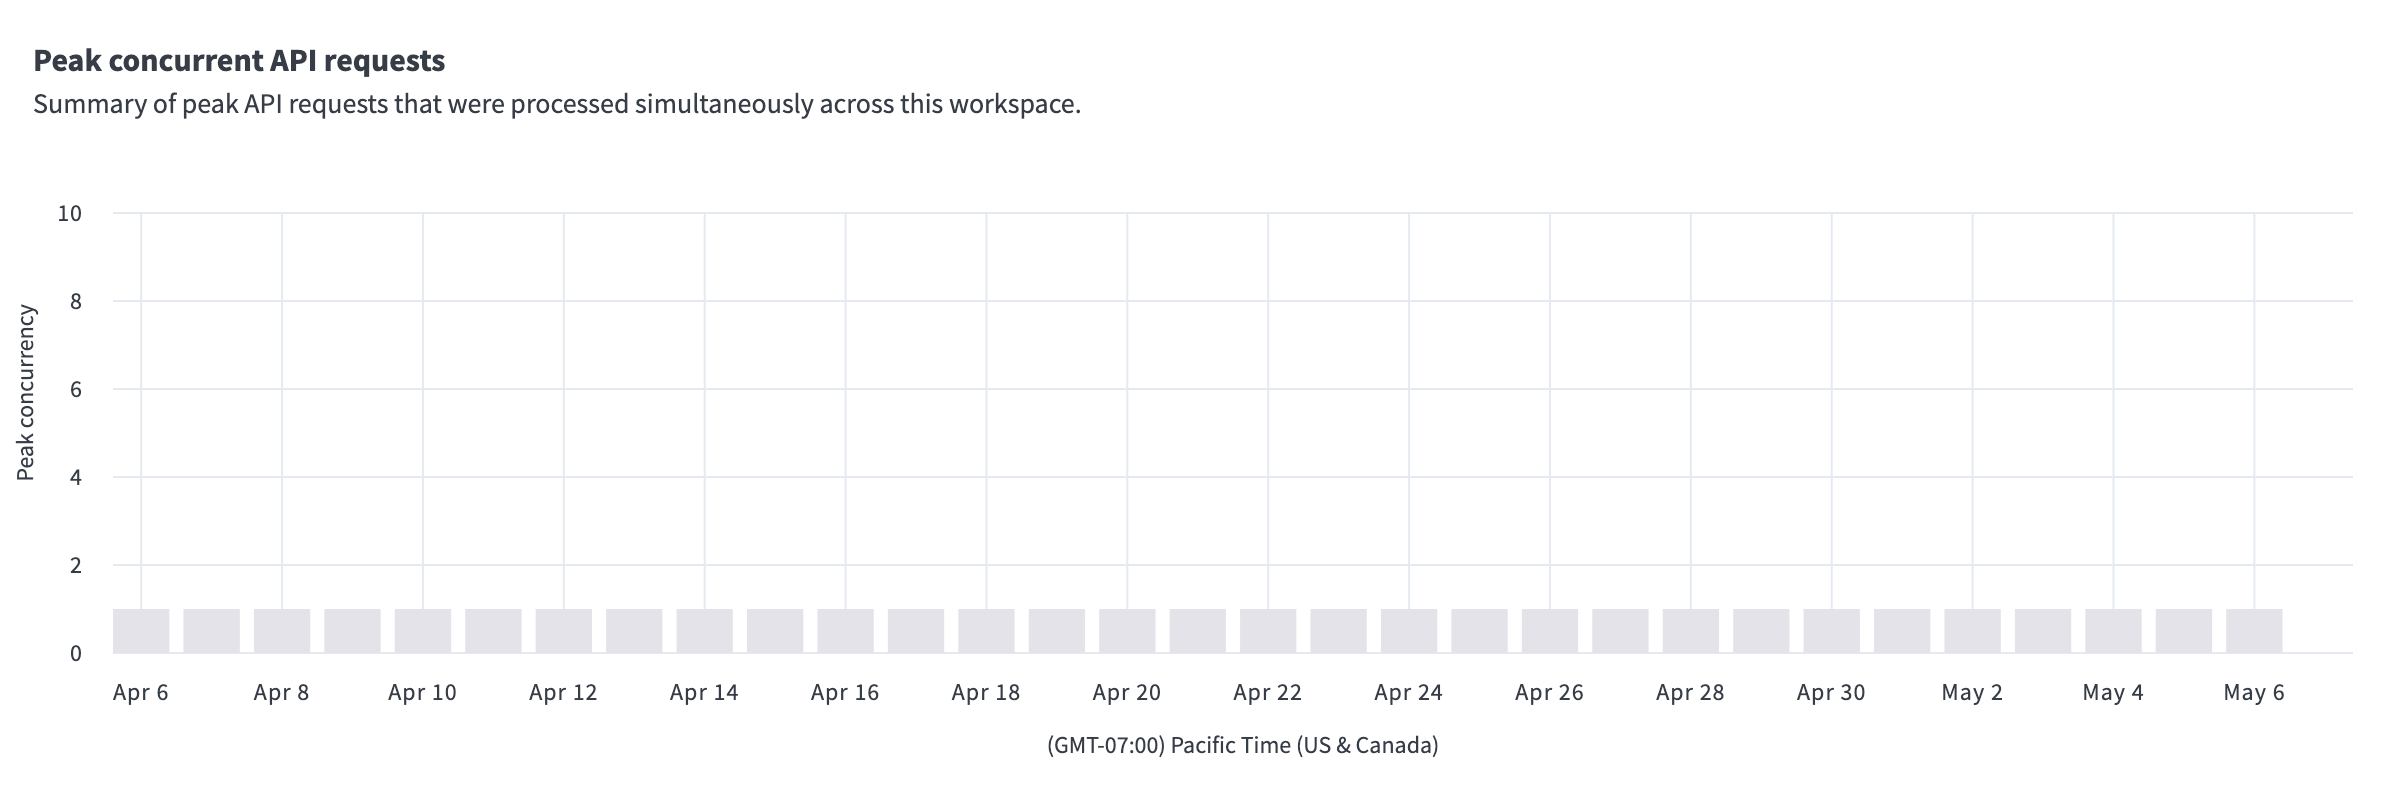 Peak concurrent API requests
This section enables you to understand the API load at any given time. It helps identify peak usage times, which can be important for capacity planning and ensuring the infrastructure can handle high loads without performance degradation.
Top request count
The Top clients by request count and Top endpoints by request count graphs visualize your most active API consumers and most popular endpoints. This display changes according to your selected filters.
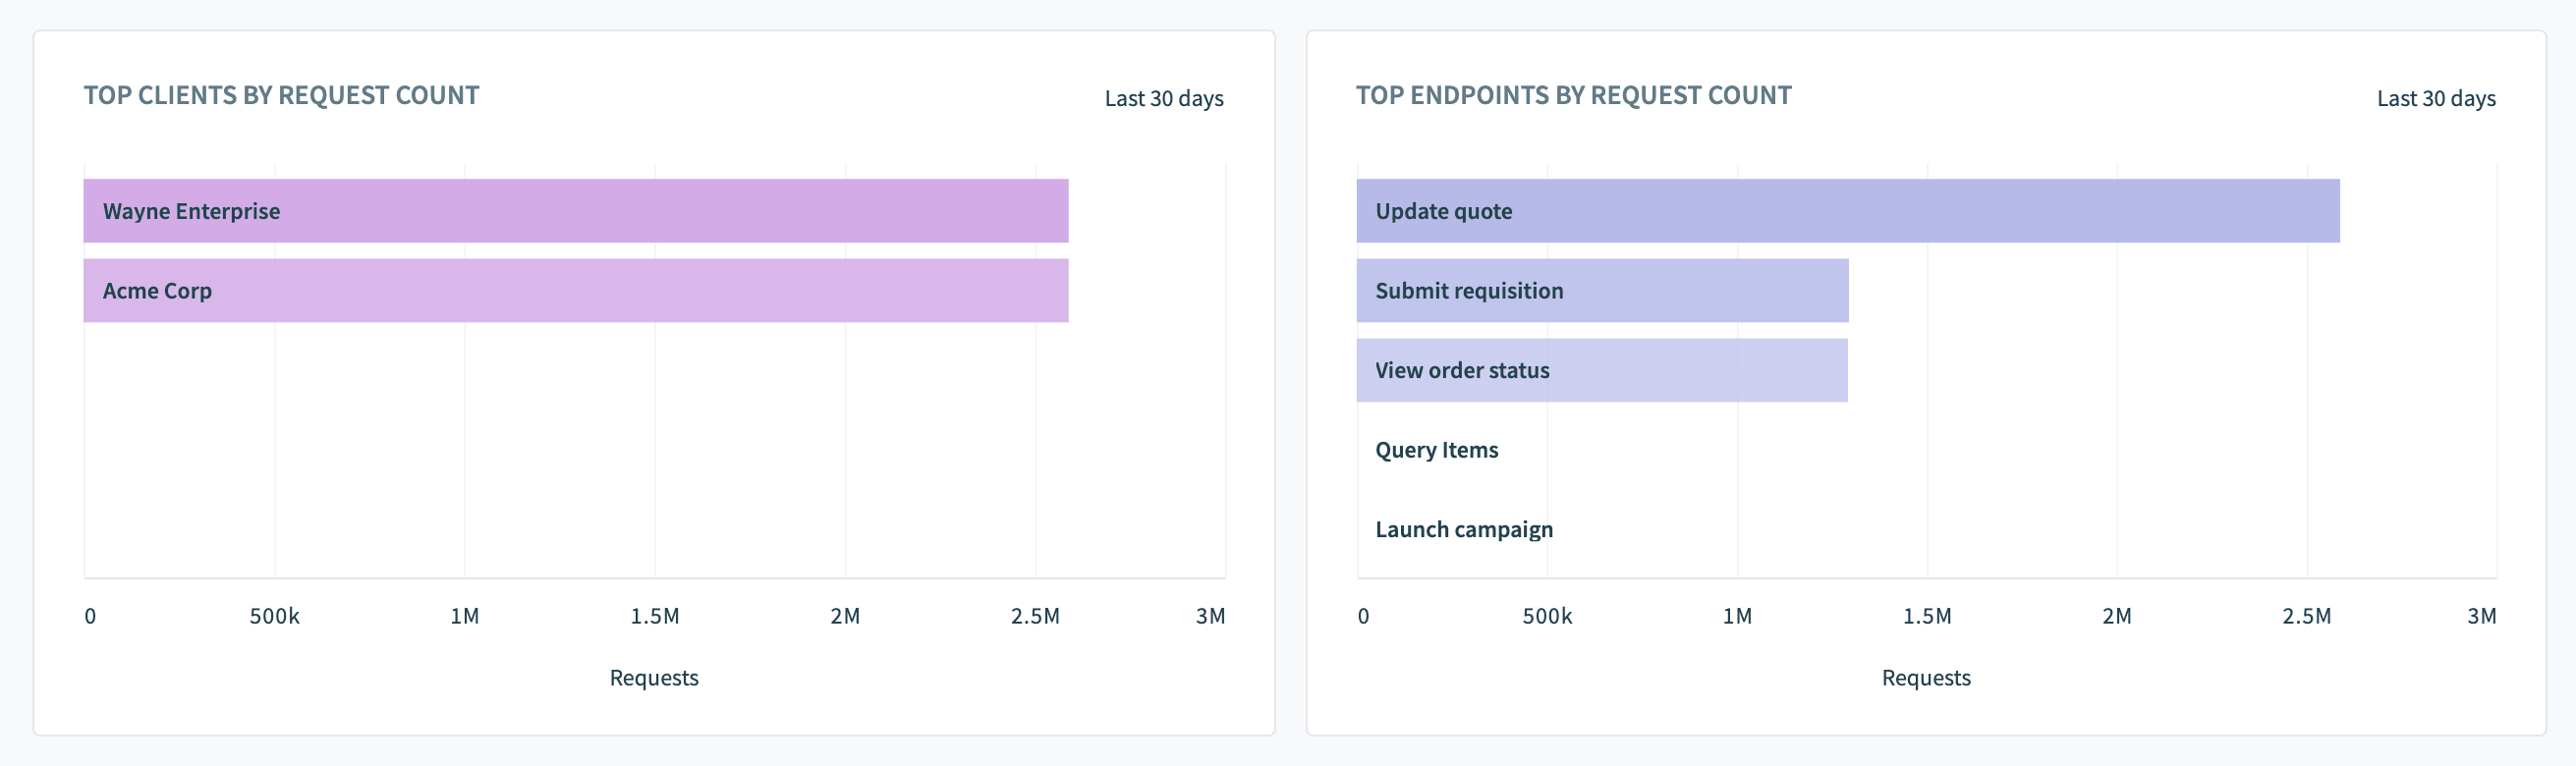 Top request count
To see details of each endpoint request, navigate to the Logs tab.
Last updated: