Operations hub dashboard
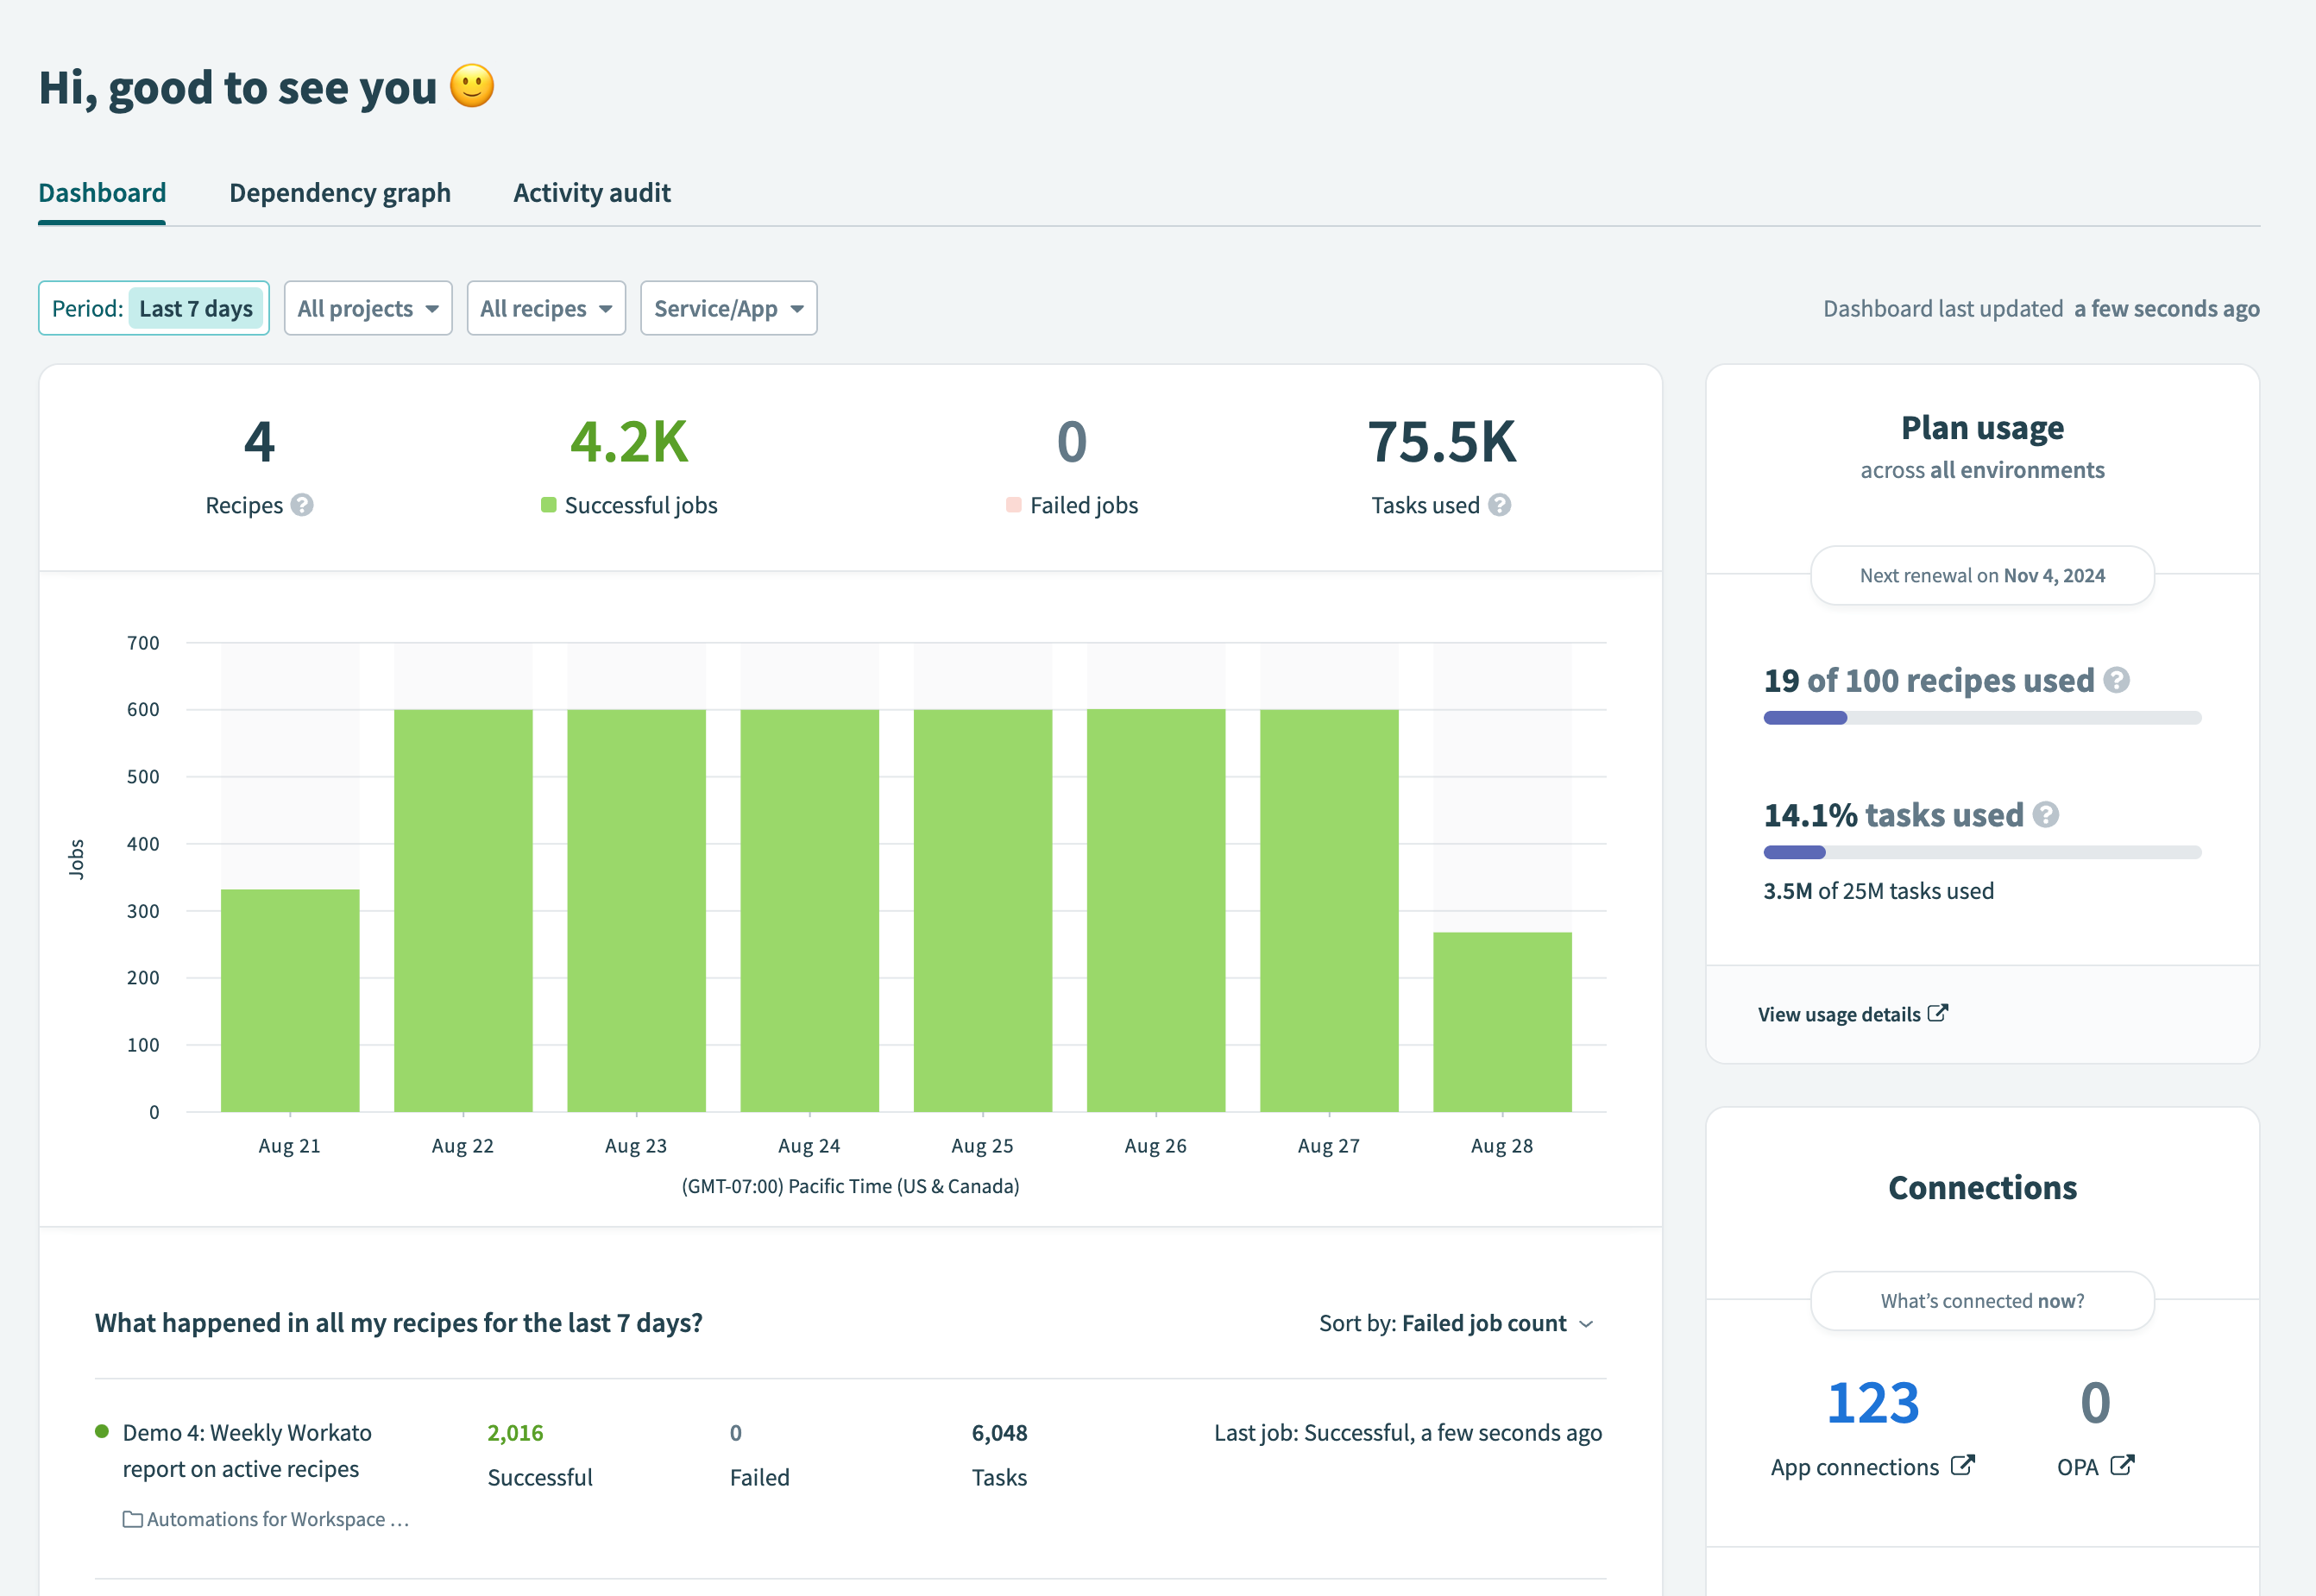
The Operations hub dashboard provides a real-time overview of your Workato recipes and connections. It offers key insights, analytics, and actionable items to help you resolve issues efficiently.
Use the Operations Hub dashboard to tie recipe jobs directly to business metrics. This allows you to track vital data such as the daily addition of new customers to a CRM system or the monthly processing of invoices. This visibility into trends over time helps you identify outliers that could impact business operations.
Dashboard sections
 Operations hub dashboard
The Operations hub dashboard is organized into the following sections:
Jobs graph
Provides an overview of recipe health, offering a high-level snapshot of performance.
Recipe details table
Offers a detailed breakdown of individual recipes with sorting options for deeper analysis.
Connections
Tracks changes made to connections over the last seven days for quick reference.
Plan usage*
Displays billing usage statistics to help monitor plan limits and costs. This section is visible to customers on legacy pricing plans only. Learn more about plan usage.
Each section is designed to deliver key operational metrics, giving you a comprehensive 360° view of the recipes in your workspace.
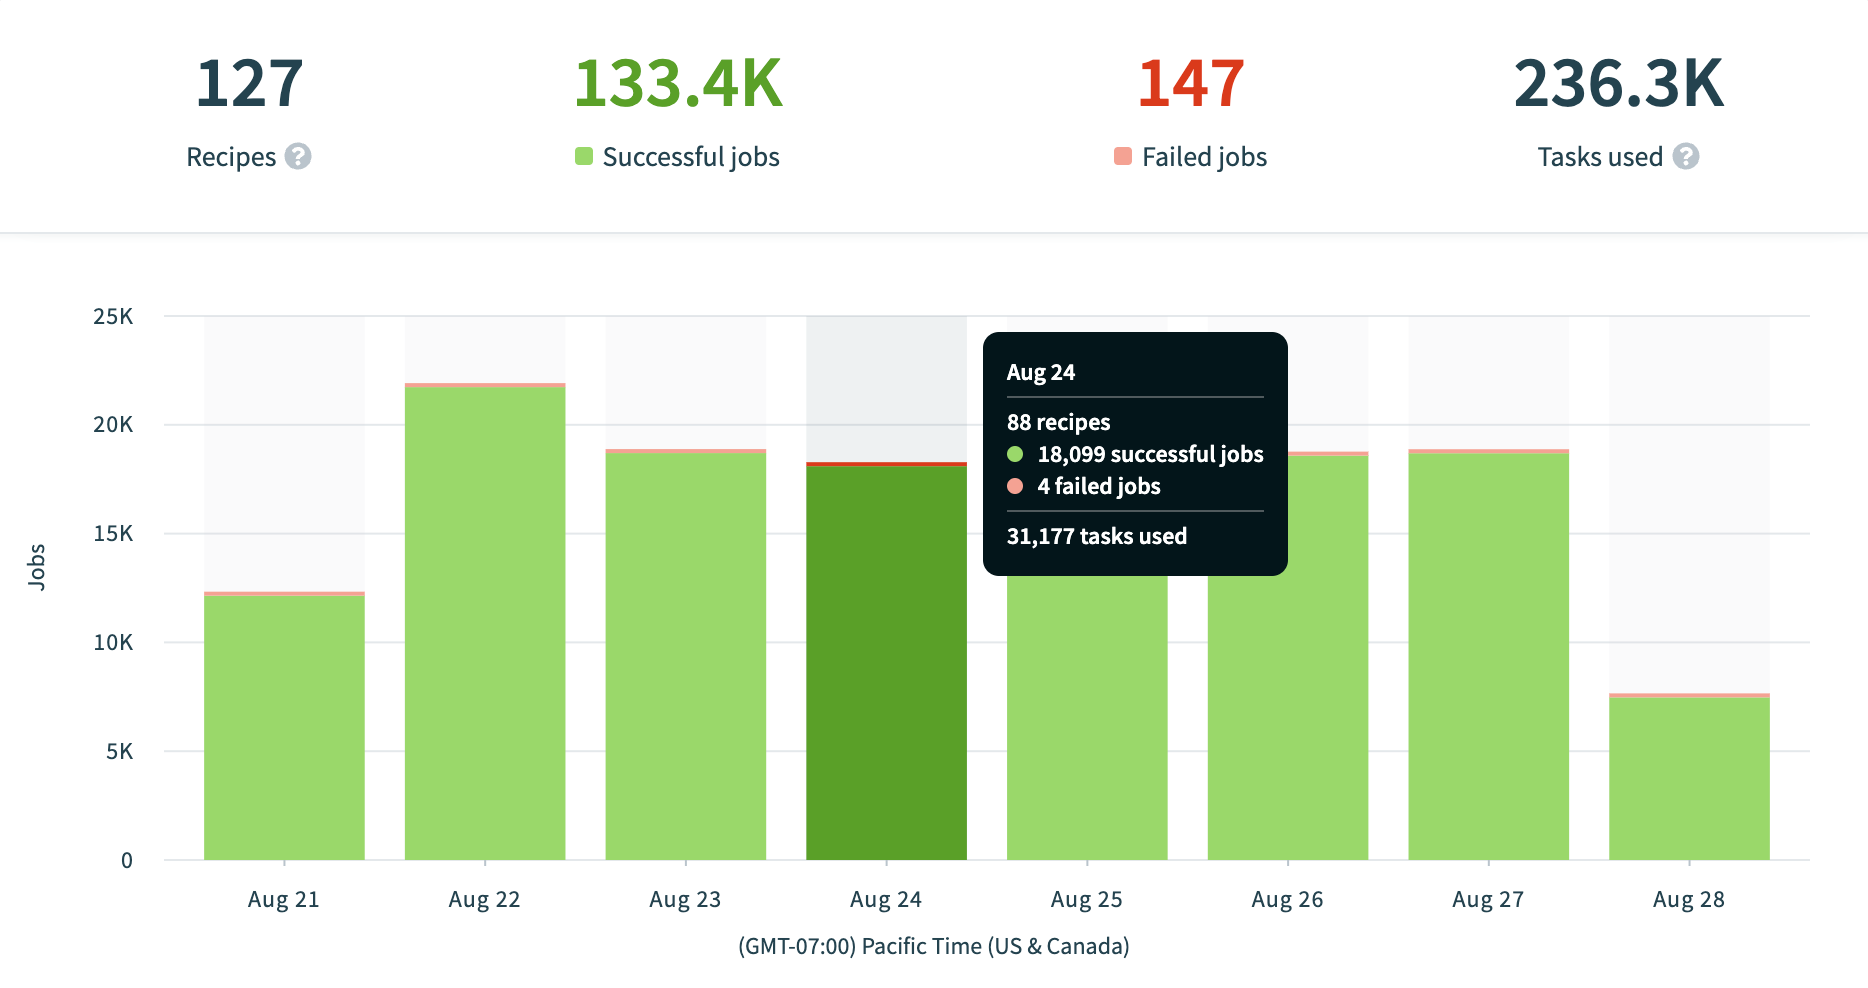
Jobs graph
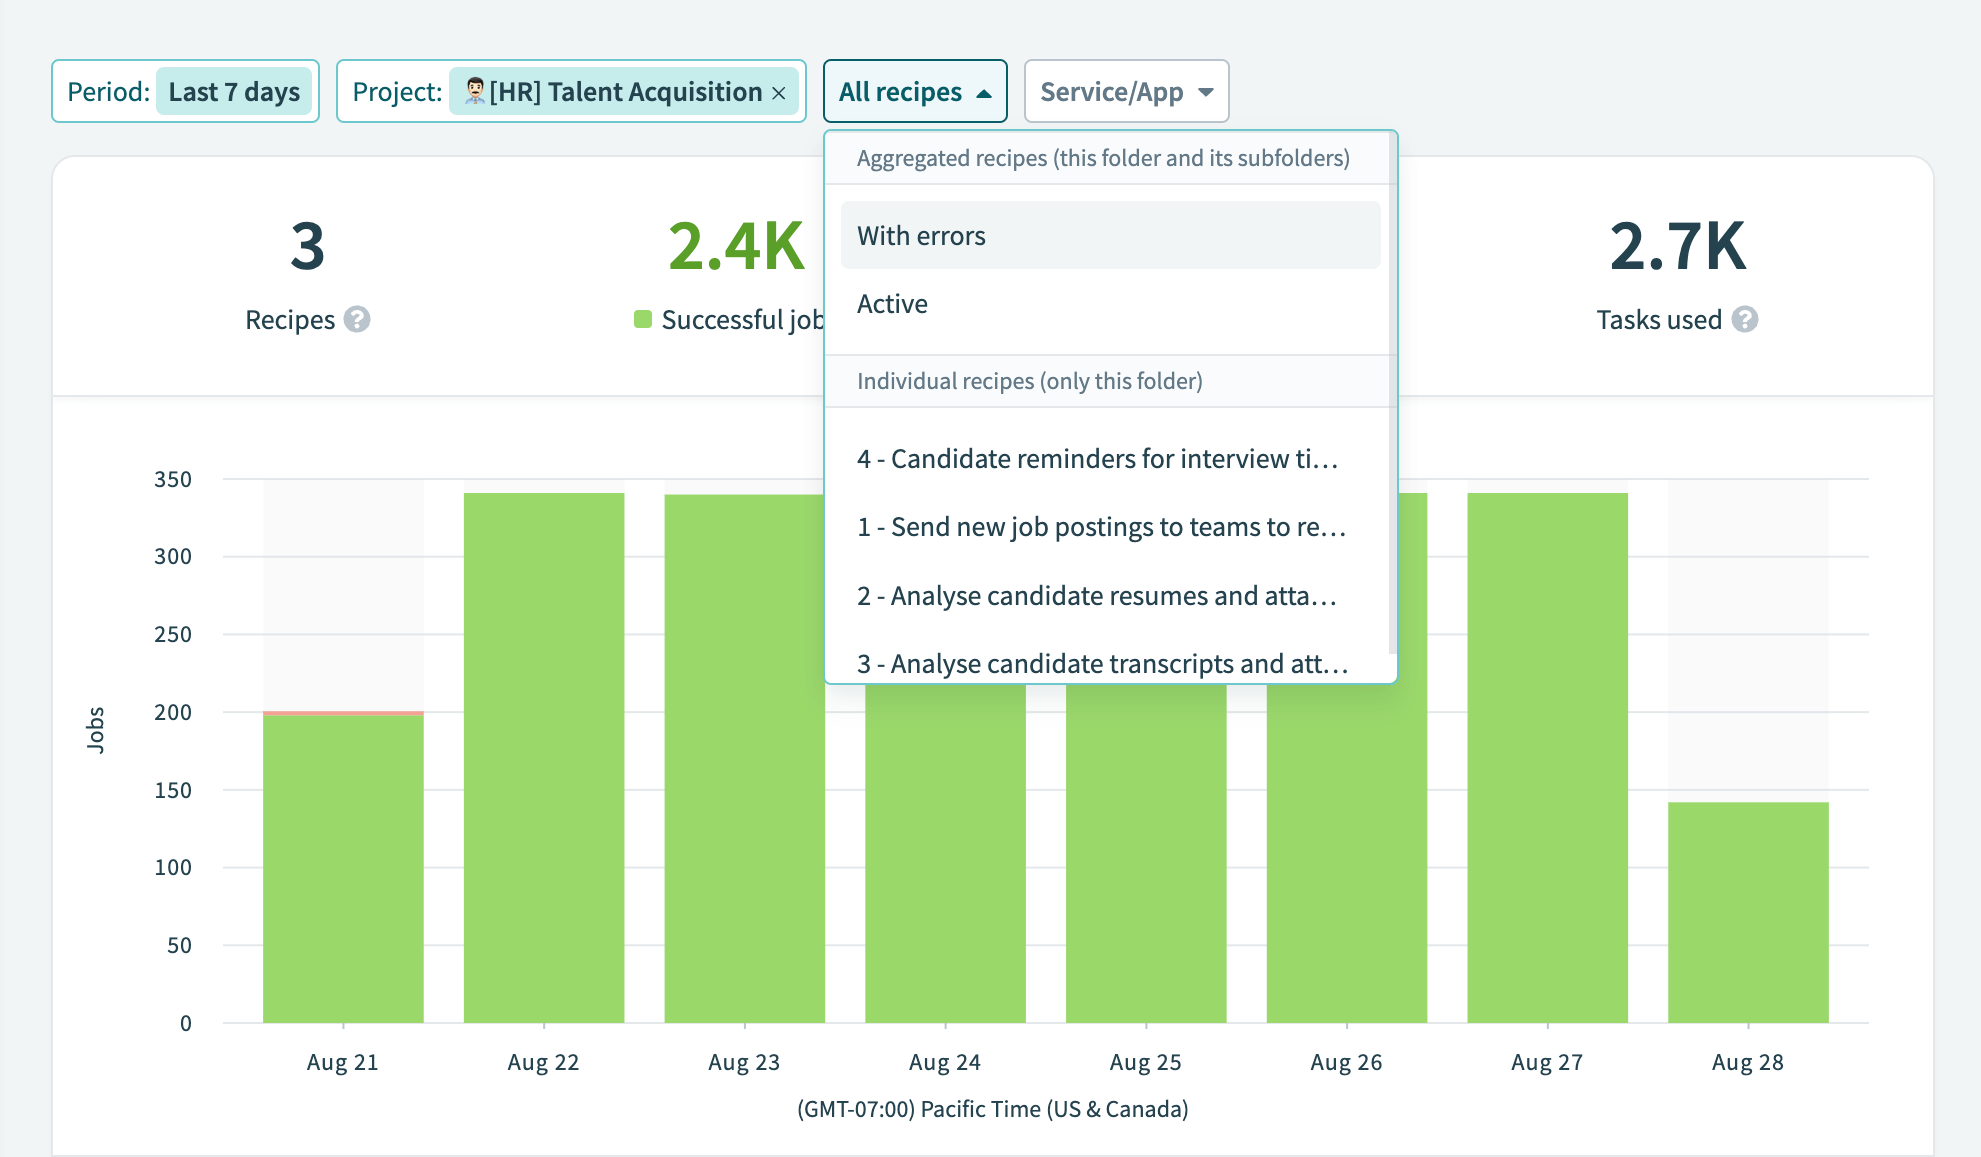
The Jobs graph provides an overview of recipe health in a specified timeframe. This snapshot is dynamic and changes according to the filters you select. Use the filter tools to modify the graph to show information about important folders and recipes.
 Jobs graph
Filters
The Operations hub dashboard allows you to customize your filters by:
- Period
- Choose from Last hour, Last 24 hours, Last 7 days, Last 30 days, or set a Custom range. The default is Last 7 days.
- Projects and folders
- Search for and select a project or folder containing the recipes you plan to monitor. The default is All projects.
- Recipes
- Filter by recipes with errors or those actively running within the selected folder and its subfolders. Alternatively, choose a specific recipe from the folder.
- Service/App
- Select the services or apps you plan to monitor. You can filter by API recipes, scheduled recipes, real-time recipes, or by recipes that use a specific app connector.
- Tag
- Select one or more tags to filter recipes by their associated tags.
Select Custom range from the Period filter to define a custom date range. Enter the start and end dates in the MM/DD/YY format. You can use the calendar modal for convenience. There is no limit on the number of days you can select.
Interact with the graph
Hover over any bar to view the number of successful and failed jobs and the total tasks completed during the specific time.
 Interact with the jobs graph
Click on the bar to view a breakdown for a specific time period. The recipe details table updates with recipes running during the selected time based on any additional filters you've applied.
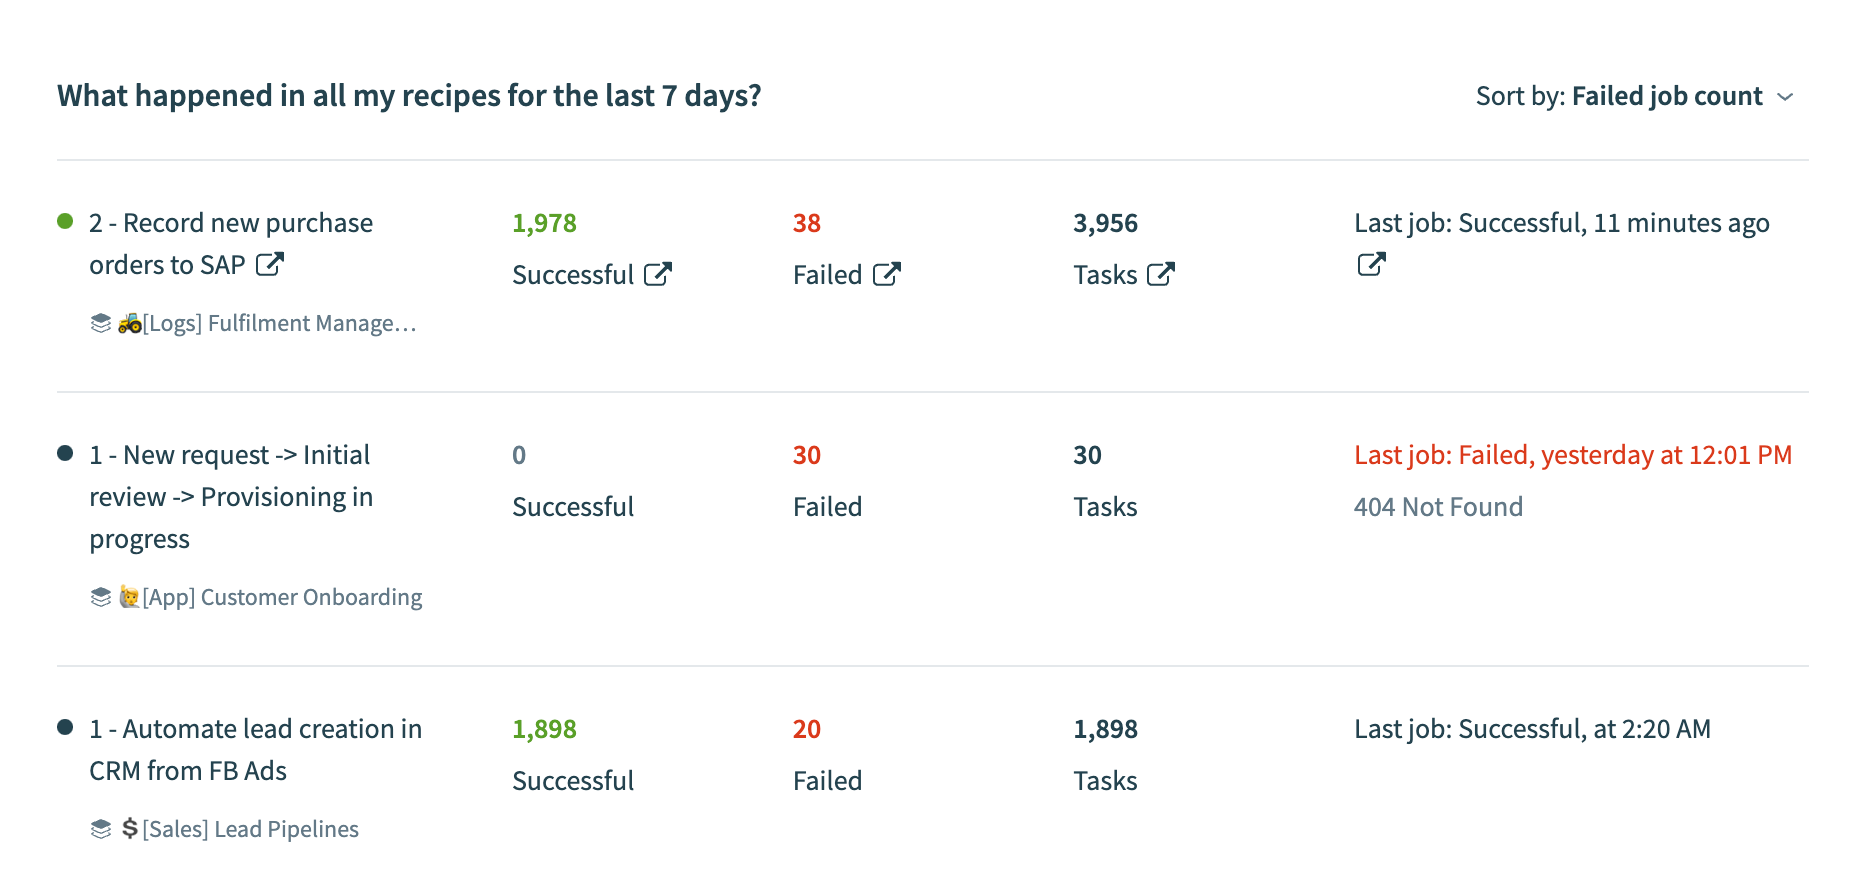
Recipe details table
The Recipe details table provides a deeper analysis of the jobs graph. It displays key information, including the number of successful jobs, failed jobs, tasks used, and a description of the most recent job.
 Recipe details table
Click on any cell to learn more. For example, select 38 Failed under Failed jobs to visit the corresponding jobs tab on the recipe page.
If you've applied date and time filters, the jobs are filtered automatically when redirected to this page.
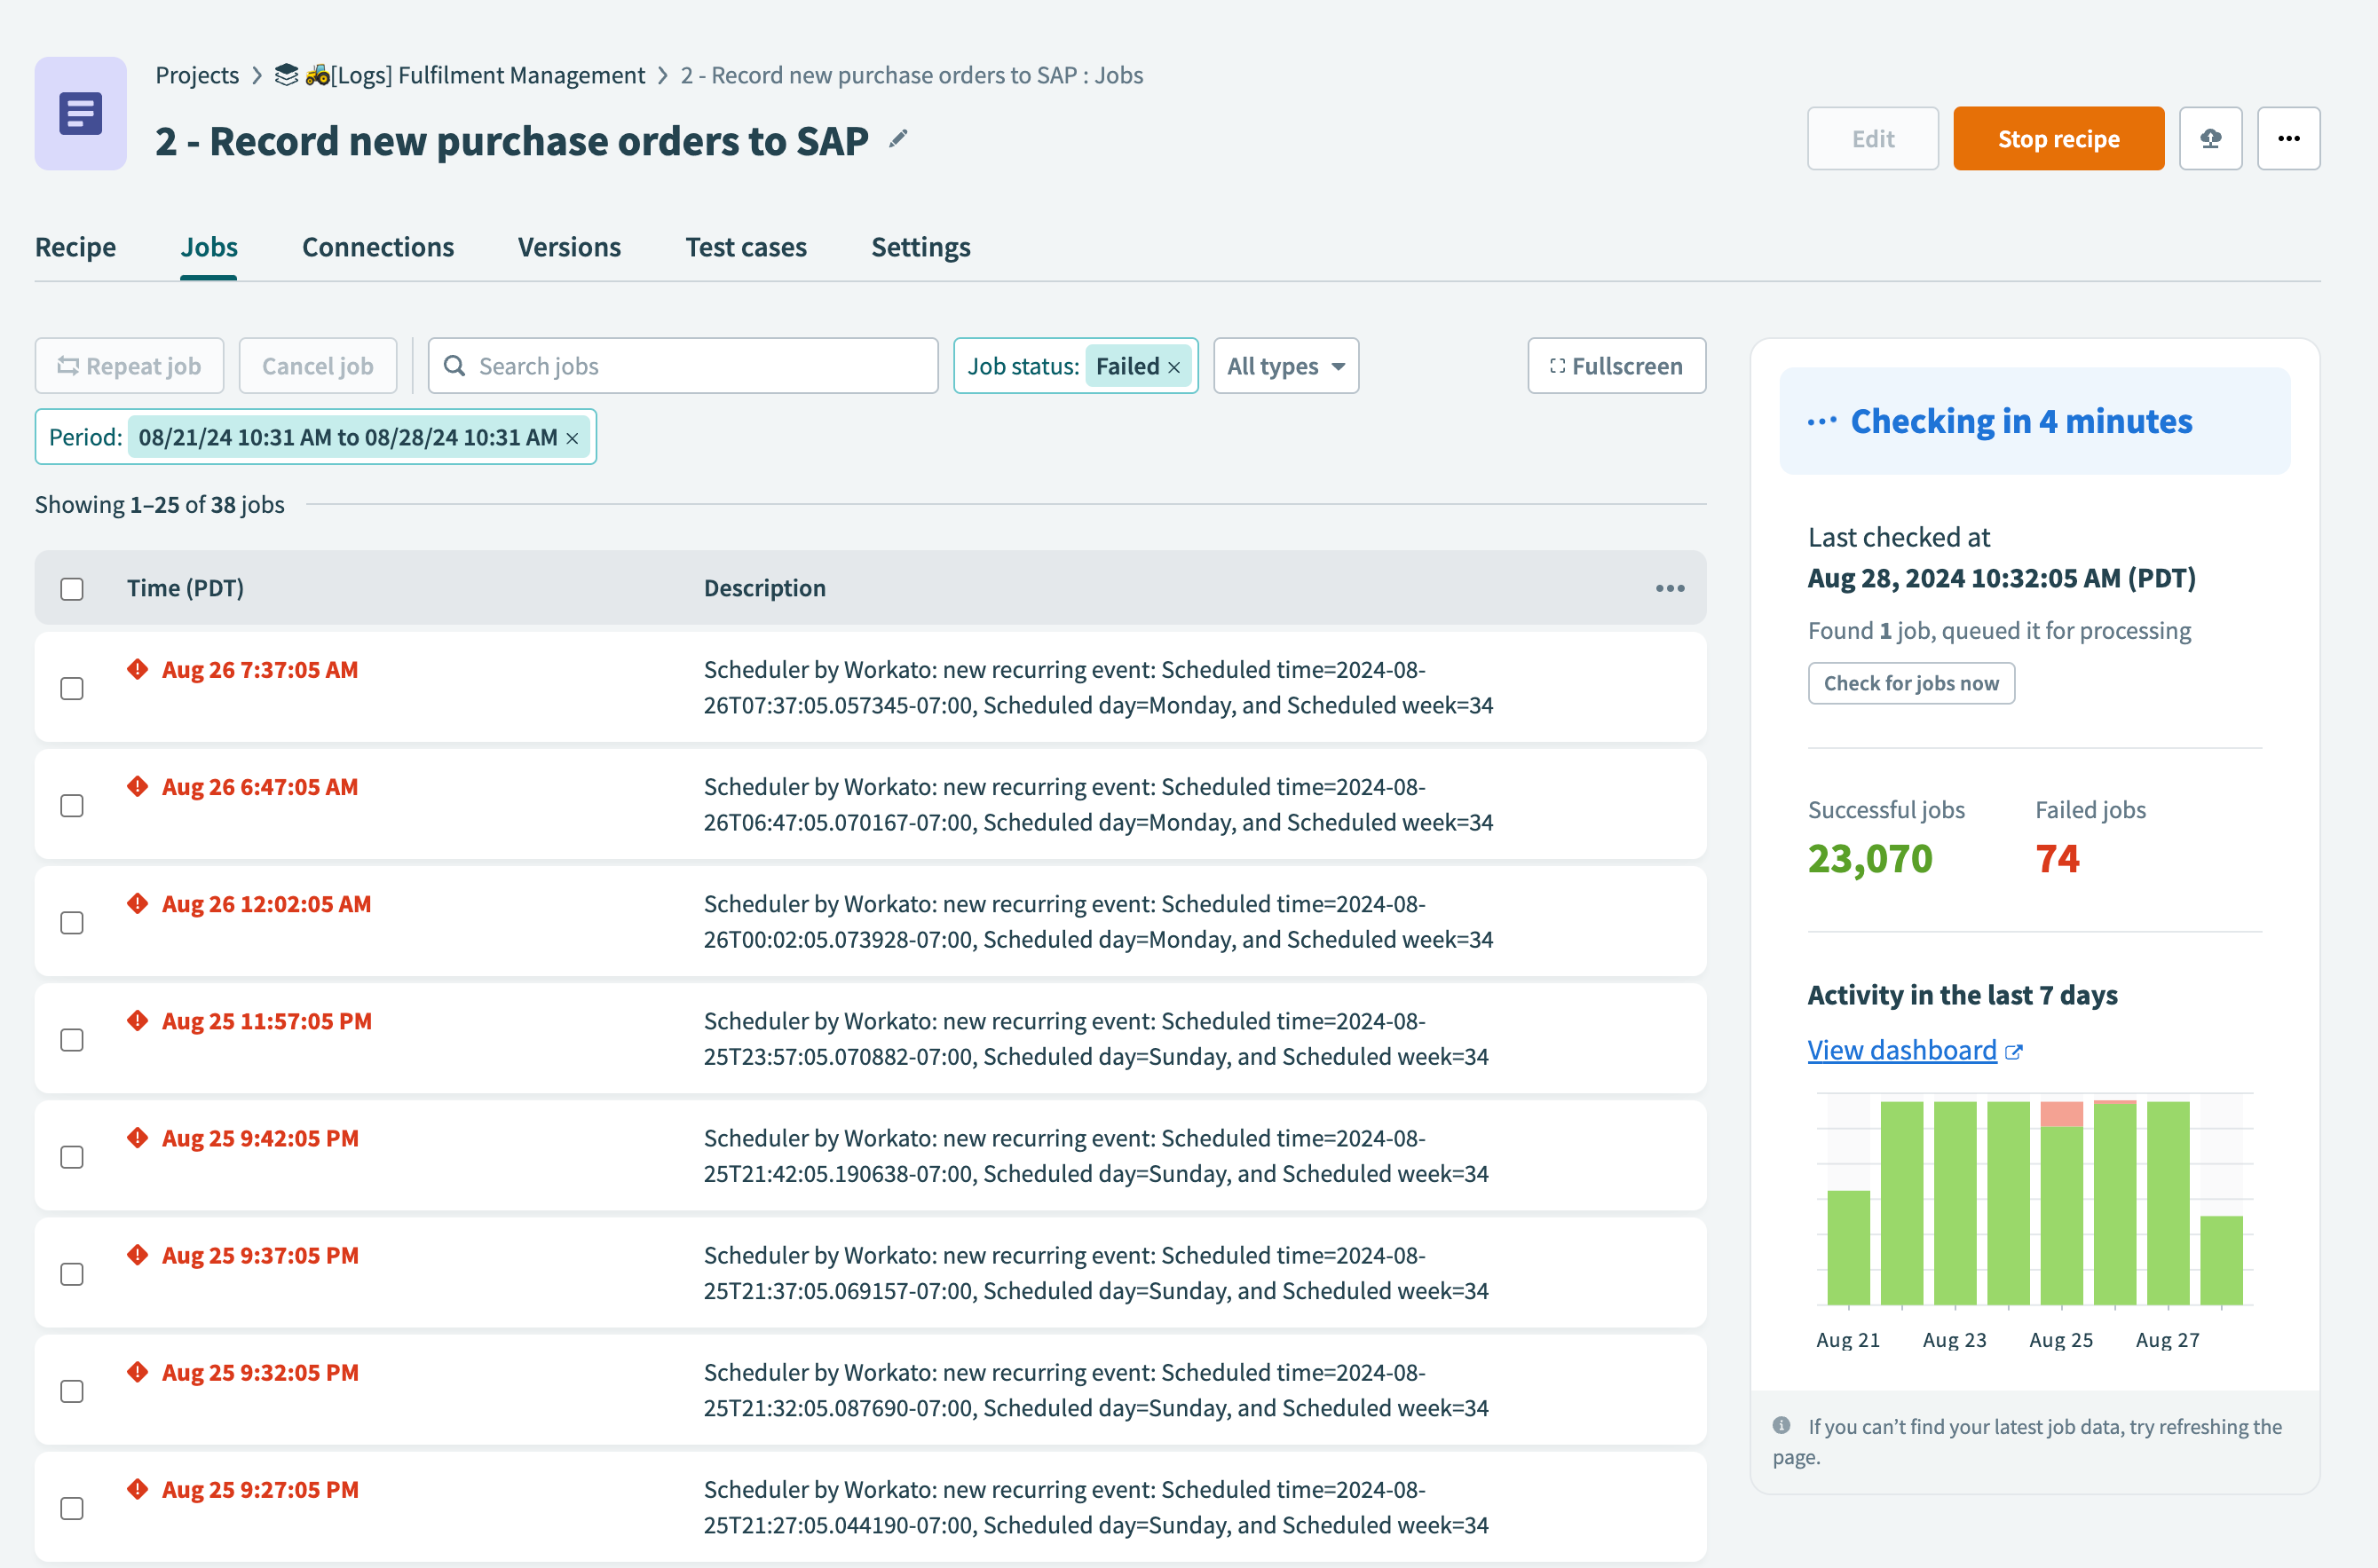 Jobs tab filtered with specified date range
Sort by allows you to filter the list by different priorities:
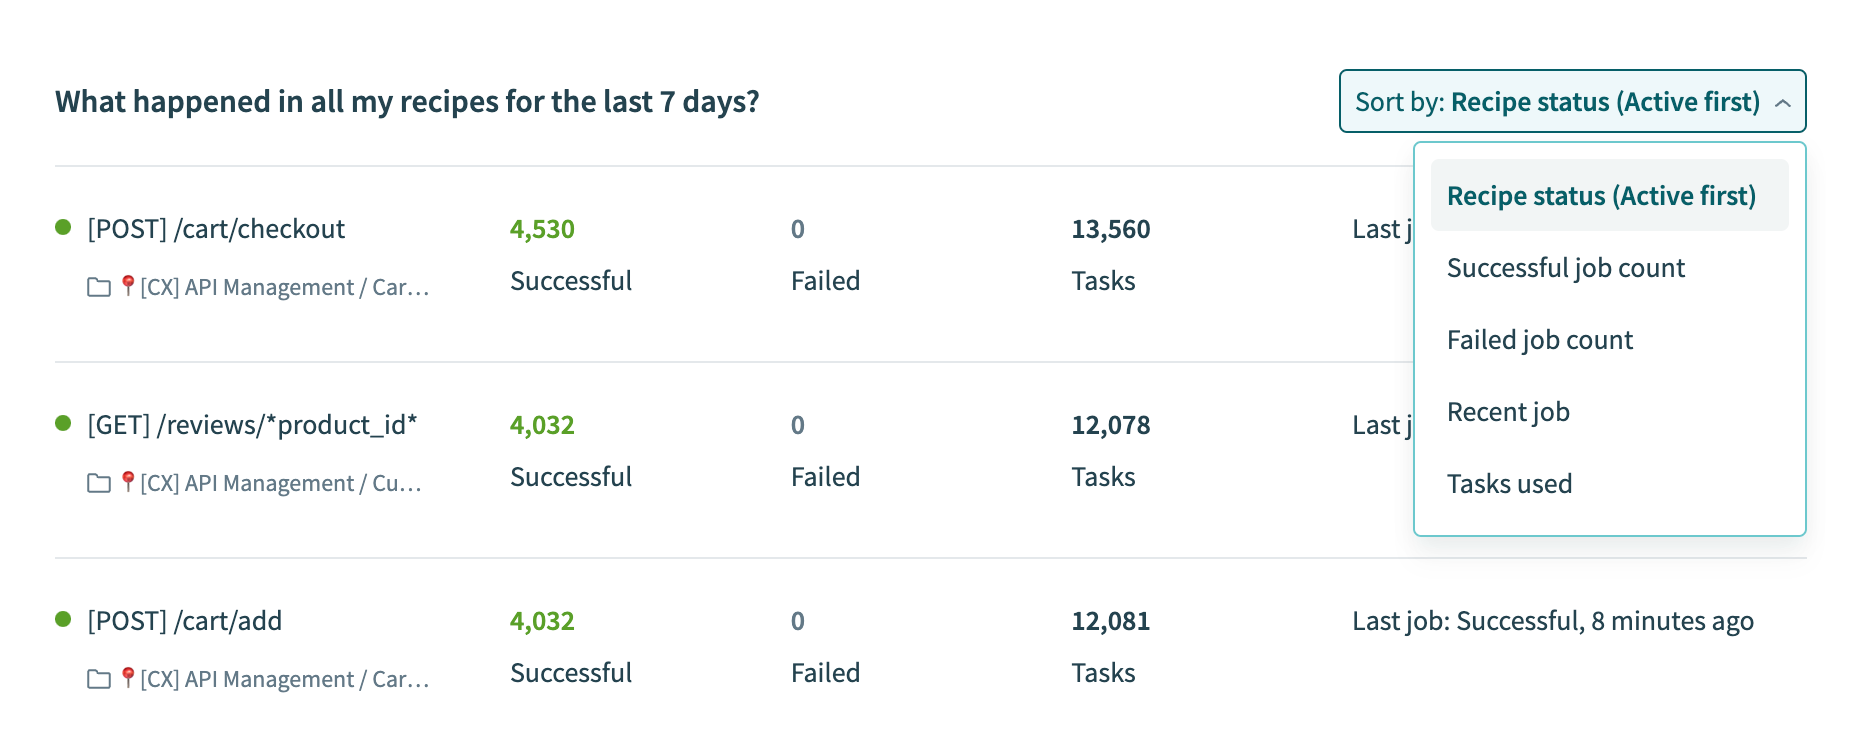 Select a filter to sort the records in the recipe details table
- Recipe status (Active first)
- View active recipes before inactive ones.
- Successful job count
- View recipes with the highest number of successful jobs.
- Failed job count
- Identify recipes that have the most failed jobs. This is the default selection.
- Recent job
- View the most recent job across all recipes.
- Tasks used
- See recipes with the highest number of tasks.
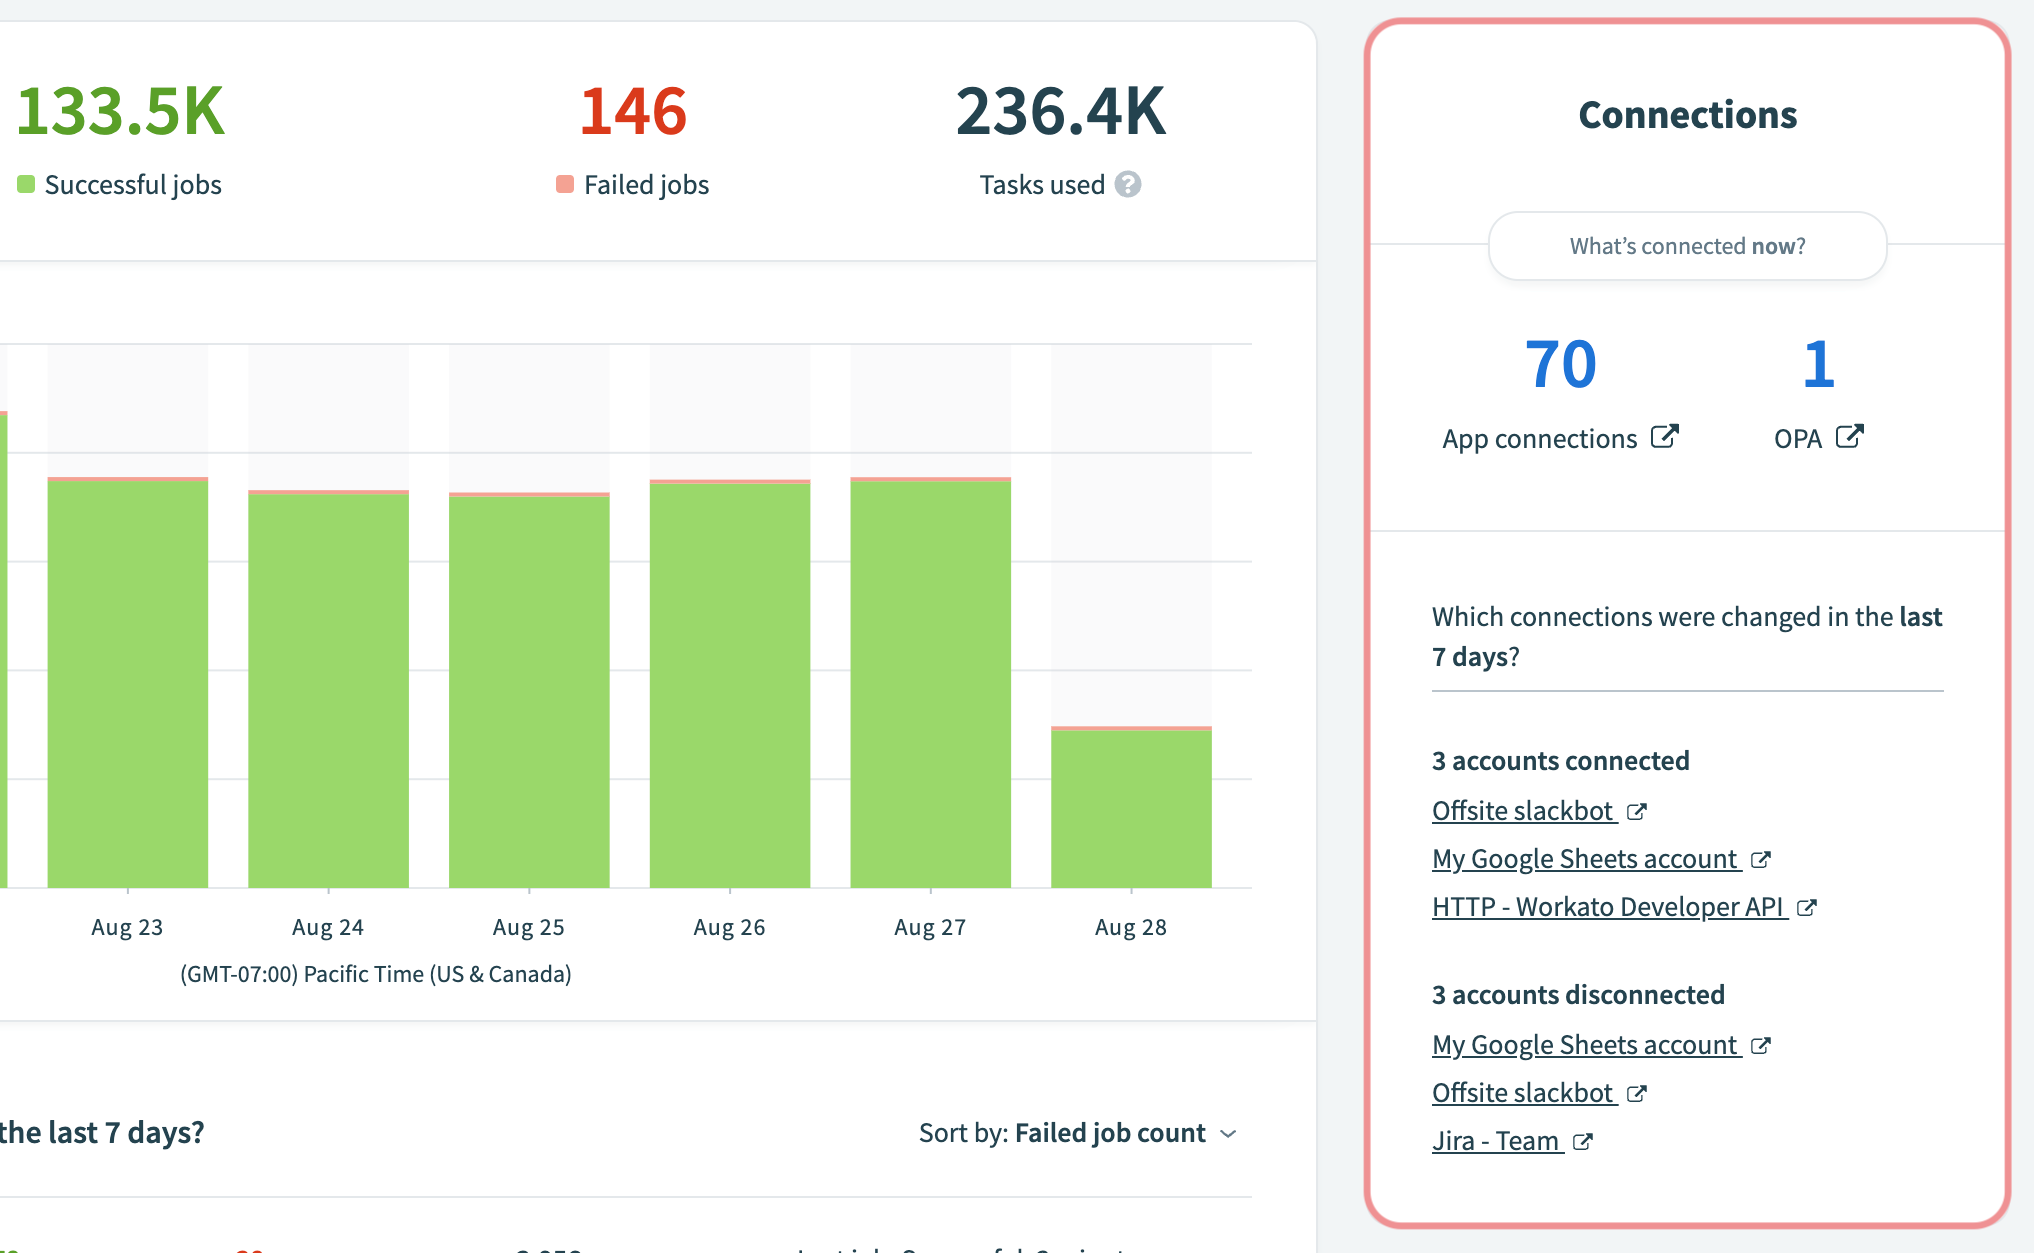
Connections
The Connections section offers a quick view of changes to app connections in your Workato account. It shows accounts connected or disconnected over the past seven days and is not affected by the date filters applied to the main dashboard graph.
 Connections section
- App connections
- The total number of active connections. This refers to connections that are currently used in a recipe.
- OPA
- The total number of on-prem agents in this workspace.
- Accounts connected
- A list of accounts that were connected in the last seven days.
- Accounts disconnected
- A list of accounts that were disconnected in the last seven days.
Plan usage
PRICING MODEL
Customers on the usage-based pricing model, effective in February 2024, can access plan usage by selecting Usage in the side navigation bar.
Refer to your organization's pricing plan and contract, or contact your Customer Success Representative to learn more.
The Plan usage section provides insights into your usage according to your plan. This section varies depending on your plan type and is not affected by the date filters applied to the main dashboard graph.
Last updated: