# Dependency graph
The Dependency graph visualizes the relationships between assets in your workspace. You can use this feature to analyze dependencies and the potential impact of asset changes.
Refer to the following sections for more information about using the Dependency graph to view upstream and downstream dependencies in your workspace:
 Workato Dependency graph
PREFER VIDEOS?
Watch a quick video overview
FEATURE AVAILABILITY
The Dependency graph is included in specific pricing plans. Refer to your pricing plan and contract to learn more.
# Access the Dependency graph
Complete the following steps to access the Dependency graph:
Sign in to your Workato account.
Go to Operations hub > Dependency graph in your workspace.
Select an Asset type, such as Connections.
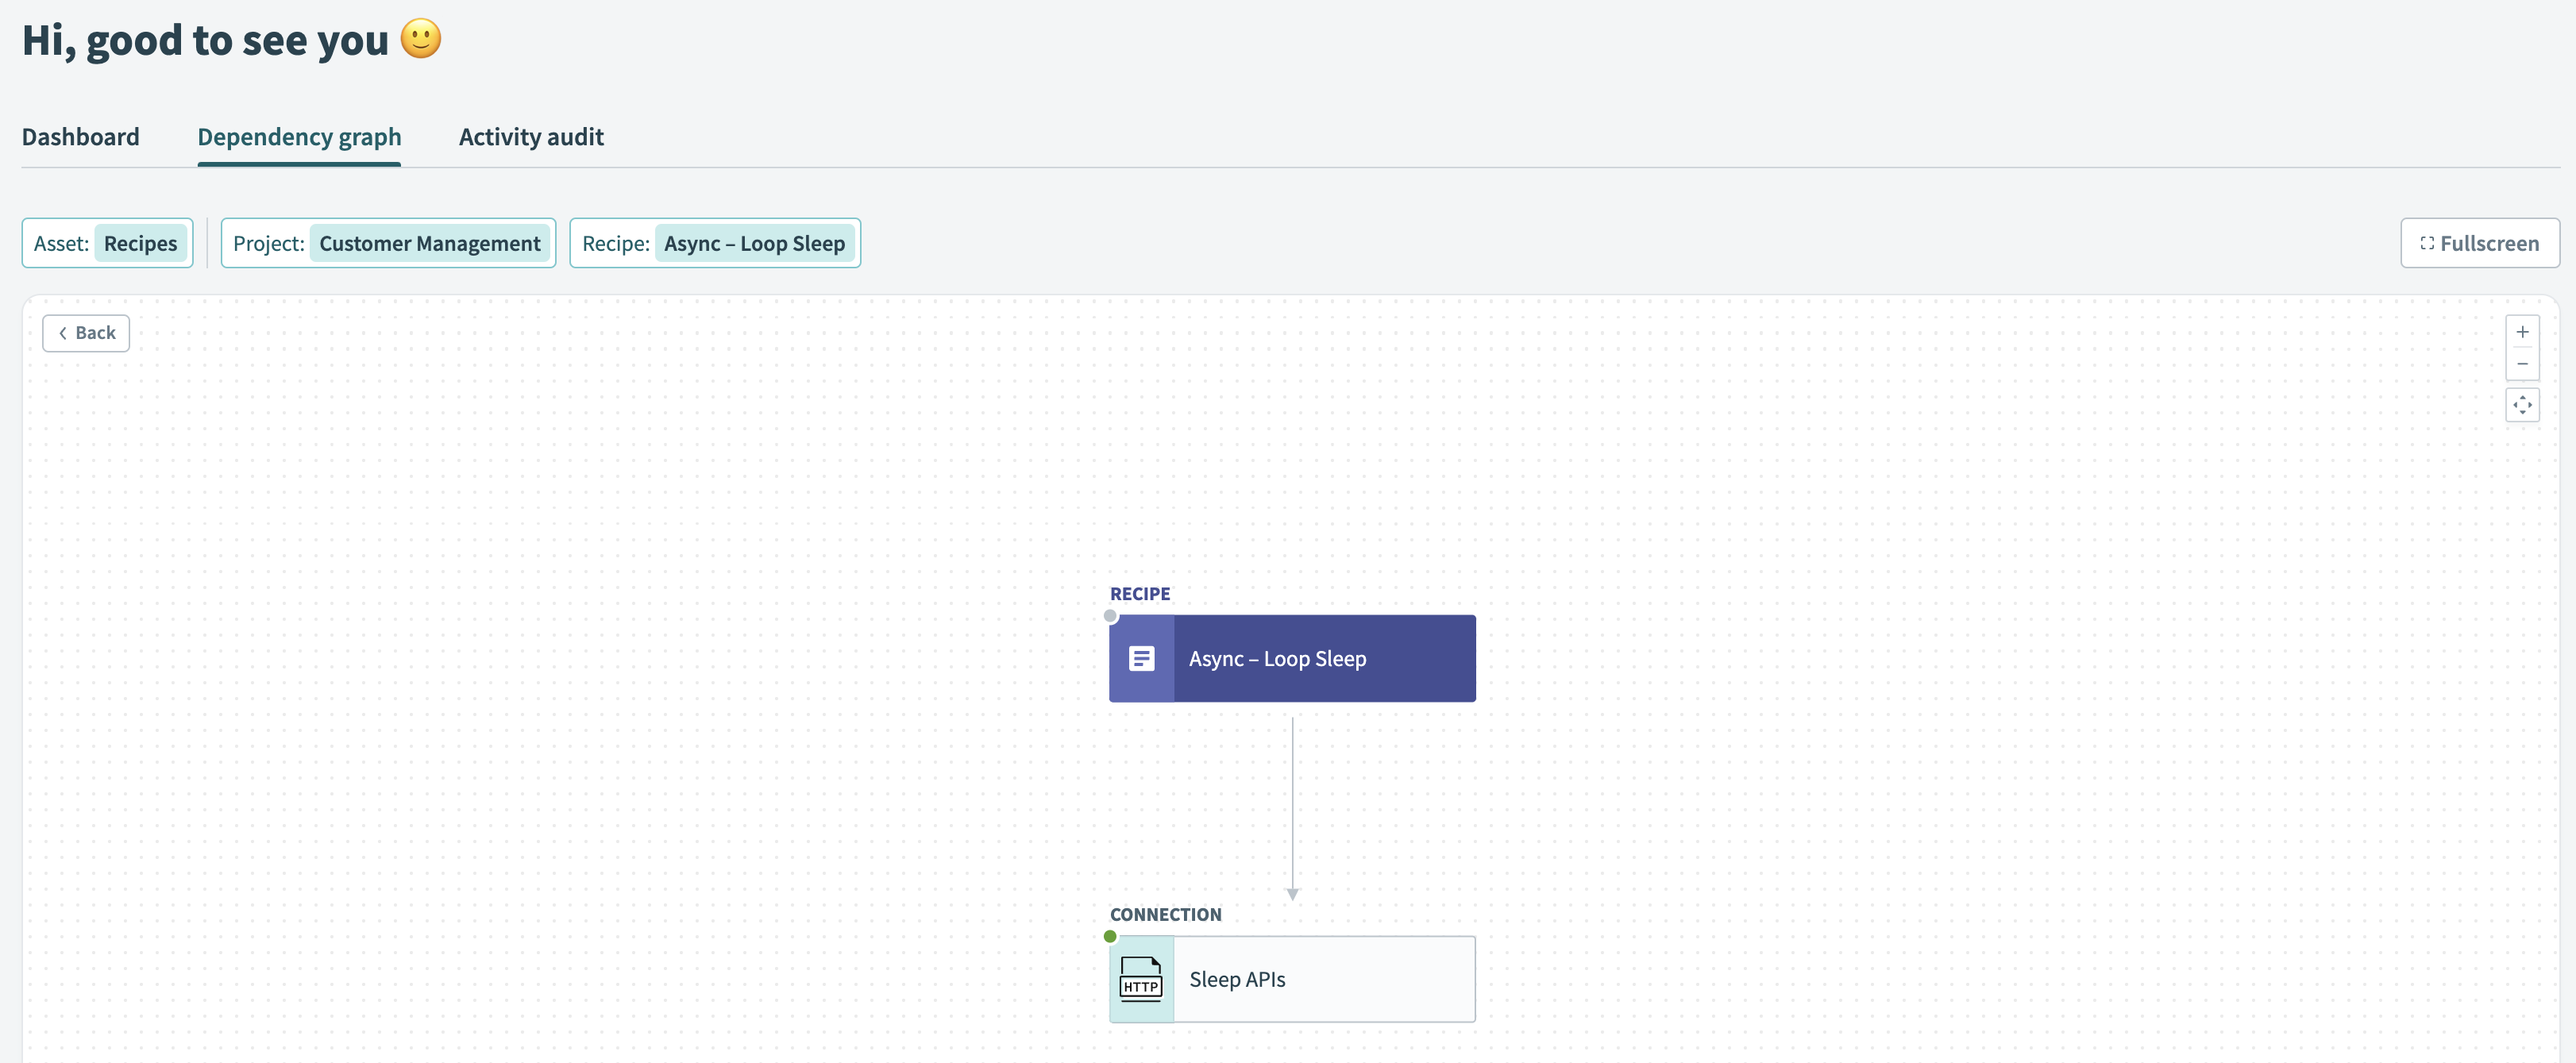
Select a specific asset to view its interdependencies. The following example shows interdependencies for an Asana - Team connection:
Click an asset to open a view of its interdependencies, or hover over the asset and click the (outbound link) icon to open the asset in a new browser tab.
 Click an asset to open a view of its interdependencies.
 Hover over the asset and click the (outbound link) icon to open the asset in a new browser tab.
# Navigation features
You can use the following features to navigate the Dependency graph:
# Supported assets
Select an asset type from the Asset drop-down menu to view its dependencies:
- Apps: Shows how recipes use various apps. By default, the graph displays all apps in Active recipes. You can display inactive recipes using the Recipe status filter.
Apps
You can use the Apps view to determine:
Which apps your team is integrating or automating: The Apps Dependency graph only includes apps with at least one connection.
The flows you're creating for a single app: Click an app to view its overview, which displays the app's individual connections, the recipes that use each connection, and more.
Which apps are most highly used: The number below each app icon indicates how many recipes use the app.
How your team uses apps together: Connecting lines show which apps are used together in recipes. When you hover over an app, the lines display a number indicating how many recipes use both apps together.
For example, the following Box app is used in 3 recipes total, including 2 recipes that also use Salesforce:
- Recipes: Shows how a specific recipe uses connections and other resources.
- Connections: Shows the recipes that use a specific connection, including custom connections.
- Environment properties: Shows how your recipes use a specific environment property.
- Genies: Shows how a specific genie uses connections, skills, and knowledge bases.
- Knowledge bases: Shows how your genies use a specific knowledge base.
- Skills: Shows how your genies use a specific skill.
- API collections: Shows the usage of API endpoints in a specific API collection.
- Custom connectors: Shows the recipes that use a specific custom connection.
- Workflow apps: Shows how a specific workflow app uses data tables and recipes.
- Pages: Shows how your recipes and Custom apps use a specific page.
- Lookup tables: Shows how your recipes use a specific lookup table.
- Project properties: Shows how your recipes use a specific project property.
- Event topics: Shows how your recipes use a specific Event topic.
- Data tables: Shows how your recipes and custom apps use a specific data table.
- Common data models: Shows how your recipes use a specific custom object.
- Templates: Shows how your recipes use a specific message template.
- Data pipelines: Shows the usage of a specific data pipeline.
Last updated: 10/24/2025, 3:16:38 PM