Dashboard templates
Insights is designed to provide you with an overview of your automations' functionality out of the box and provides templates pre-configured with queries to give you insights into your workspace and projects. Dashboard templates are available from the Insights homepage when you create a new dashboard.
Insights has the following dashboard templates:
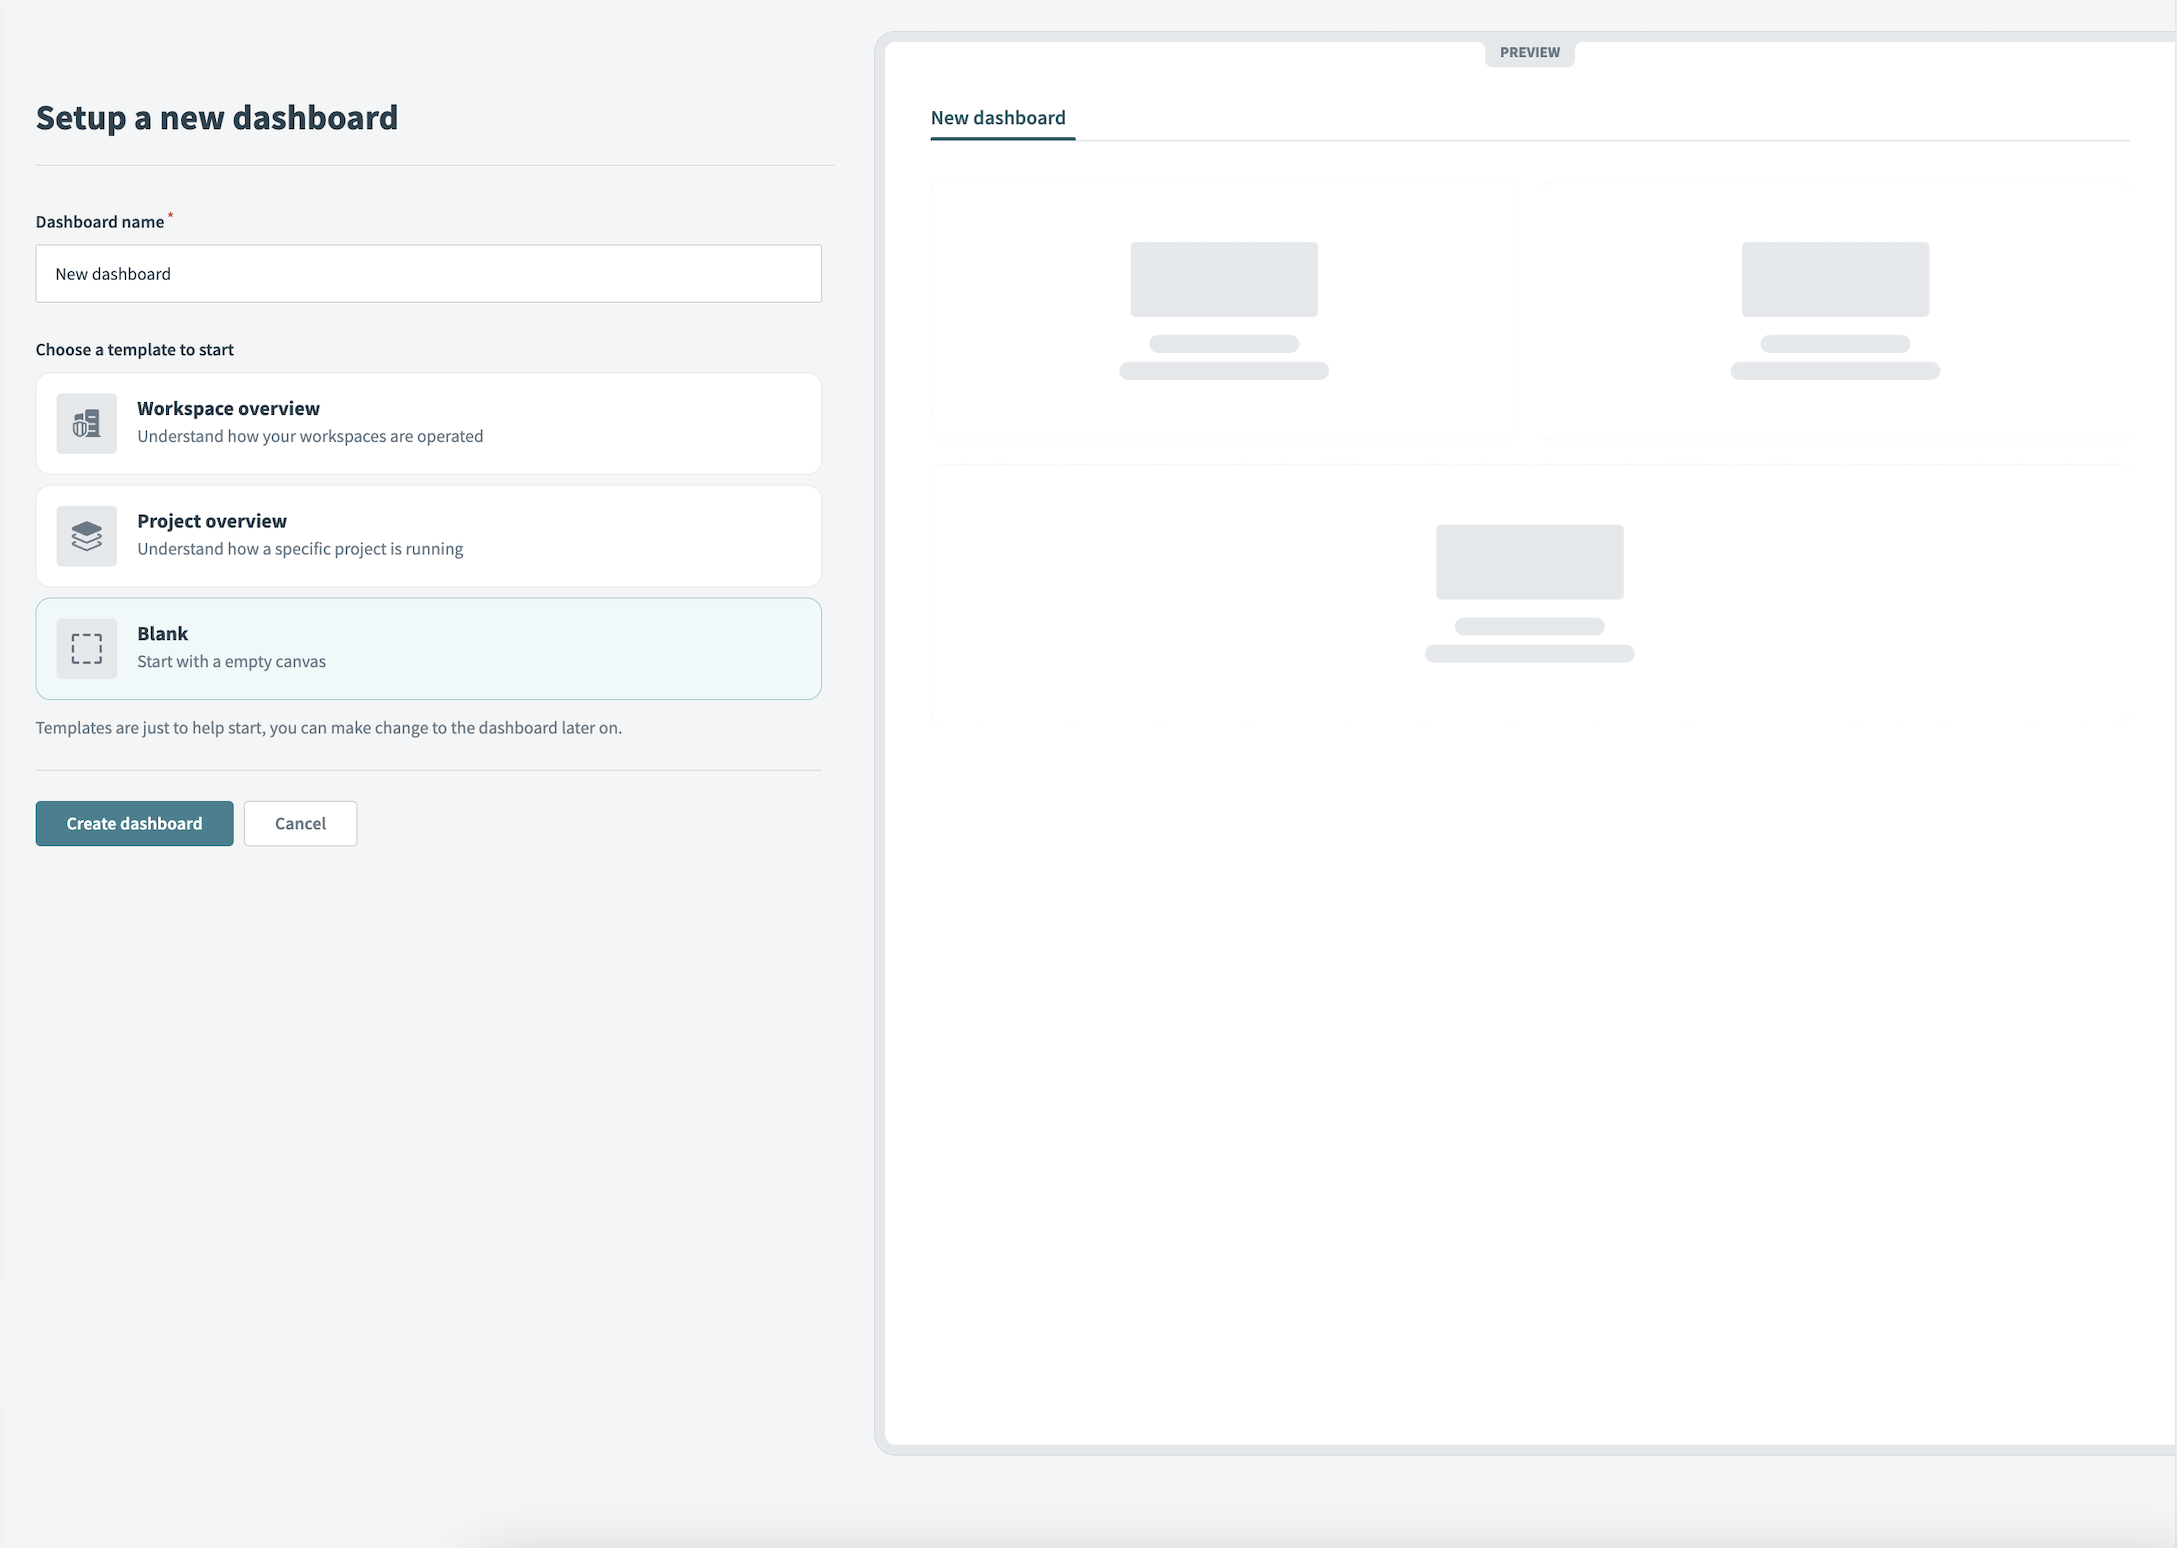
Alternatively, you can start with a blank template to build your dashboard from scratch:
Refer to the usage inspiration section of our documentation for examples of the custom dashboards you can build.
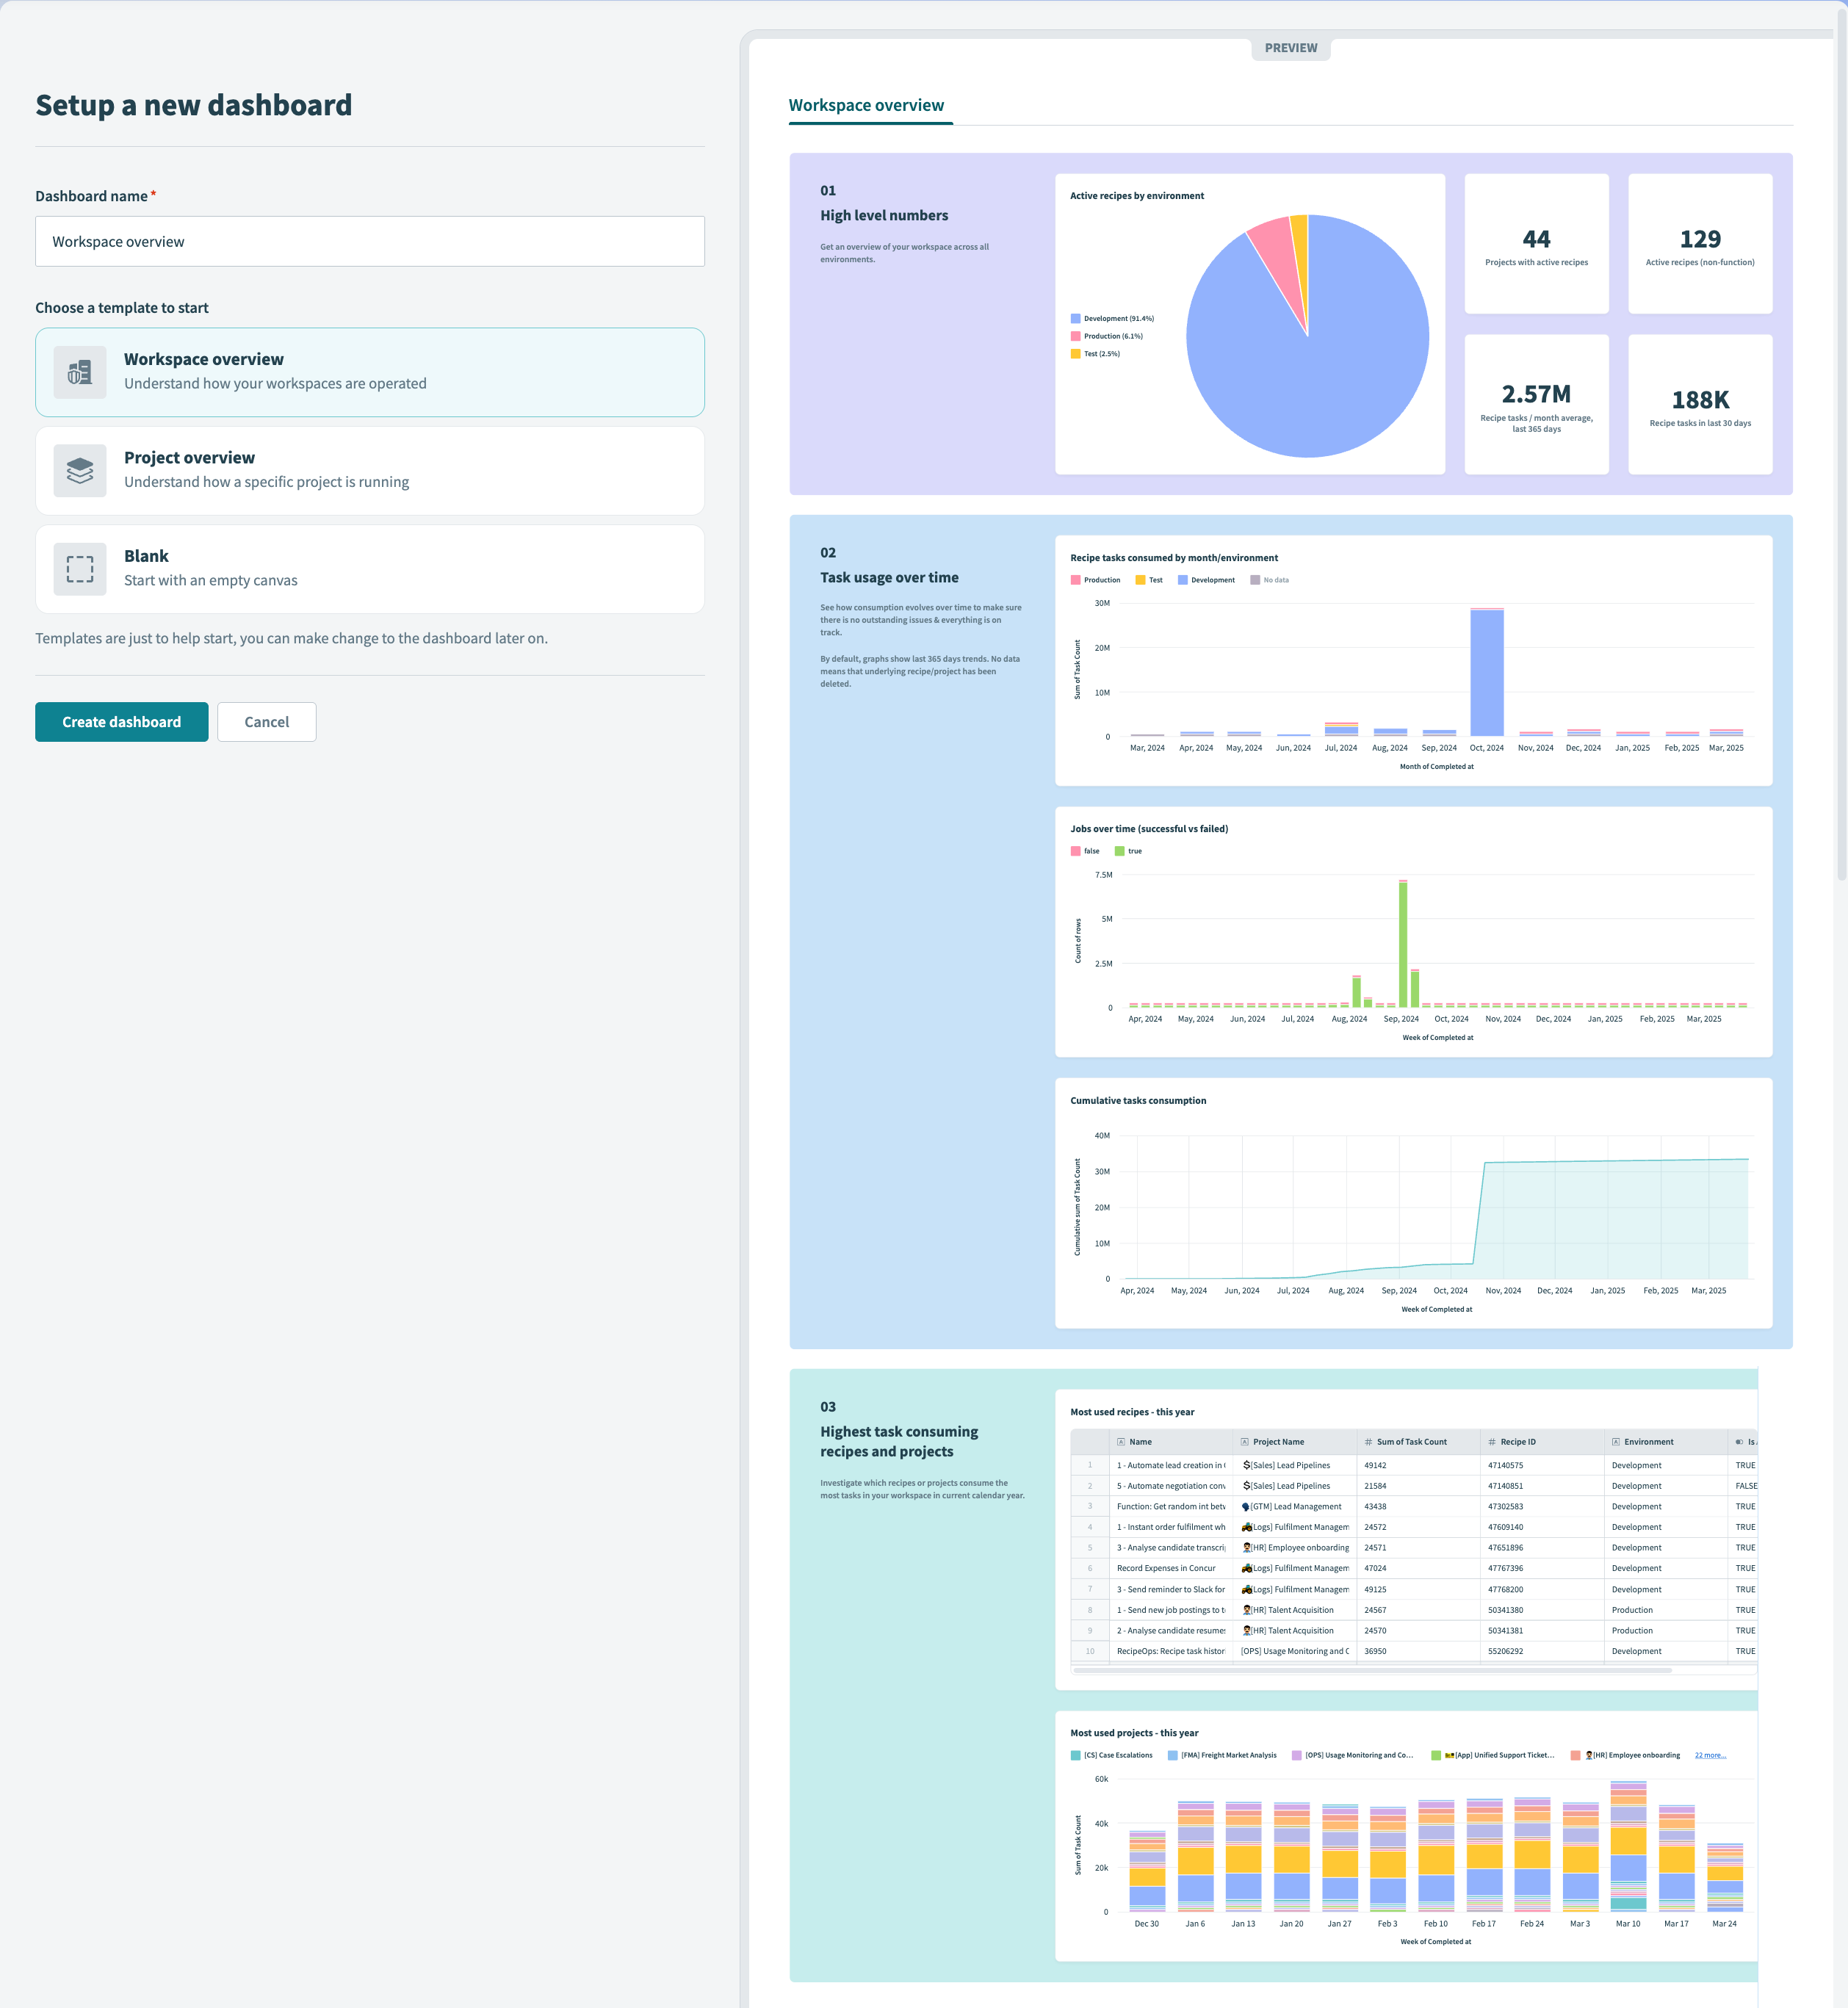
Workspace overview template
The workspace overview template provides an overview of the operational health of your workspace.
 Workspace overview template
Metrics
The workspace overview template comes preconfigured with metrics and queries that report on high level numbers, task usage over time, and the projects and recipes that consume the most tasks.
| Chart title | Metrics | Description |
|---|
| Active recipes by environment | Sum of active recipe count by environment | View the total number of active recipes for each environment in your workspace. |
| Projects with active recipes | Sum of active recipe count by project | View the total number of active recipes for each project in your workspace. |
| Active recipes (non function) | Sum of active recipes (non function) count | View the total number of active recipes (non function) in your workspace. |
| Tasks/month average, last 365 days | Sum of task count by time | Understand task consumption over the past 365 days. |
| Tasks in last 30 days | Sum of task count by time | Understand task consumption for the last 30 days. |
| Chart title | Metrics | Description |
|---|
| Tasks consumed by month/environment | Sum of task count by time and environment | Understand task consumption across environments in the last few months. |
| Jobs over time (successful vs failed) | - Sum of successful job count by time
- Sum of failed job count by time
| Understand the relationship between successful and failed jobs for the last 365 days. |
| Cumulative tasks consumed | Cumulative sum of task count by time | Understand cumulative task consumption for the last 365 days. |
| Chart title | Metrics | Description |
|---|
| Highest consumption recipes- this year | Sum of task count by recipe and time | Understand which recipes consumed the most tasks for the last 365 days. |
| Consumption by project | Sum of task count by project | Understand which projects in your workspace consumed the most tasks for the last 365 days. |
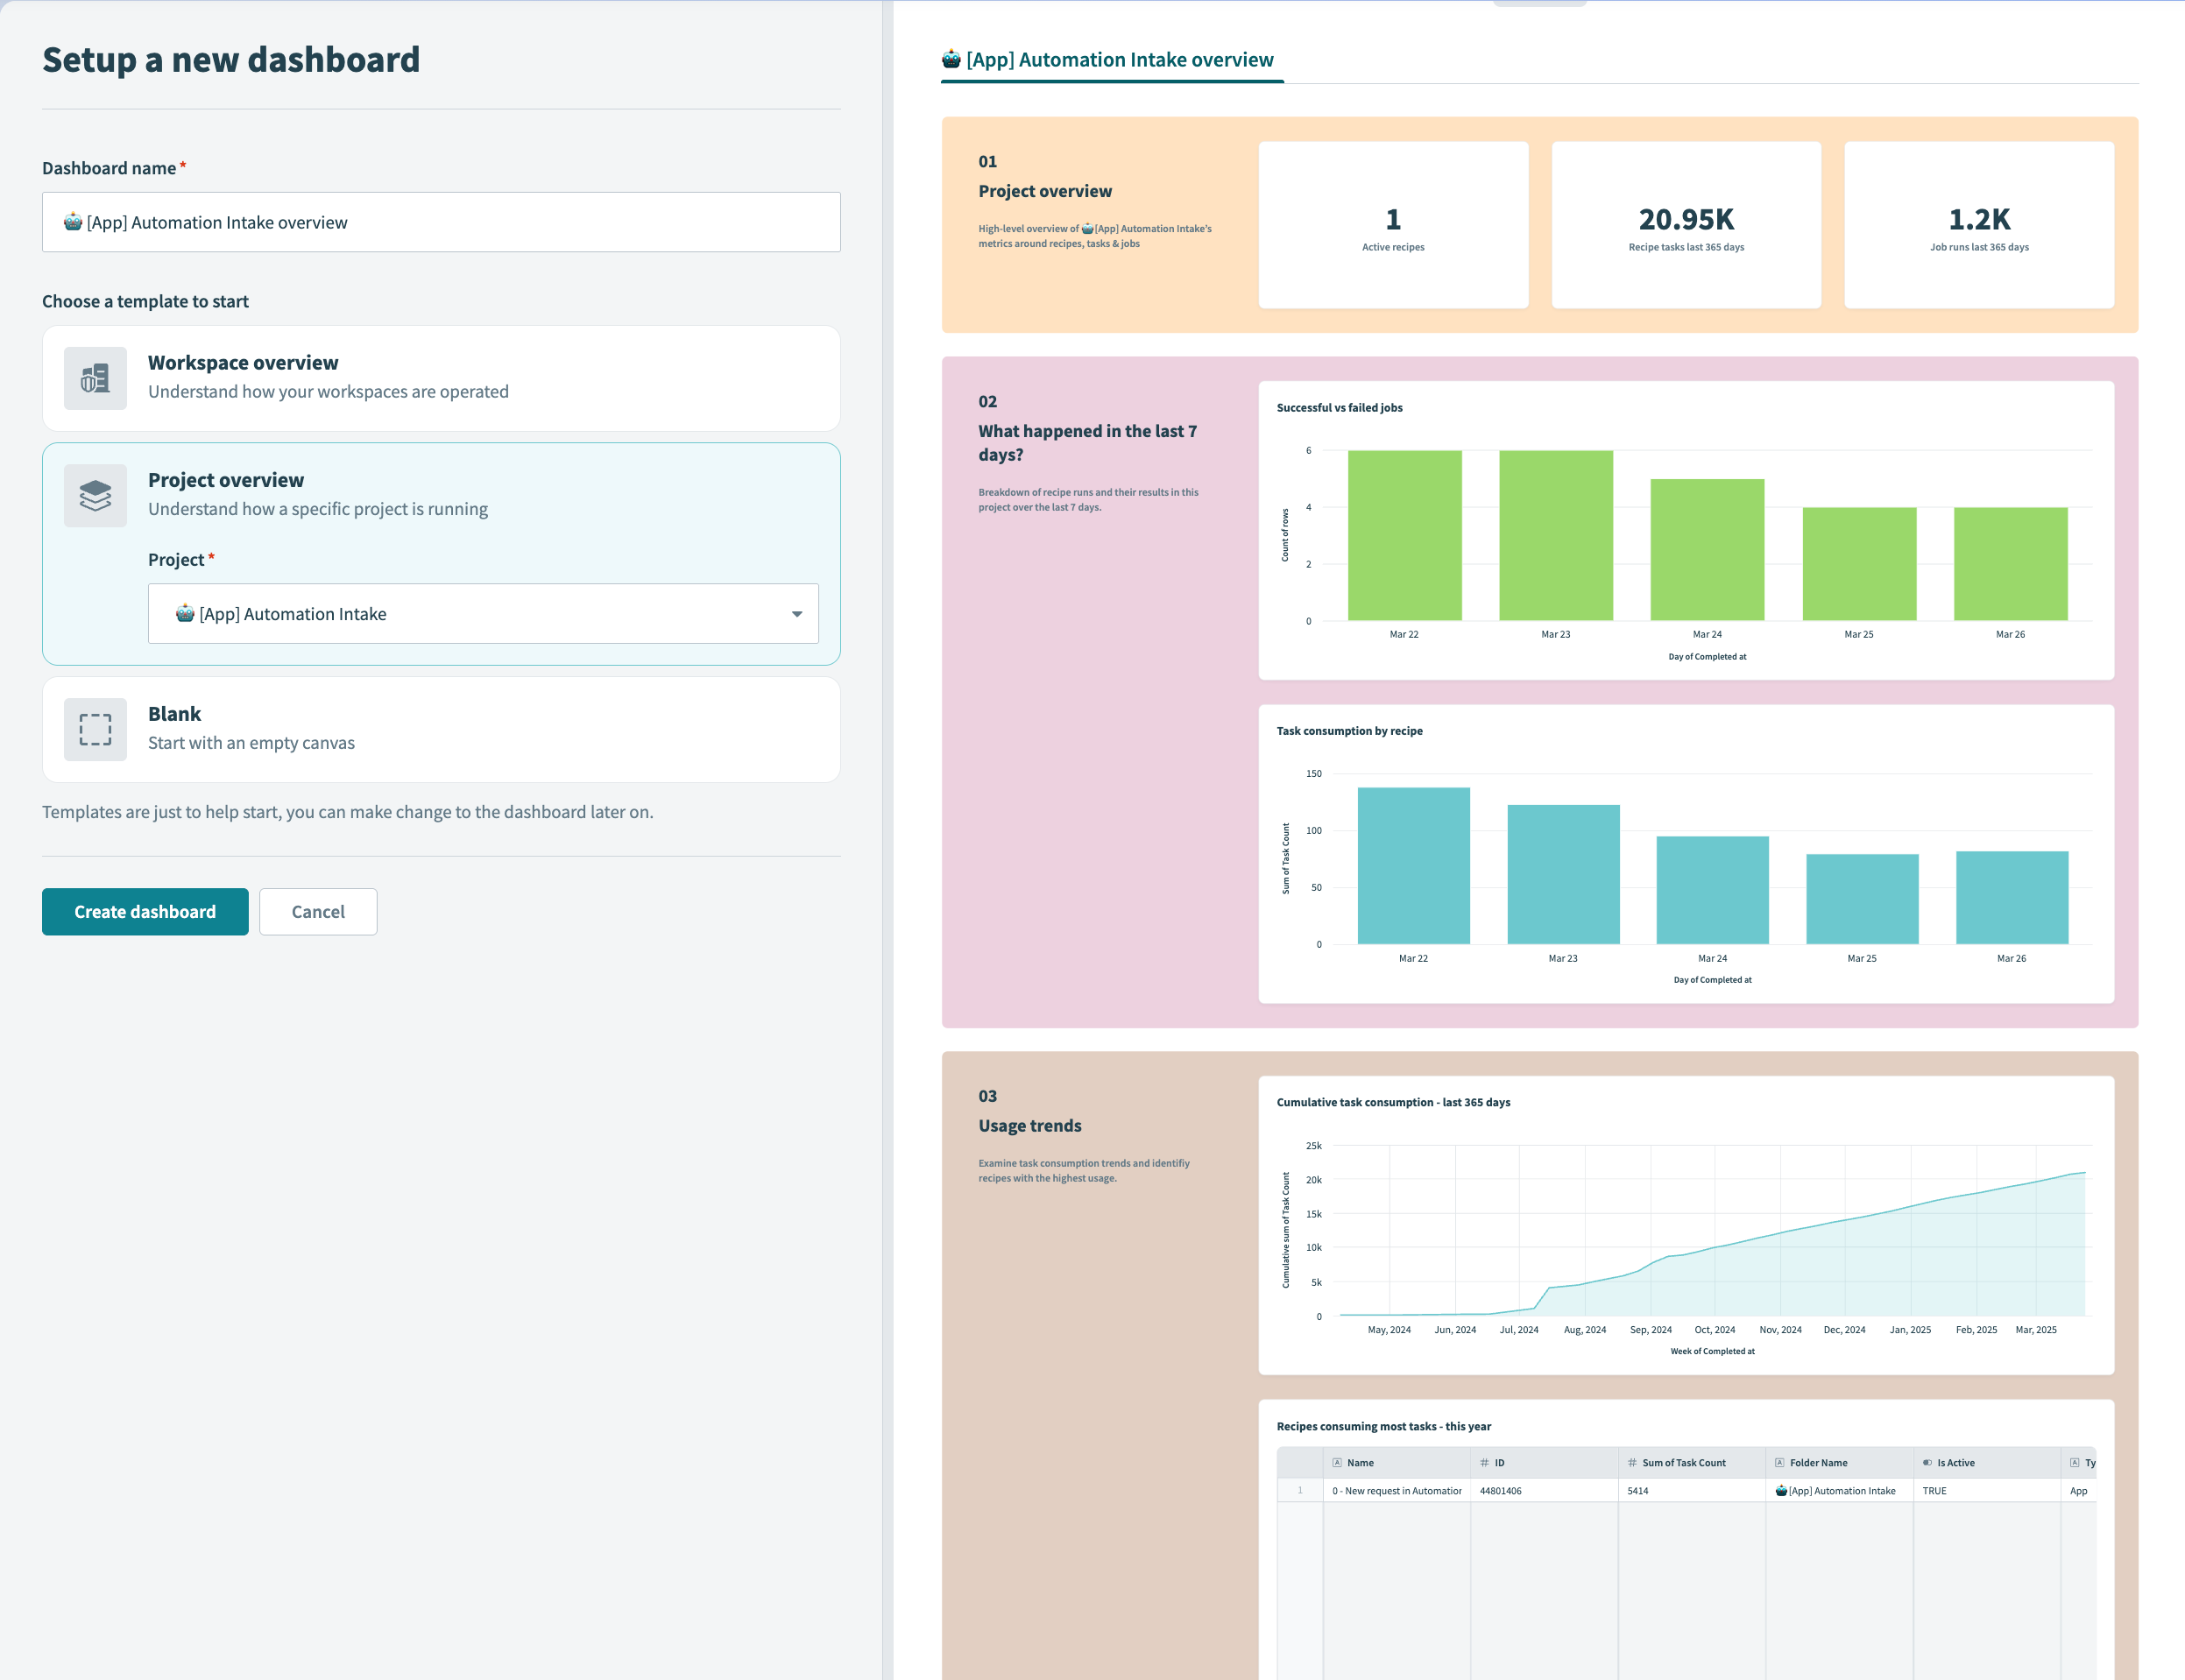
Project overview template
The project overview template provides an overview of the operational health of a specific project in your workspace. You must select a project to load a dynamic preview of the template.
 Project overview template
Metrics
The project overview template comes preconfigured with queries and metrics that report on an overview of the selected project, project activity in the last seven days, and usage trends.
| Chart title | Metrics | Description |
|---|
| Active recipes | Sum of active recipe count | View the total number of active recipes in a specific project. |
| Recipe tasks in the last 365 days | Sum of task count by time | View the total number of recipe tasks consumed by a specific project for the last 365 days. |
| Job runs in the last 365 days | Sum of job count by time | View the total number of jobs run in a specific project for the last 365 days. |
| Chart title | Metrics | Description |
|---|
| Successful vs failed jobs | - Sum of successful job count by time
- Sum of failed job count by time
| Understand the relationship between successful and failed jobs for the last 365 days. |
| Task consumption by recipe | Cumulative task consumption by recipe | Understand which recipes in a specific project consumed the most tasks for the last 365 days. |
| Chart title | Metrics | Description |
|---|
| Cumulative tasks consumption - last 365 days | Sum of task count by time | Understand cumulative task consumption by a specific project for the last 365 days. |
| Recipes consuming most tasks - this year | - Name
- ID
- Sum of task count
- Folder name
- Is active
| Understand which recipes within a specific project consumed the most tasks for the last 365 days. |
Blank template
 Blank template
Use the blank dashboard template to create a custom dashboard to visualize your automation data.