Usage inspiration
Use Insights to build custom dashboards to visualize your data for a variety of scenarios. Insights is particularly useful in performing the following automation analytics:
Usage analytics: How are we using Workato platform?
- The number of active recipes- overall and segmented by project or environment
- Recipes consuming most tasks
- The number of tasks consumed by particular recipe - overall and over time
- The number of tasks consumed broken down by recipe, project, or environment - overall and over time
- Recent errors in recipes
Process analytics: How does my automated business process perform?
- The number of orders processed
- Average user processing time
- Time spent in a certain status
Operational analytics: How does my automation work?
- The number of recipes/jobs/tasks
- Error rate
- Execution time
Efficiency analytics: How efficient is my automation?
- ROI
- Time savings
- Adoption rates
Example ROI dashboard
You can build a dashboard to visualize your ROI (return on investment) and provide actionable analytics that helps you understand how your business performs. From here, you can plan corrective actions to increase your operational efficiency and productivity.
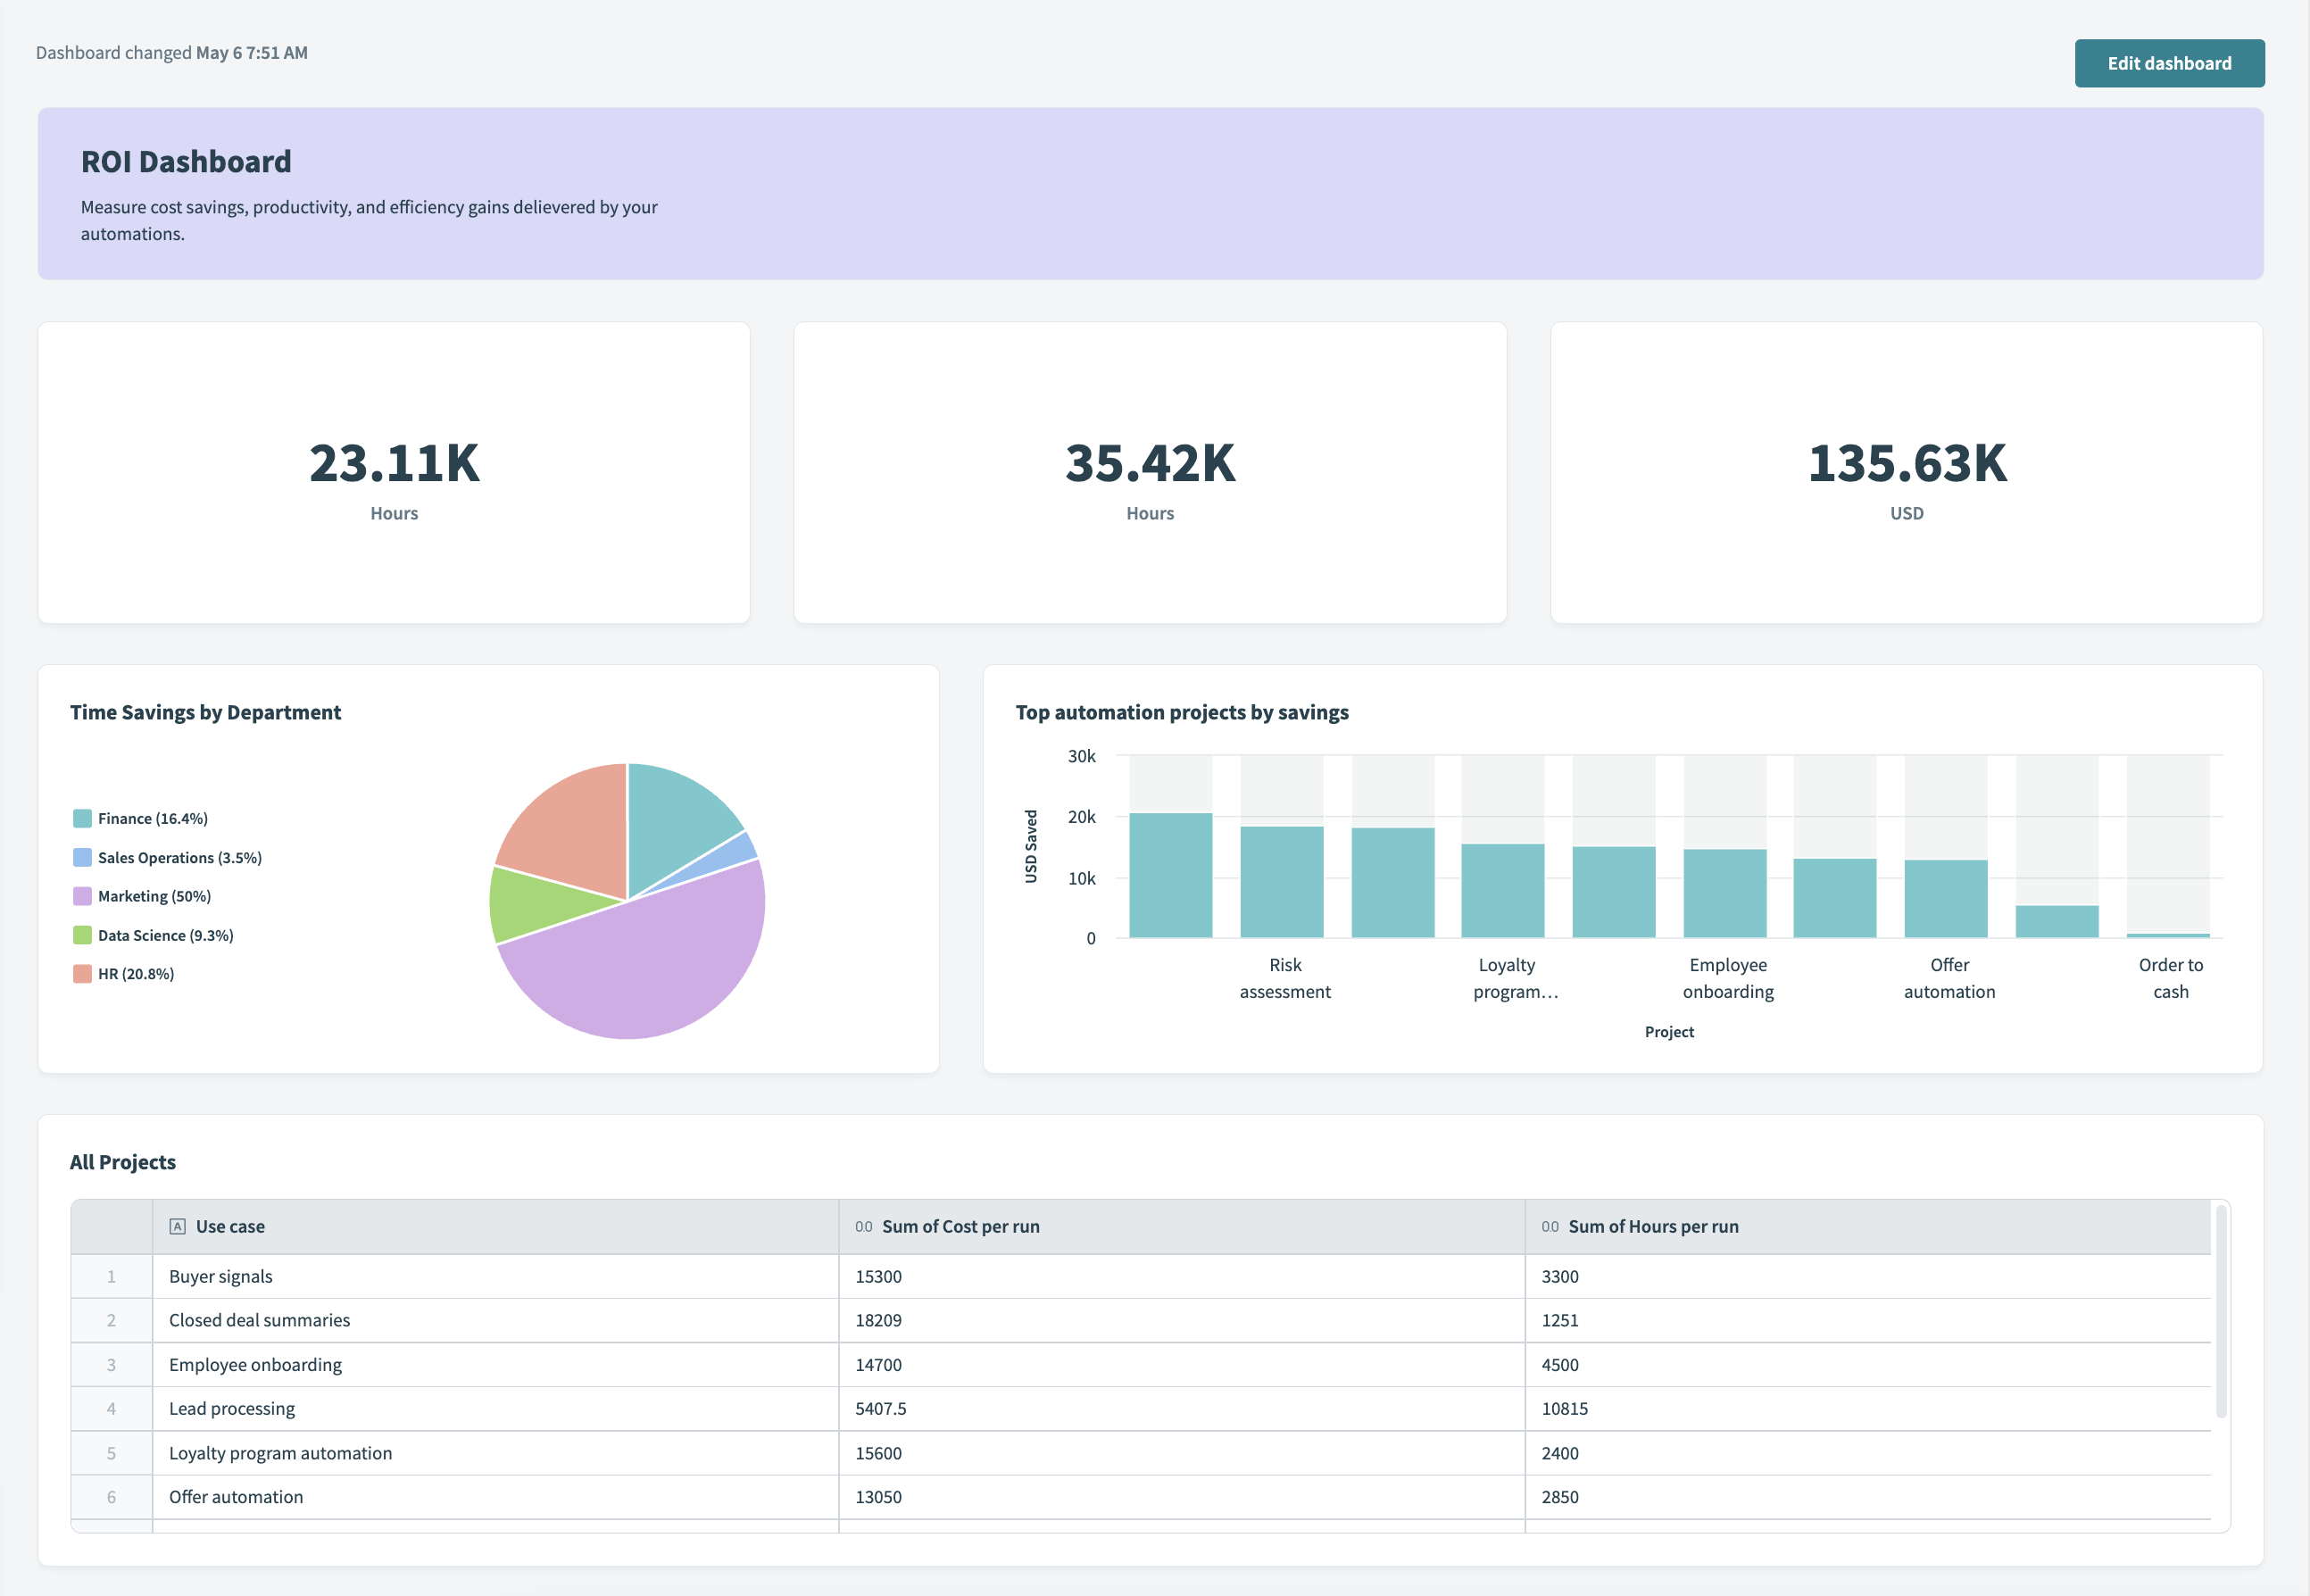 Example ROI dashboard
FURTHER READING
Last updated: