KPI
A KPI (Key Performance Indicator) is a quantifiable measurement of progress toward company goals. KPIs can help highlight areas of success and areas that require improvement with your genies. You can view KPIs on your genie's Overview page by clicking the KPI tab.
KPI TAB IS ONLY AVAILABLE FOR GENIES WITH THE WORKATO GO CHAT INTERFACE
The KPI tab is only visible on the Overview page of genies that use the Workato GO chat interface.
KPIs use data tables to store frequently used data and efficiently reference this data in KPI skill recipes. KPIs are added to the data table you specify when you create a KPI skill recipe.
flowchart TD
a(End user triggers <br/> a KPI skills recipe. For example: <br/> <em> New lead </em>)
b([The genie skills <br/> recipe writes <br/> to the Data table. ])
c[(Data table displays <br/> the existing requests.<br/> Workato loads <br/> this information from <br/> the recipe's data table <br/> and combines it <br/> with configured tasks.)]
d(KPI reports are <br/> generated using this data.)
a --> b
b --> c
c --> d
classDef default fill:#fff,stroke:#5159f6,stroke-width:3px,color:#000;
Create a KPI
Complete the following steps to create a KPI:
1
Sign in to your Workato account.
2
Go to AI Hub and click the Genies tab. A list of your existing genies displays.
3
Select the genie where you plan to add a KPI.
5
Click + Add.
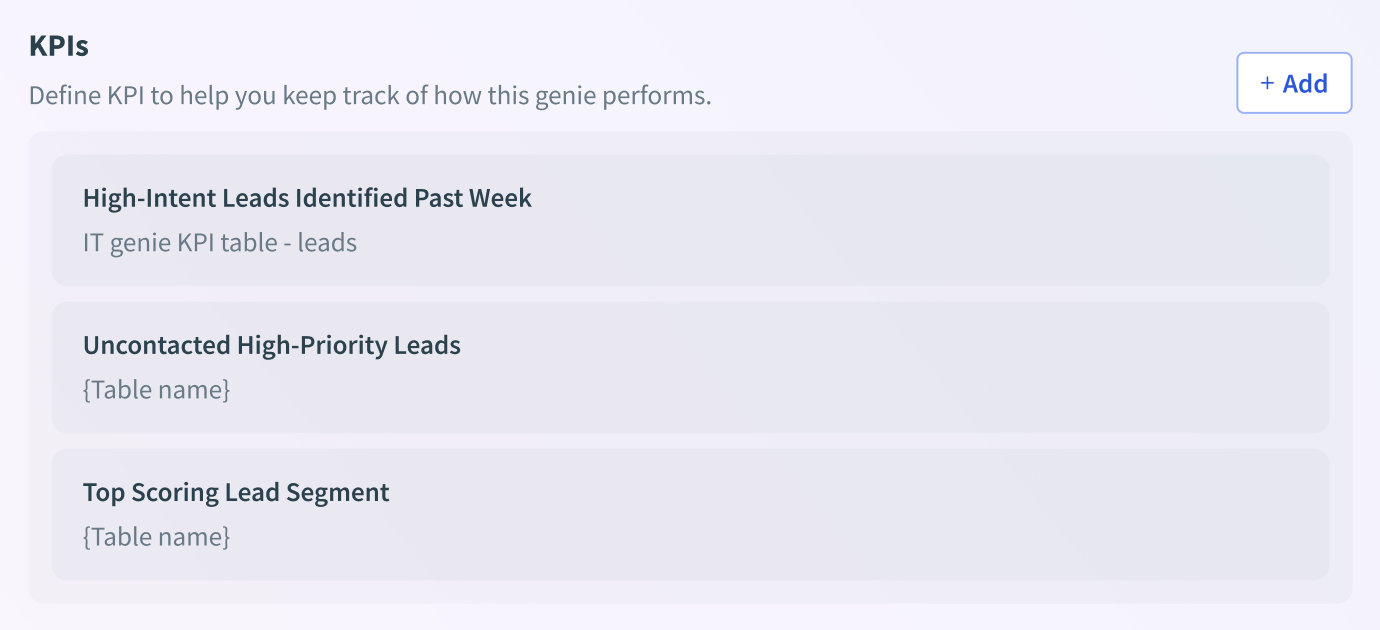 KPI section
6
Enter a name for your KPI in the KPI name field. For example: High intent leads.
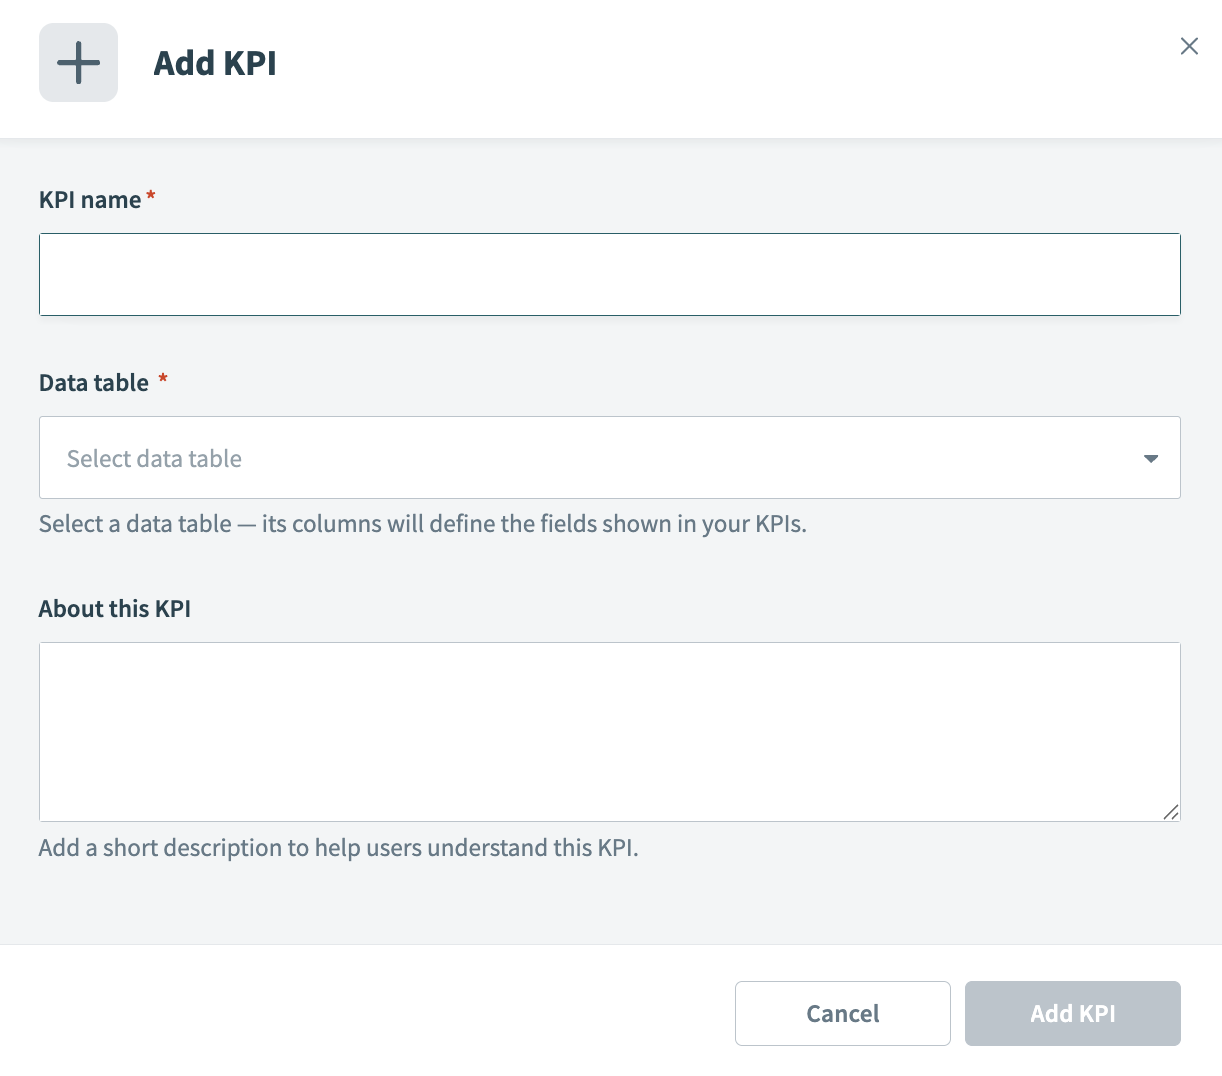 Add KPI modal
7
Use the Data table drop-down menu to select the data table you plan to use.
8
Optional. Provide a description of your KPI in the About this KPI field.
Display KPIs in Workato GO with Action Board
You can visualize your KPI metrics in Workato GO by creating thumbnail cards. This enables you to build a dashboard of KPI indicators called an Action Board.
LIMITED TO FIVE THUMBNAILS
Each genie is limited to five thumbnails.
The following thumbnails are available:
- Default: This thumbnail displays information in card format and is available to all user groups.
- Metric & chart: This thumbnail displays top and bottom metrics that you configure in chart format. You can select which user groups can view this thumbnail within Workato GO.
- Stacked metrics: This thumbnail displays three metrics that you configure in a stacked format. You can select which user groups can view this thumbnail within Workato GO.
- Detailed table: This thumbnail displays detailed information in a table format that you configure. You can select which user groups can view this thumbnail within Workato GO.
Create a thumbnail
Complete the following steps to create a thumbnail for your Action Board:
1
Sign in to your Workato account.
2
Go to AI Hub and click the Genies tab. A list of your existing genies displays.
3
Select the genie where you plan to add an Action Board thumbnail.
4
Click the End user settings tab.
5
Click Display in Workato GO.
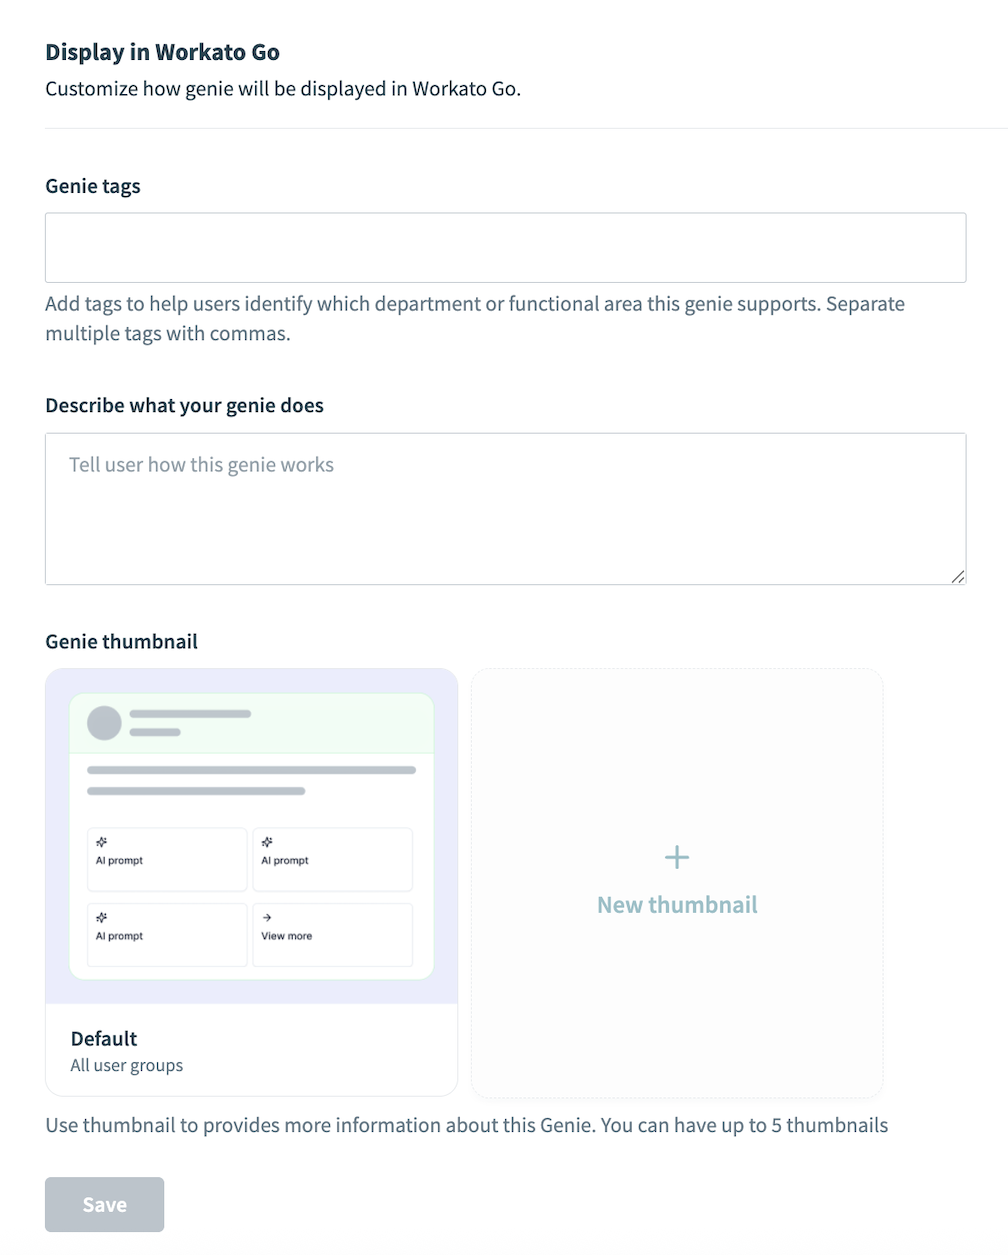 Display in Workato GO
6
Go to Genie tags and add tags to help users identify which department the genie supports. For example: Sales.
7
Provide a description in the Describe what your genie does field.
8
Go to the Genie thumbnail section and select the Default thumbnail or click New thumbnail to select one of the following thumbnails:
- Metric & chart
- Stacked metrics
- Detailed table
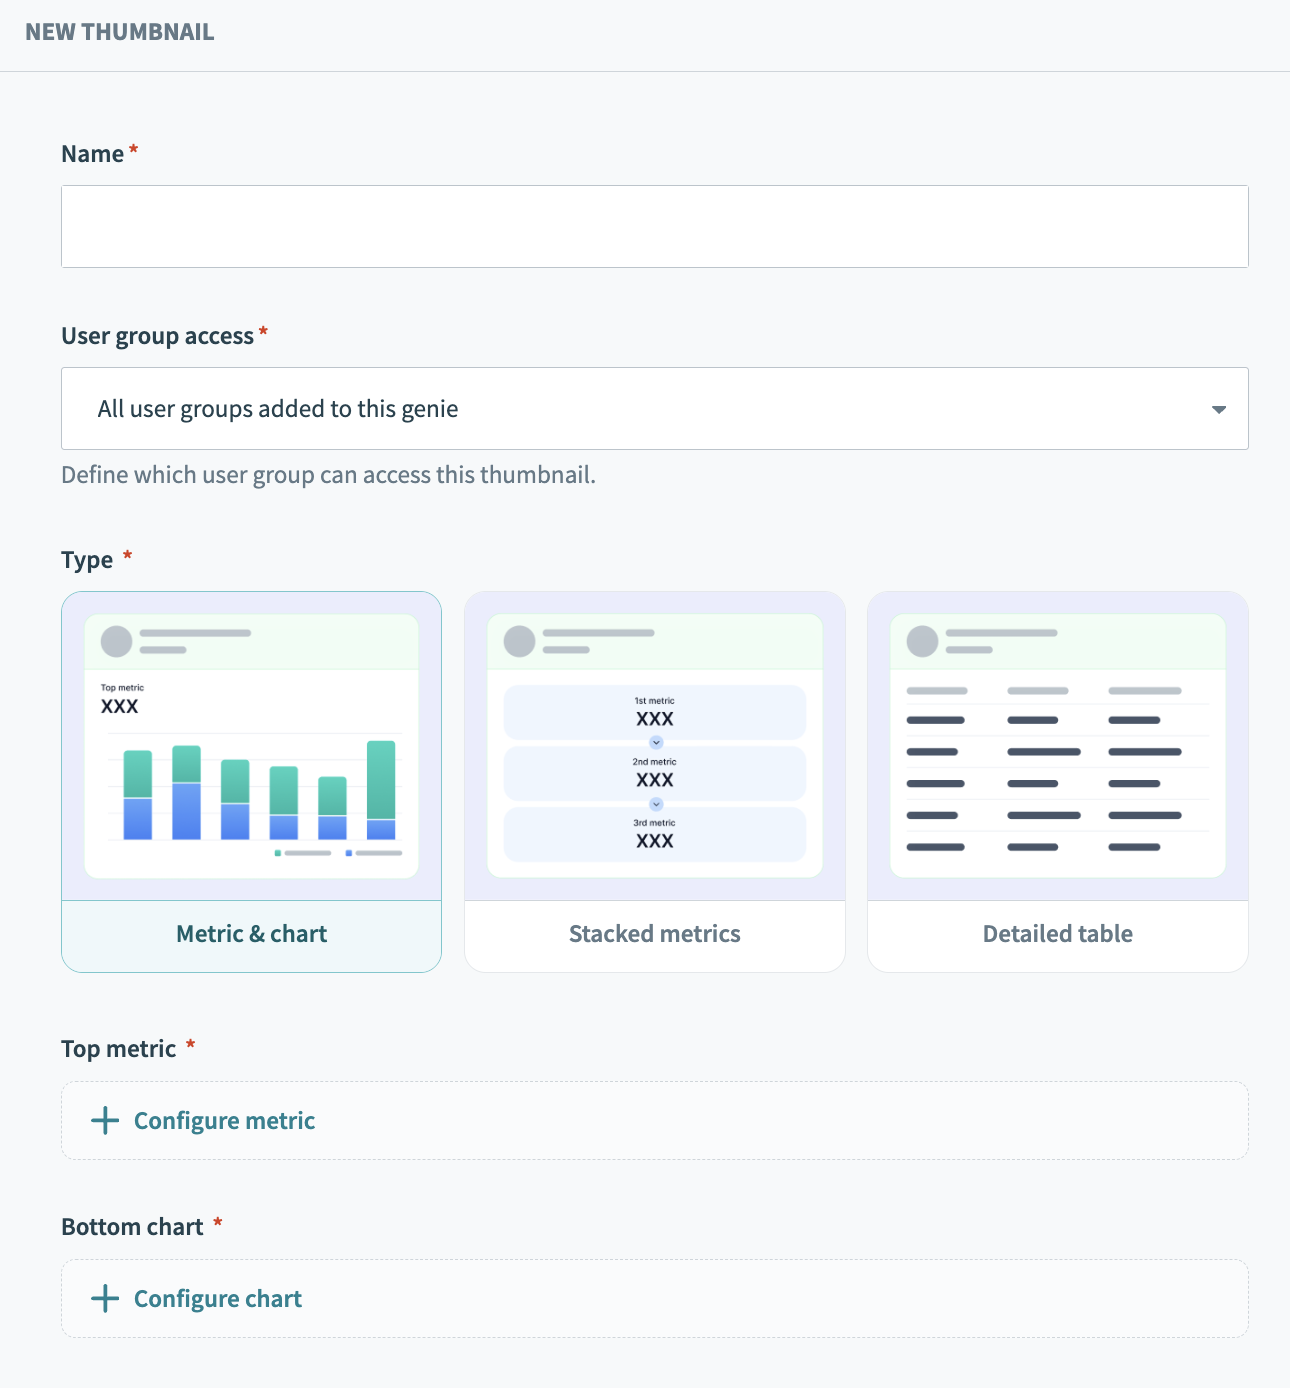 New thumbnail
9
Configure your thumbnail:
This thumbnail doesn't require configuration.
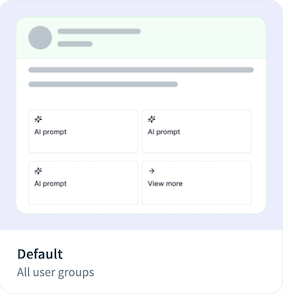 Default thumbnail
1
Enter a name for your thumbnail in the Name field.
2
Use the User group access drop-down menu to select the user groups that can view this thumbnail.
3
Go to Top metric and click + Configure metric.
4
Go to the Data query section and use the Data source drop-down menu to select the KPI you plan to use.
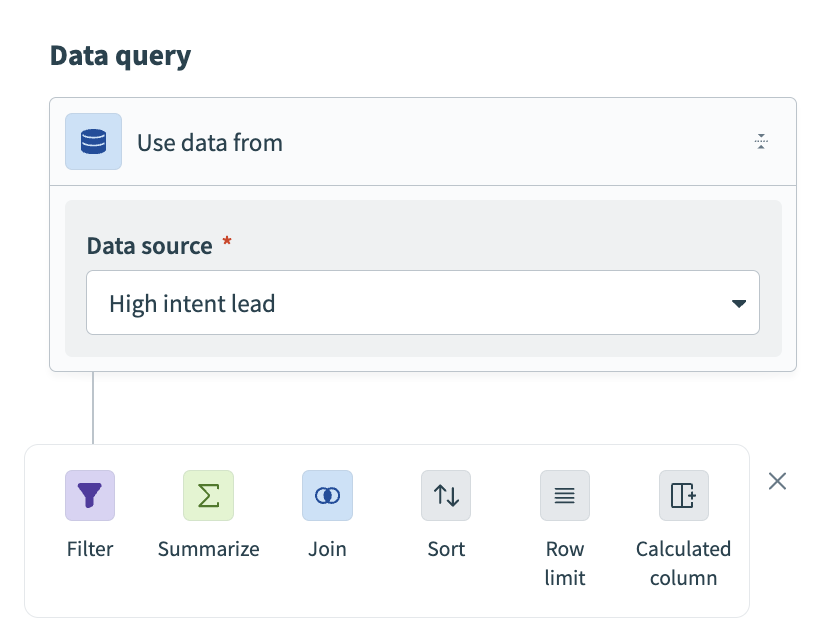 Data query section
5
Use the data configuration options to configure your thumbnail metrics using the information in the data table you created for your KPI. The following data configuration options are available:
- Filter
- Summarize
- Join
- Sort
- Row limit
- Calculated column
7
Go to Bottom chart and click + Configure chart.
8
Go to the Data query section and use the Data source drop-down menu to select the KPI you plan to use.
9
Use the data configuration options to configure your thumbnail metrics using the information in the data table you created for your KPI. The following data configuration options are available:
- Filter
- Summarize
- Join
- Sort
- Row limit
- Calculated column
10
Go to Chart settings and use the Type drop-down menu to select Bar or Line as the chart type.
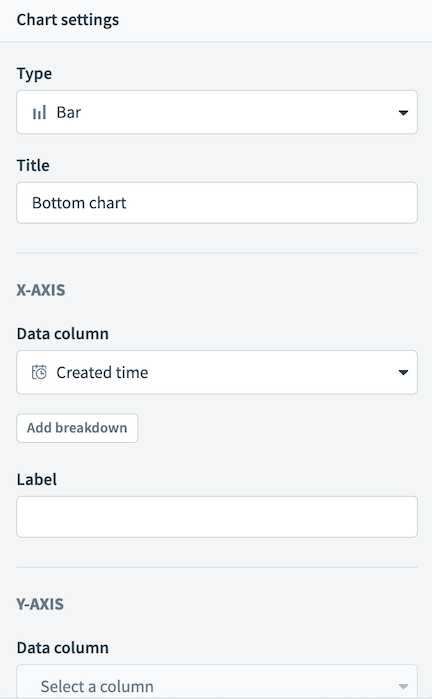 Chart settings
11
Go to X-AXIS and use the Data column drop-down menu to select the data column you plan to use for the x-axis.
12
Optional. Click Add breakdown to break down the information using metrics from a data column you specify.
13
Optional. Enter a label in the Label field.
14
Go to Y-AXIS and use the Data column drop-down menu to select the data column you plan to use for the y-axis.
15
Optional. Enter a label in the Label field.
1
Enter a name for your thumbnail in the Name field.
2
Use the User group access drop-down menu to select the user groups that can view this thumbnail.
3
Go to 1st metric and click + Configure metric.
4
Go to the Data query section and use the Data source drop-down menu to select the KPI you plan to use.
Data query section
5
Use the data configuration options to configure your thumbnail metrics using the information in the data table you created for your KPI. The following data configuration options are available:
- Filter
- Summarize
- Join
- Sort
- Row limit
- Calculated column
7
Go to 2nd metric and click + Configure chart.
8
Go to the Data query section and use the Data source drop-down menu to select the KPI you plan to use.
9
Use the data configuration options to configure your thumbnail metrics using the information in the data table you created for your KPI. The following data configuration options are available:
- Filter
- Summarize
- Join
- Sort
- Row limit
- Calculated column
11
Go to 3rd metric and click + Configure chart.
12
Go to the Data query section and use the Data source drop-down menu to select the KPI you plan to use.
13
Use the data configuration options to configure your thumbnail metrics using the information in the data table you created for your KPI. The following data configuration options are available:
- Filter
- Summarize
- Join
- Sort
- Row limit
- Calculated column
1
Enter a name for your thumbnail in the Name field.
2
Use the User group access drop-down menu to select the user groups that can view this thumbnail.
3
Go to Table and click + Configure table.
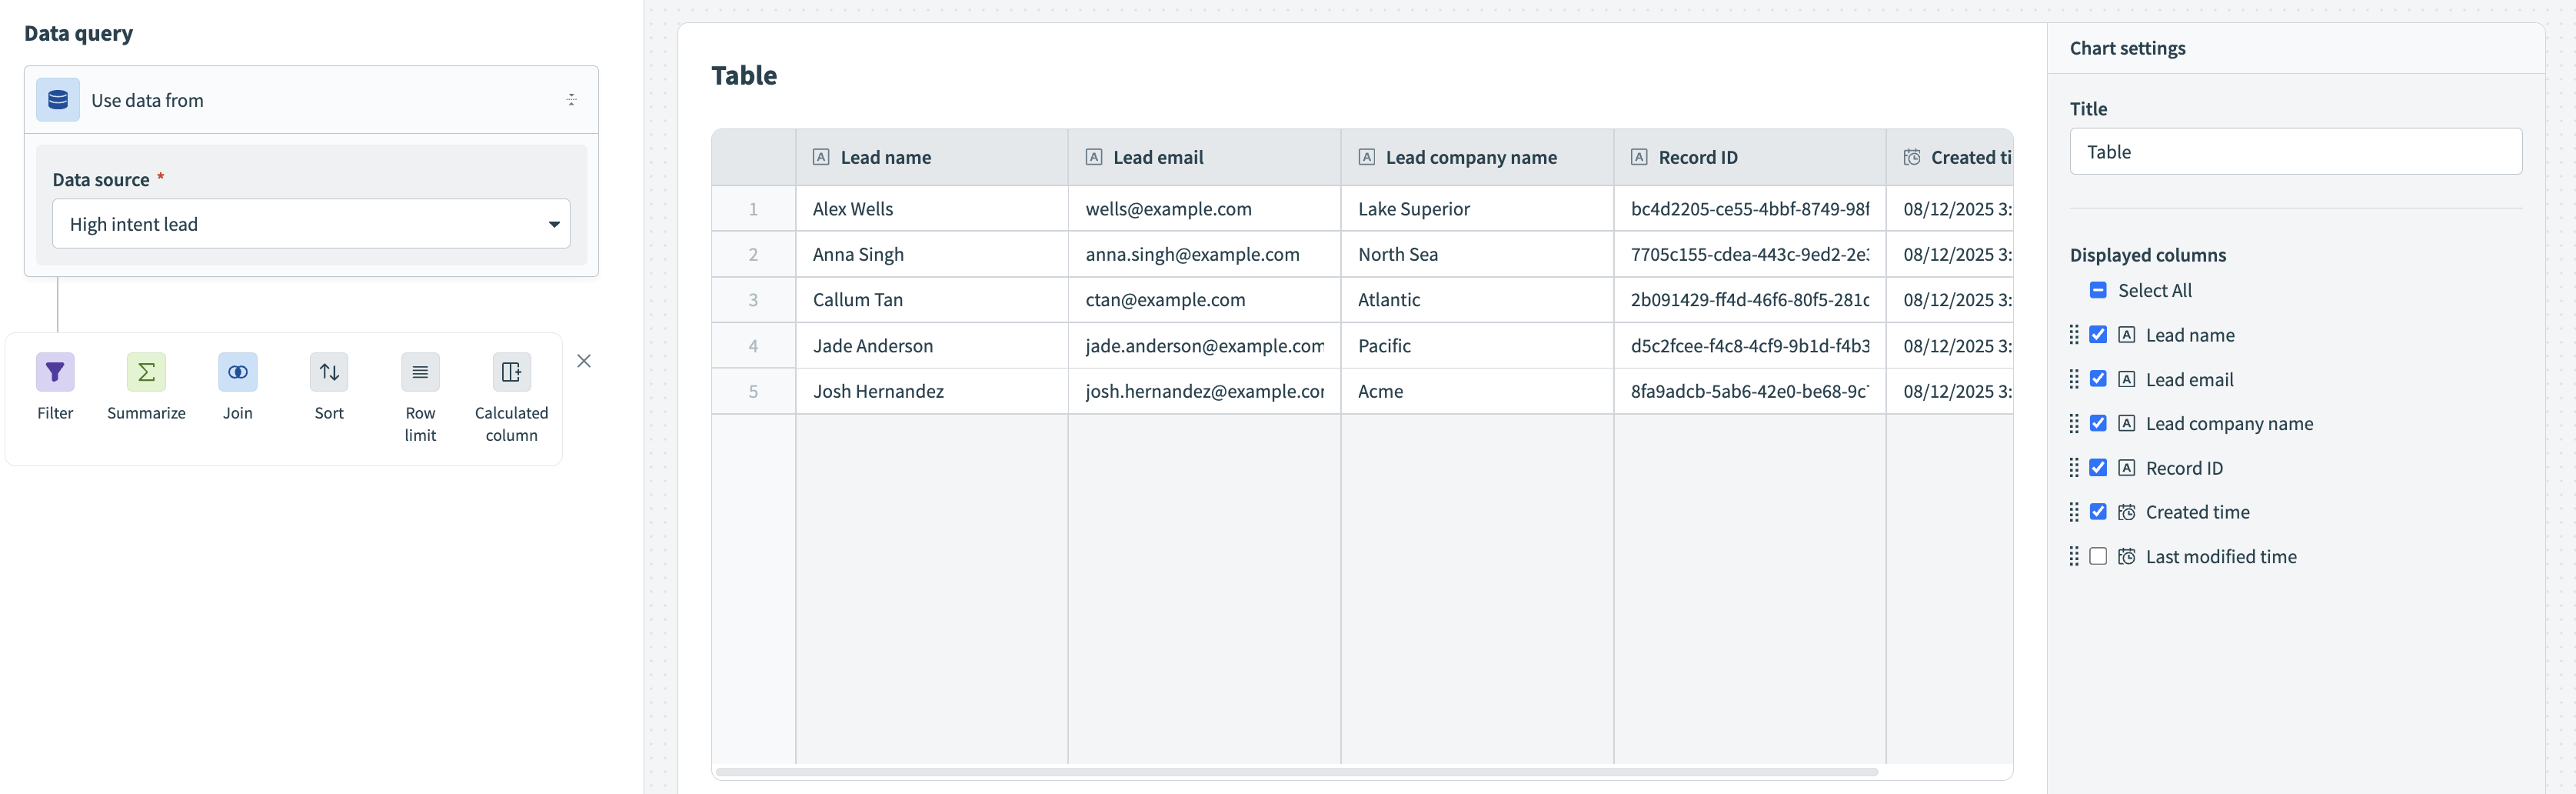 Table configuration
4
Use the data configuration options to configure your thumbnail table. The following data configuration options are available:
- Filter
- Summarize
- Join
- Sort
- Row limit
- Calculated column
5
Go to Chart settings and enter a title for your table in the Title field.
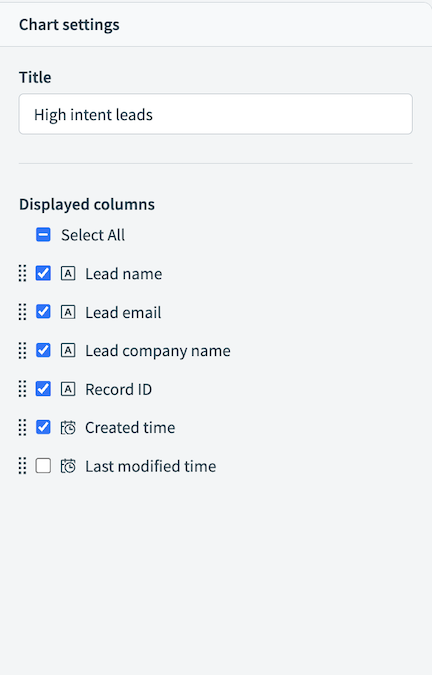 Table chart settings
6
Go to Displayed columns and click the checkboxes to include or exclude columns from your table.
10
Optional. Go to Workato GO to view your Action Board.
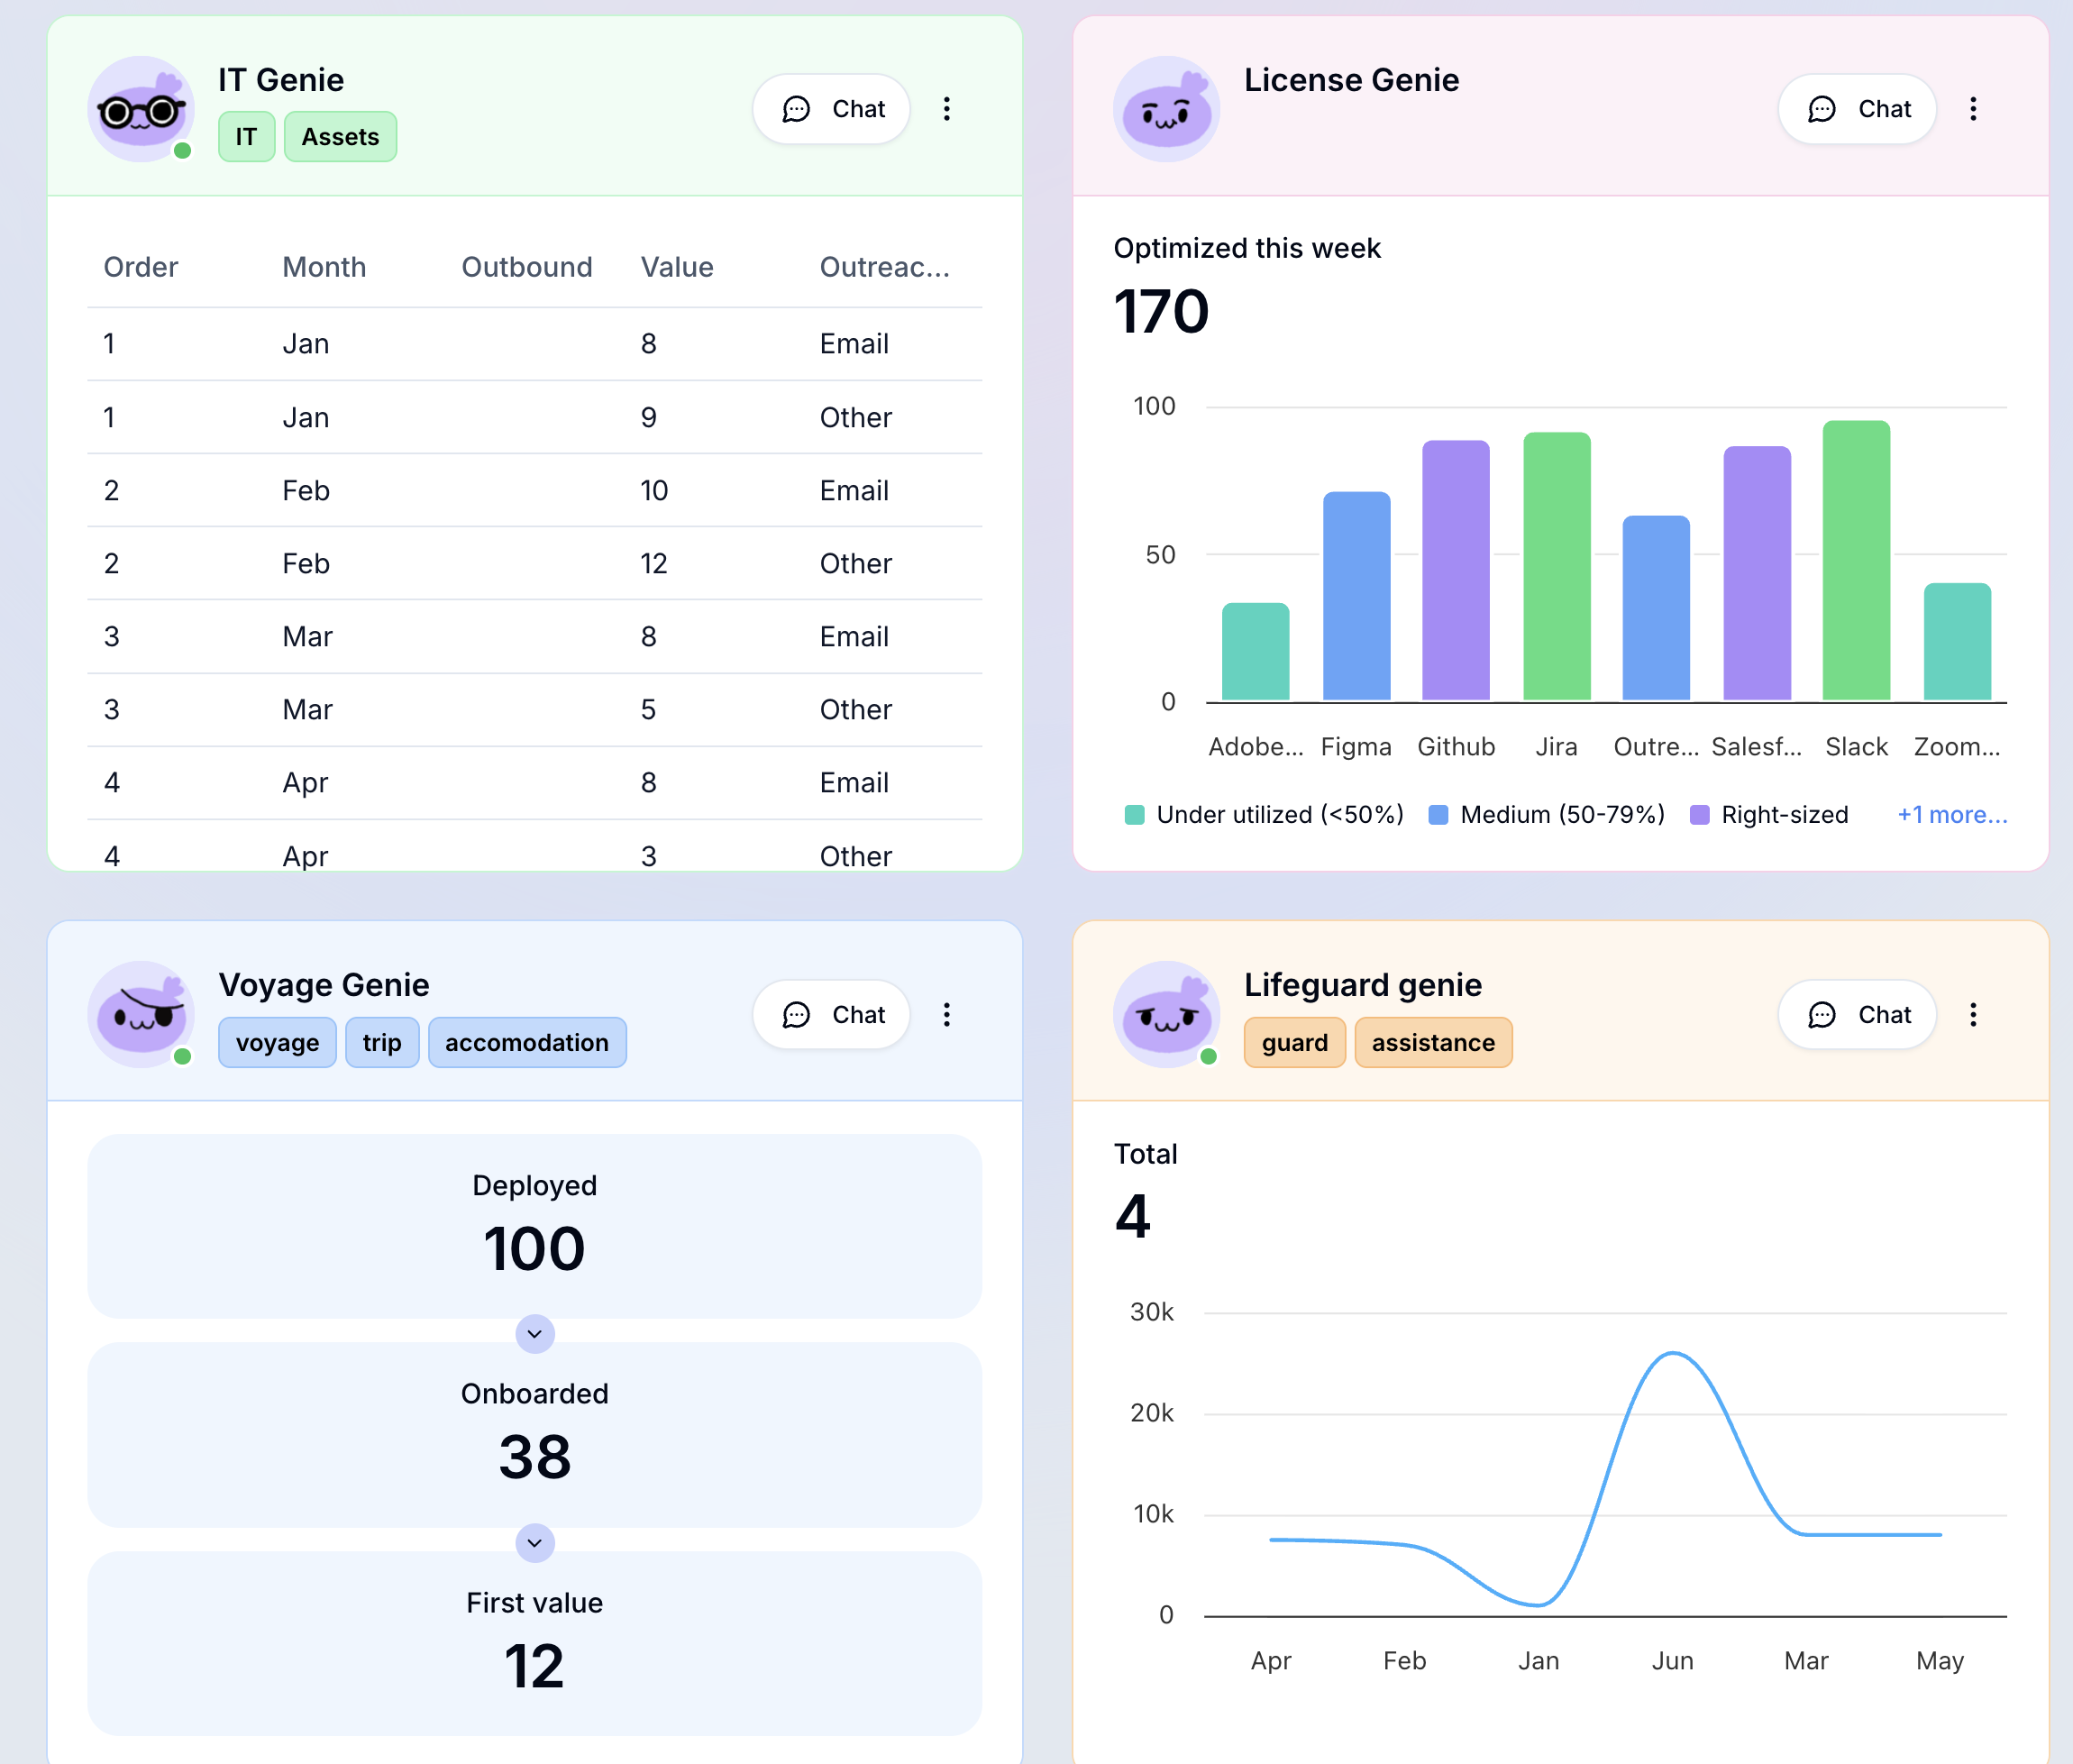 Action Board in Workato GO