AI usage
AI usage provides a centralized view of AI token and request activity across every workspace linked to your Control plane. Use AI usage to see where usage originates, who's driving it, and what's consuming it, across Model Gateway routes, MCP servers, and agents.
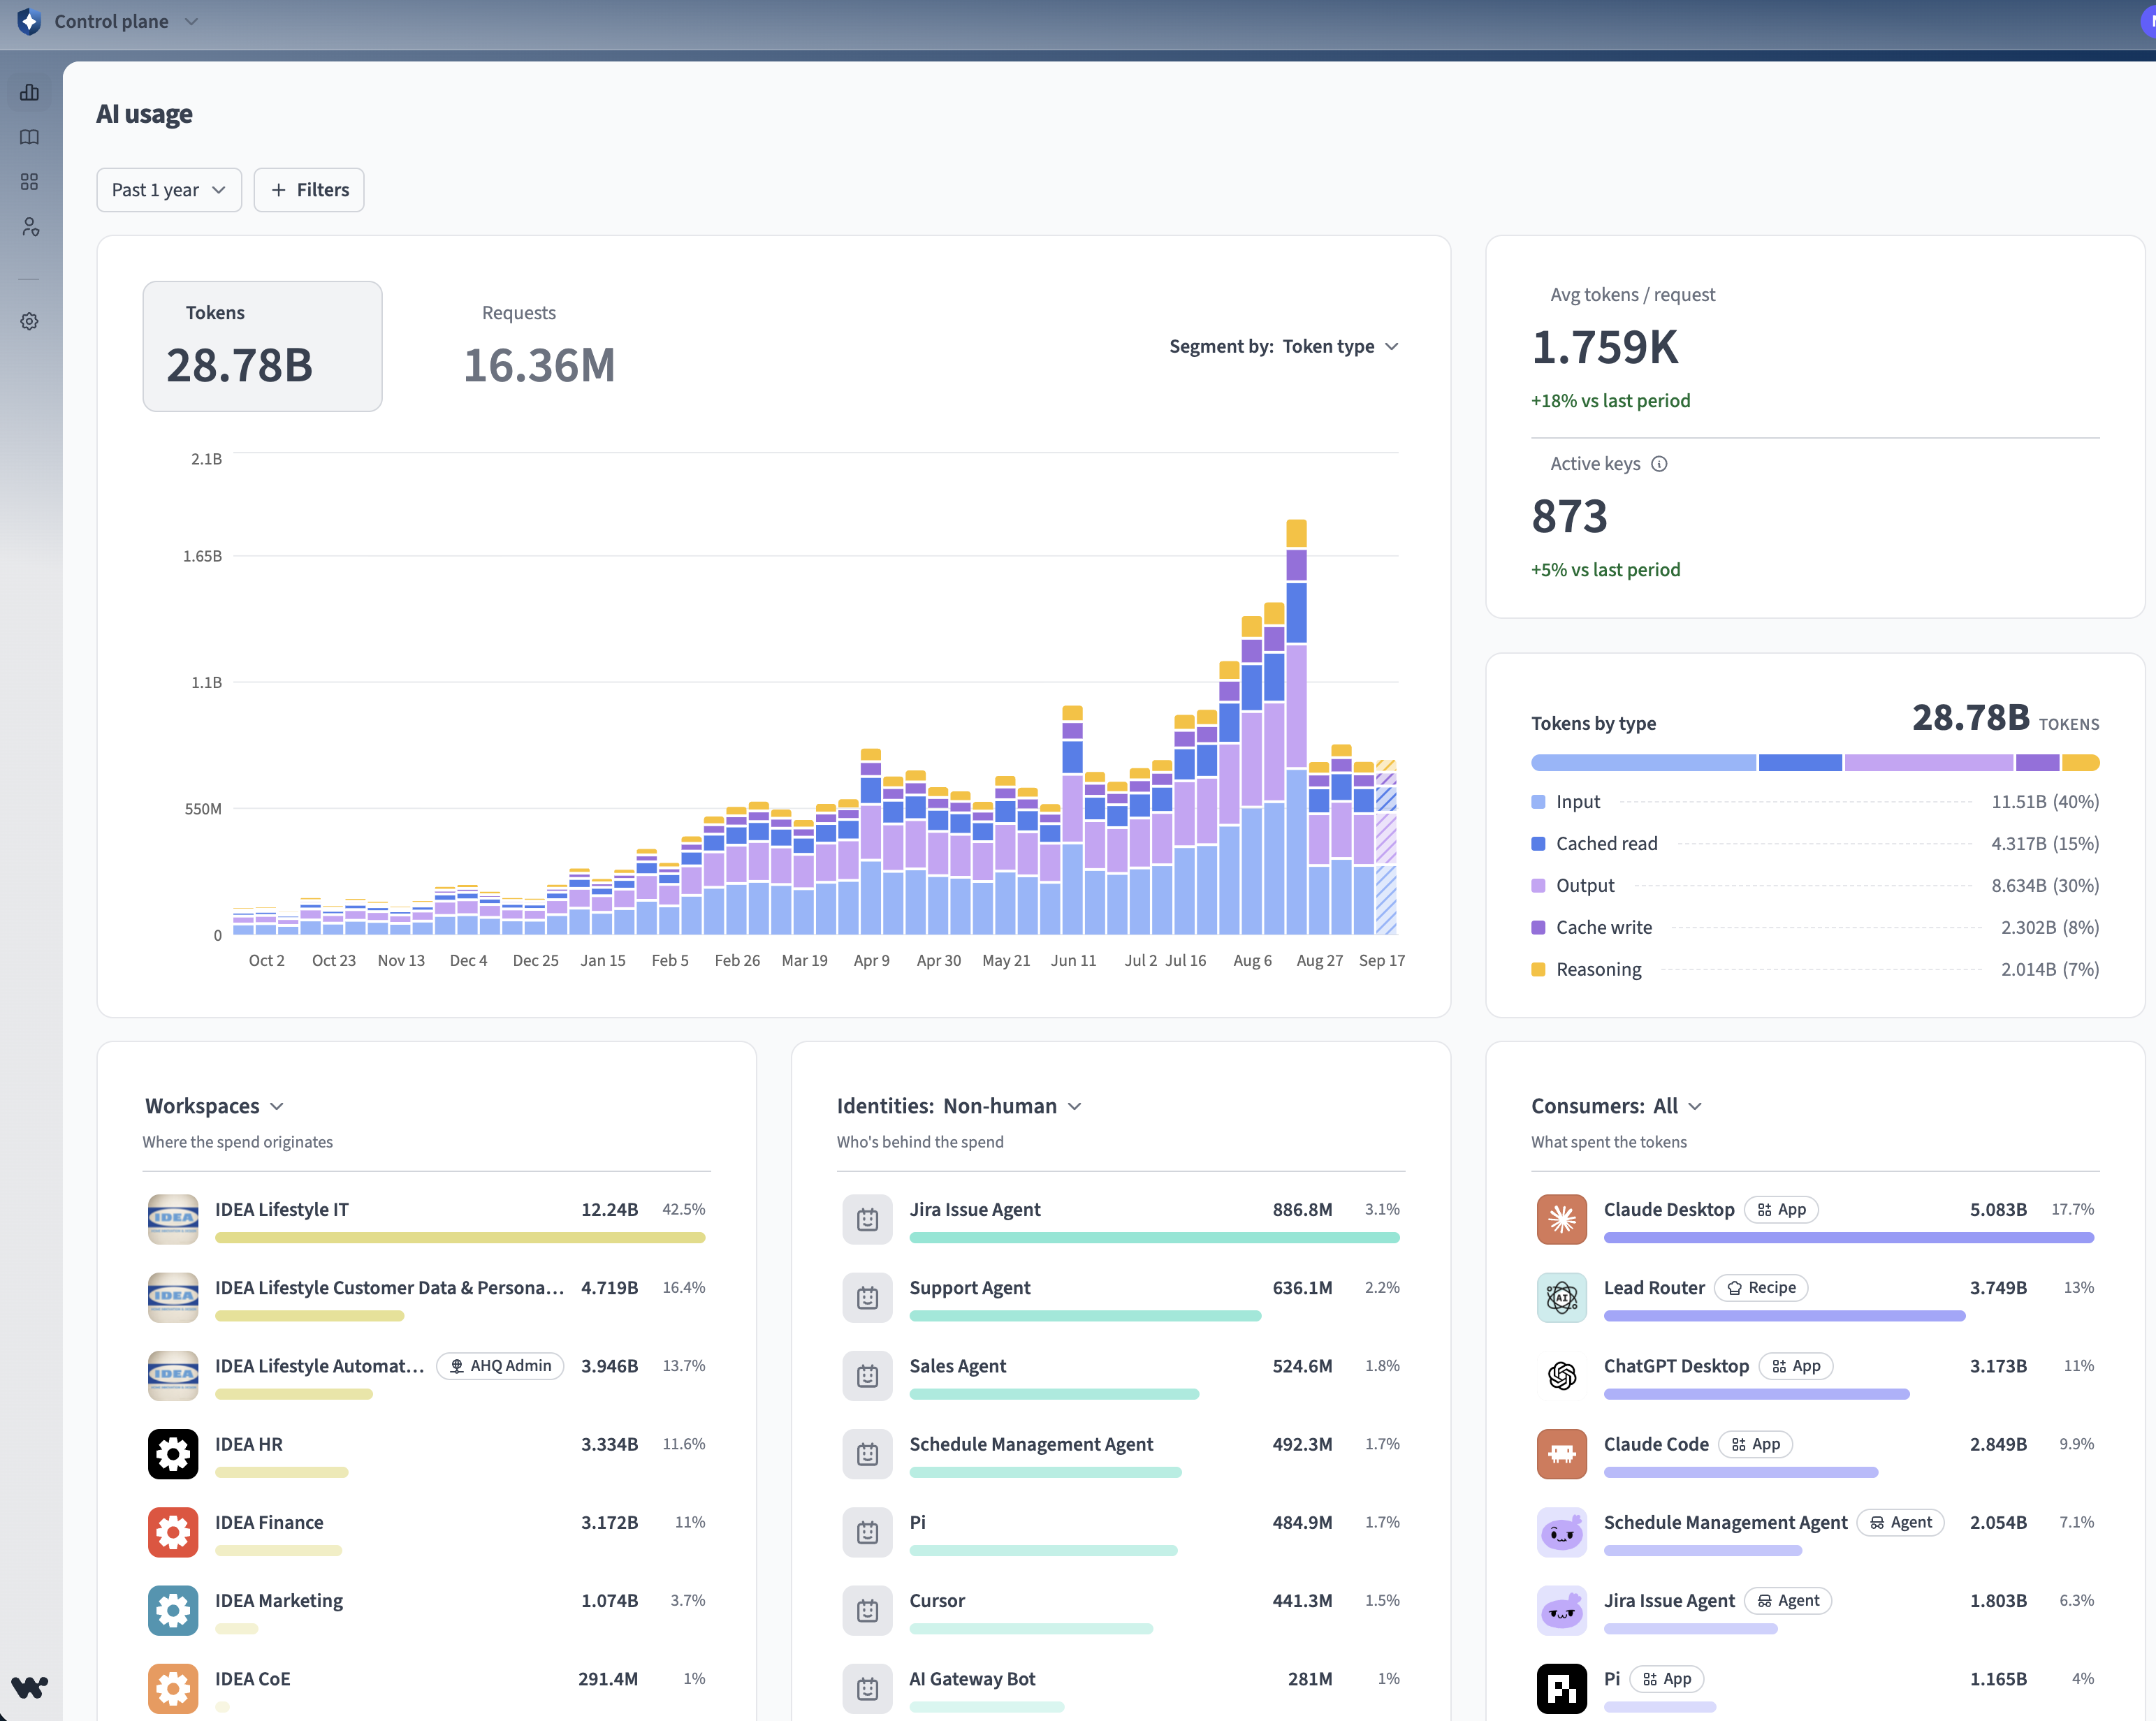 AI usage overview
Access AI usage
Complete the following steps to access AI usage:
Sign in to your Workato account.
Expand the workspaces menu.
Click Control plane.
Sign in using your Control plane credentials or SSO.
Click AI usage in the side navigation menu.
Time range and filters
Use the time range drop-down menu to scope AI usage to a specific window, from the past 15 minutes up to the past year.
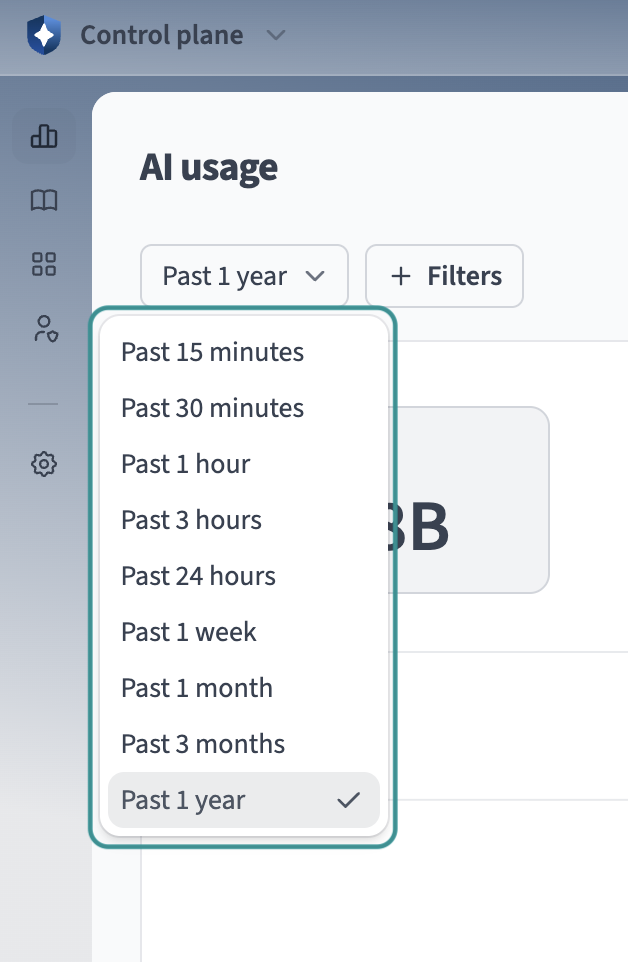 Time range drop-down menu
Click + Filters to narrow the entire page to specific values across the following dimensions:
- Workspace
- Environment
- Business unit
- Route
- Model
- Consumer
- Identities
- User
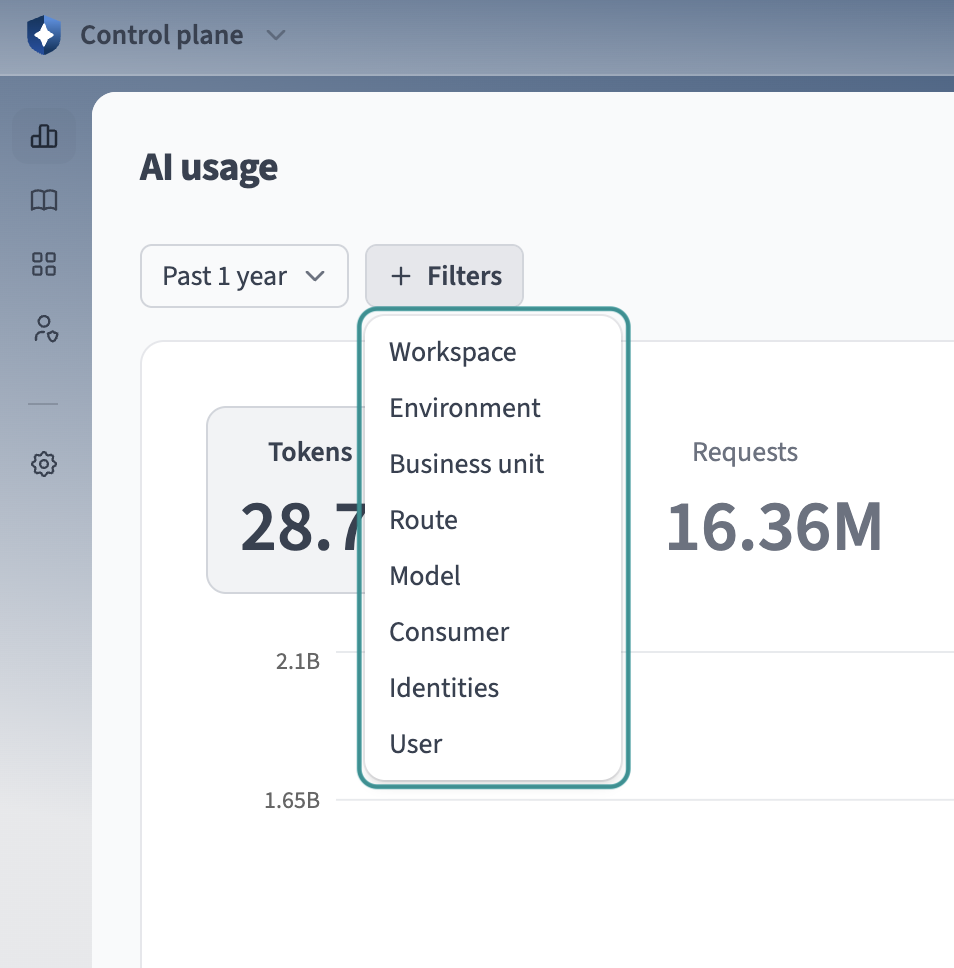 Filters menu with the available dimensions
Usage overview
The usage overview chart plots activity over the selected time range. Click Tokens or Requests to switch which metric drives the chart and its accompanying breakdown.
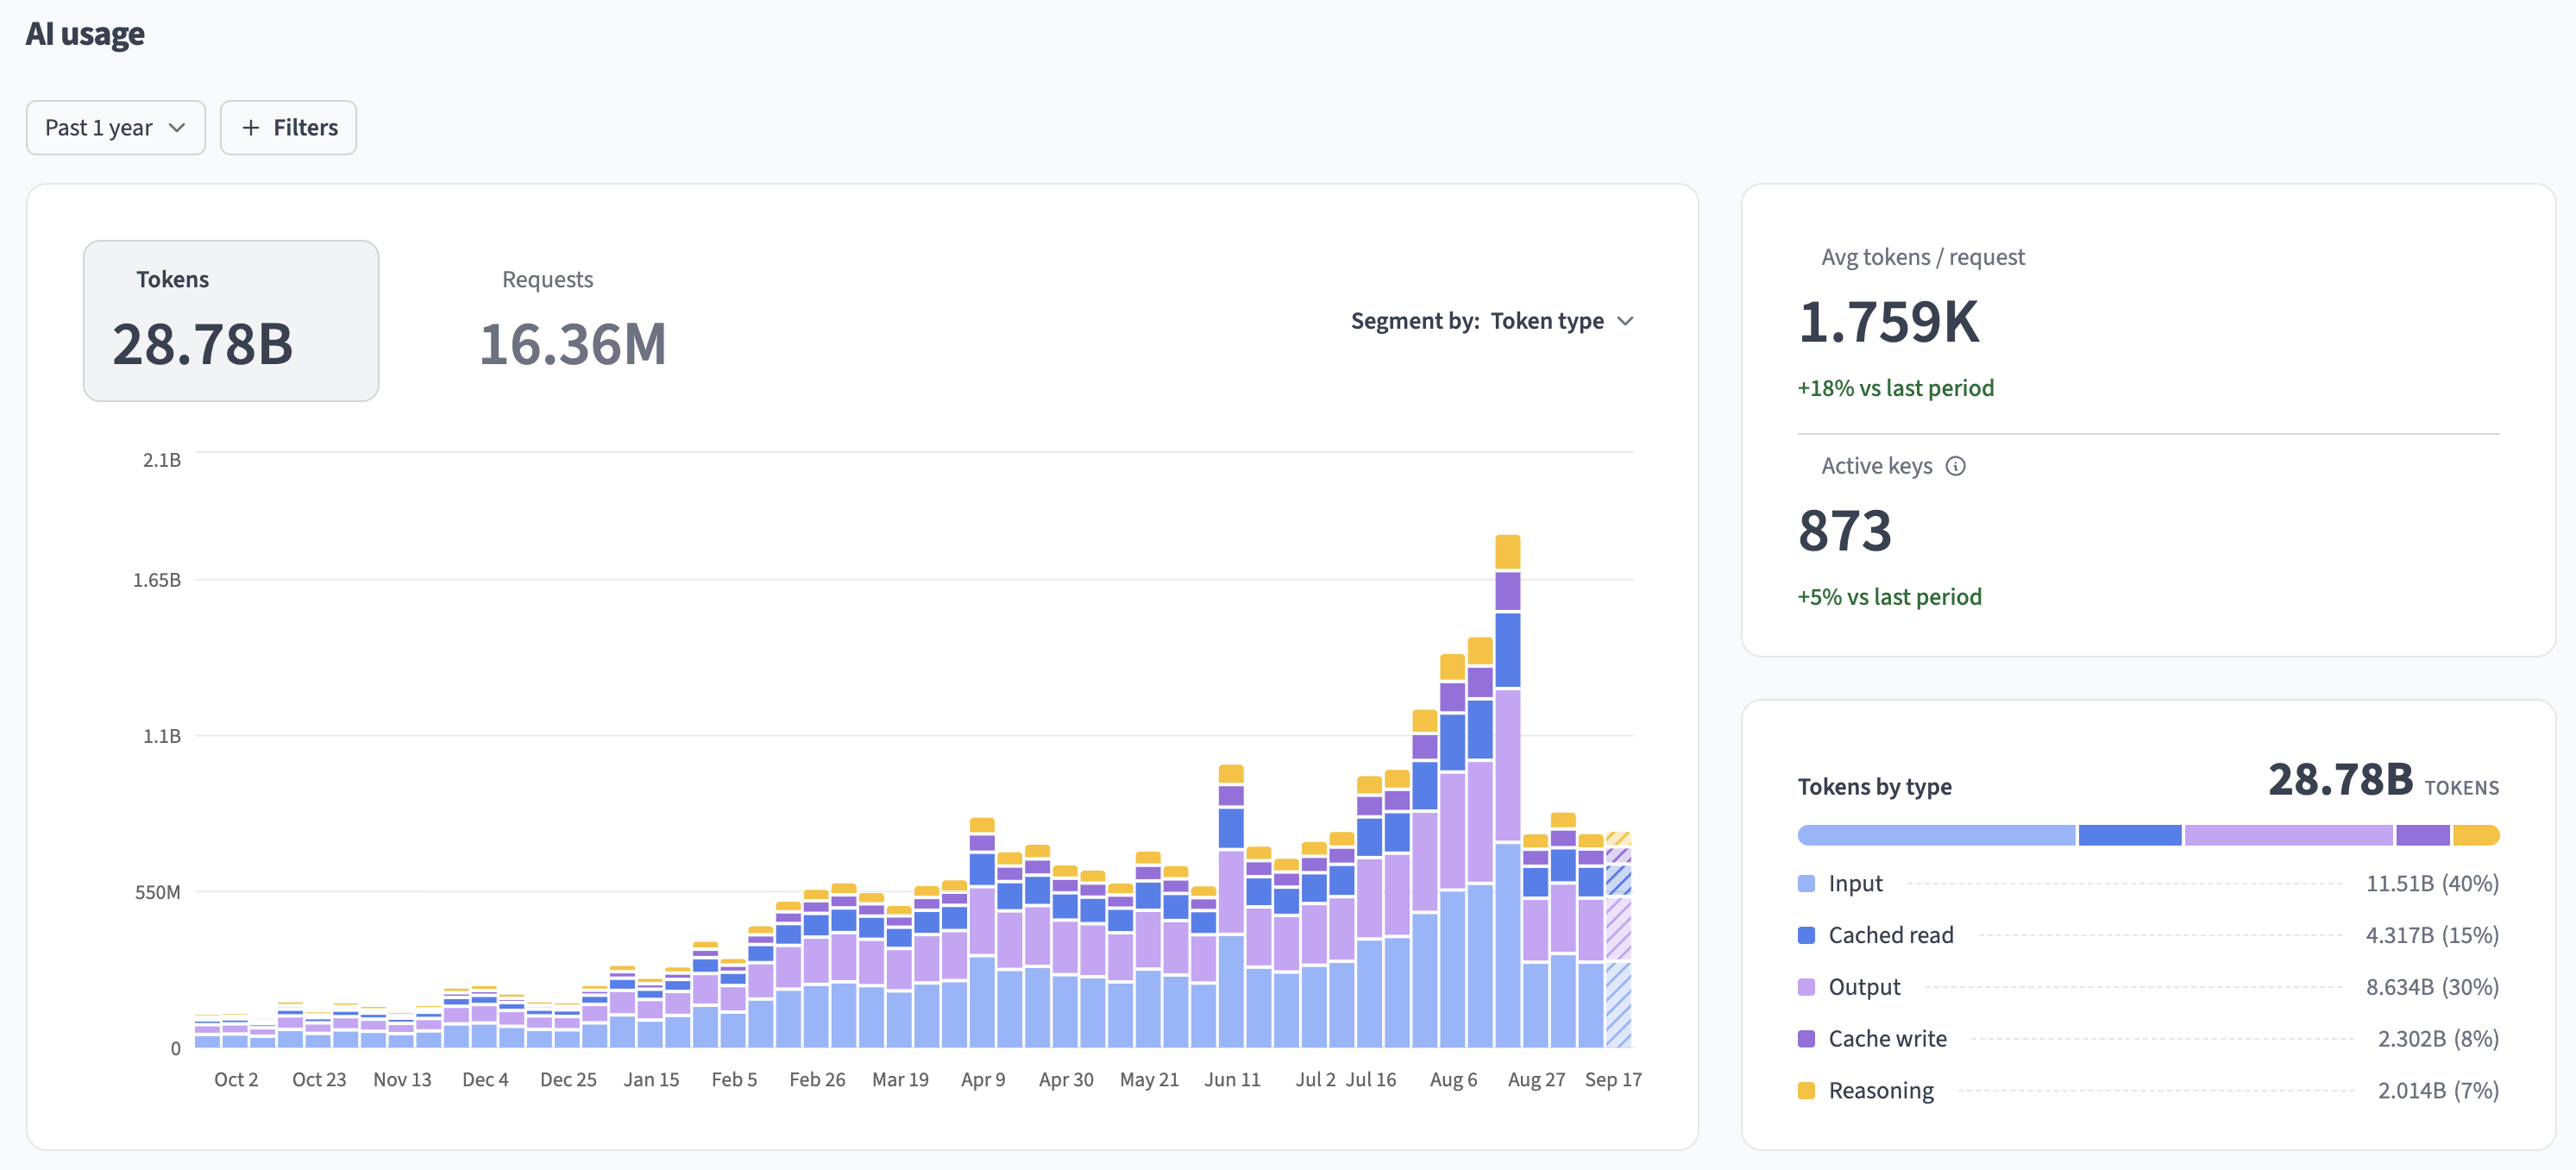 Tokens by type breakdown
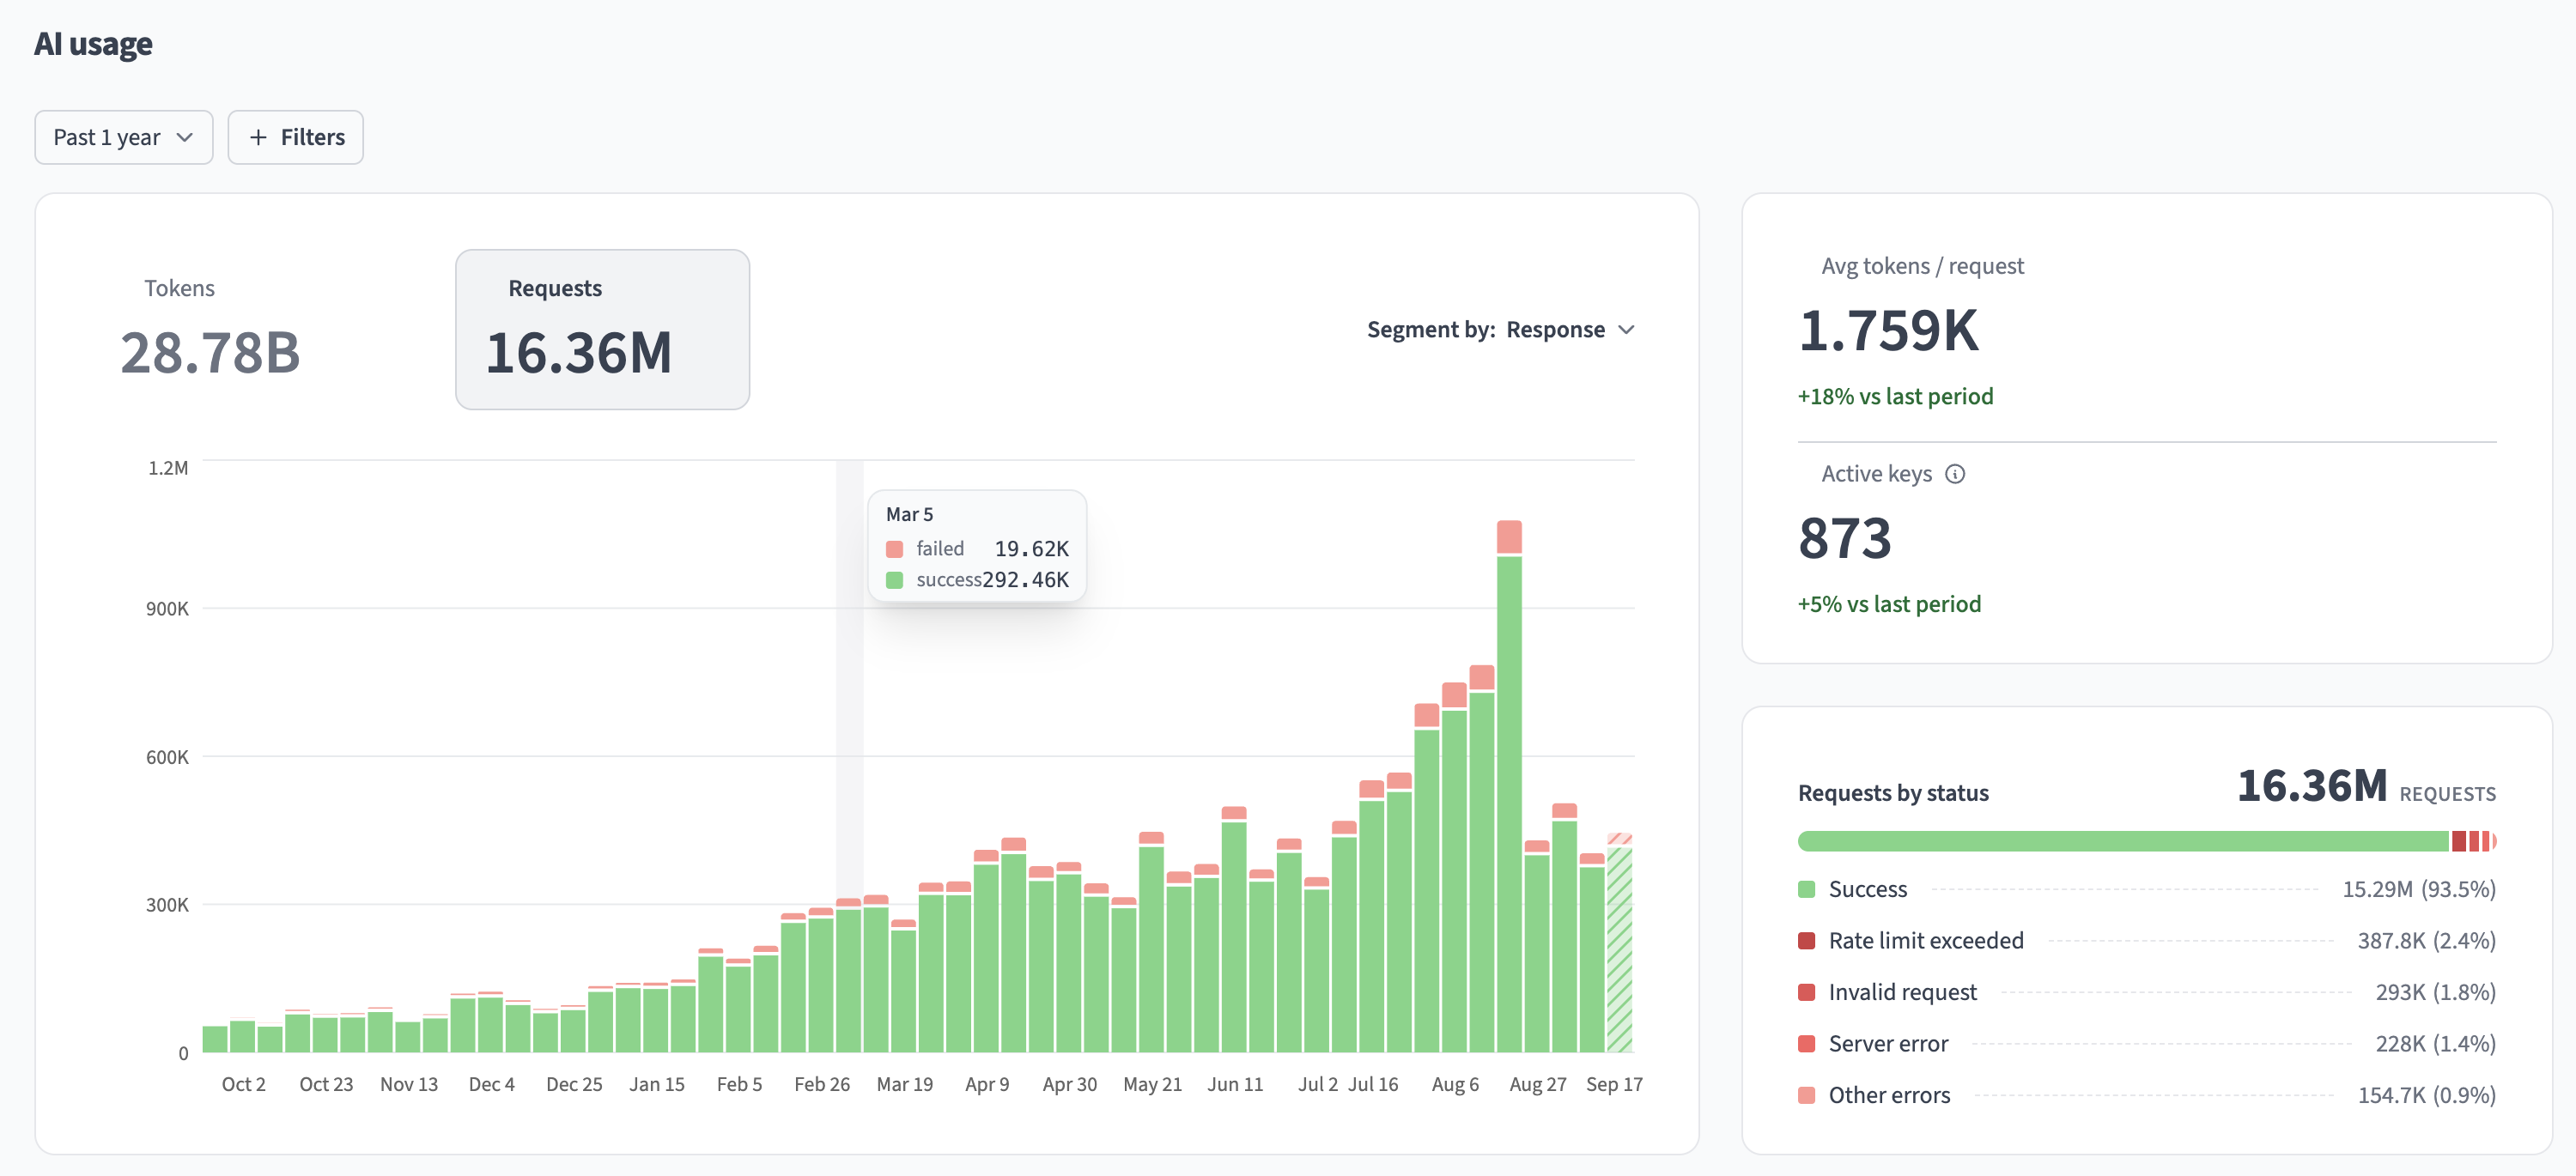 Requests by status breakdown
AI usage also displays the following metrics for the selected period, each with a percentage change compared to the previous period:
- Avg tokens / request: The average number of tokens consumed per request.
- Active keys: The number of API keys that made at least one request in the selected period.
Segment the chart
Use the Segment by drop-down menu above the chart to change how chart bars are broken down. Available dimensions include:
Token type (Tokens only): Input, Cached read, Output, Cached write, and Reasoning tokens.
Response (Requests only): Success, Rate limit exceeded, Invalid request, Server error, and Other errors.
Workspace: The workspace where the usage originates.
Environment: The Environment (DEV, TEST, or PROD) the usage occurred in.
Route: The Model Gateway route that handled the request.
Model: The underlying AI model that served the request.
Consumer: The app, agent, recipe, or direct API key that made the request.
Hover over a bar to see the exact values behind it for that interval. The remaining values are grouped into Everything else when a dimension has more distinct values than the chart can display individually.
For example, segmenting the Tokens chart by Model shows how token consumption splits across models:
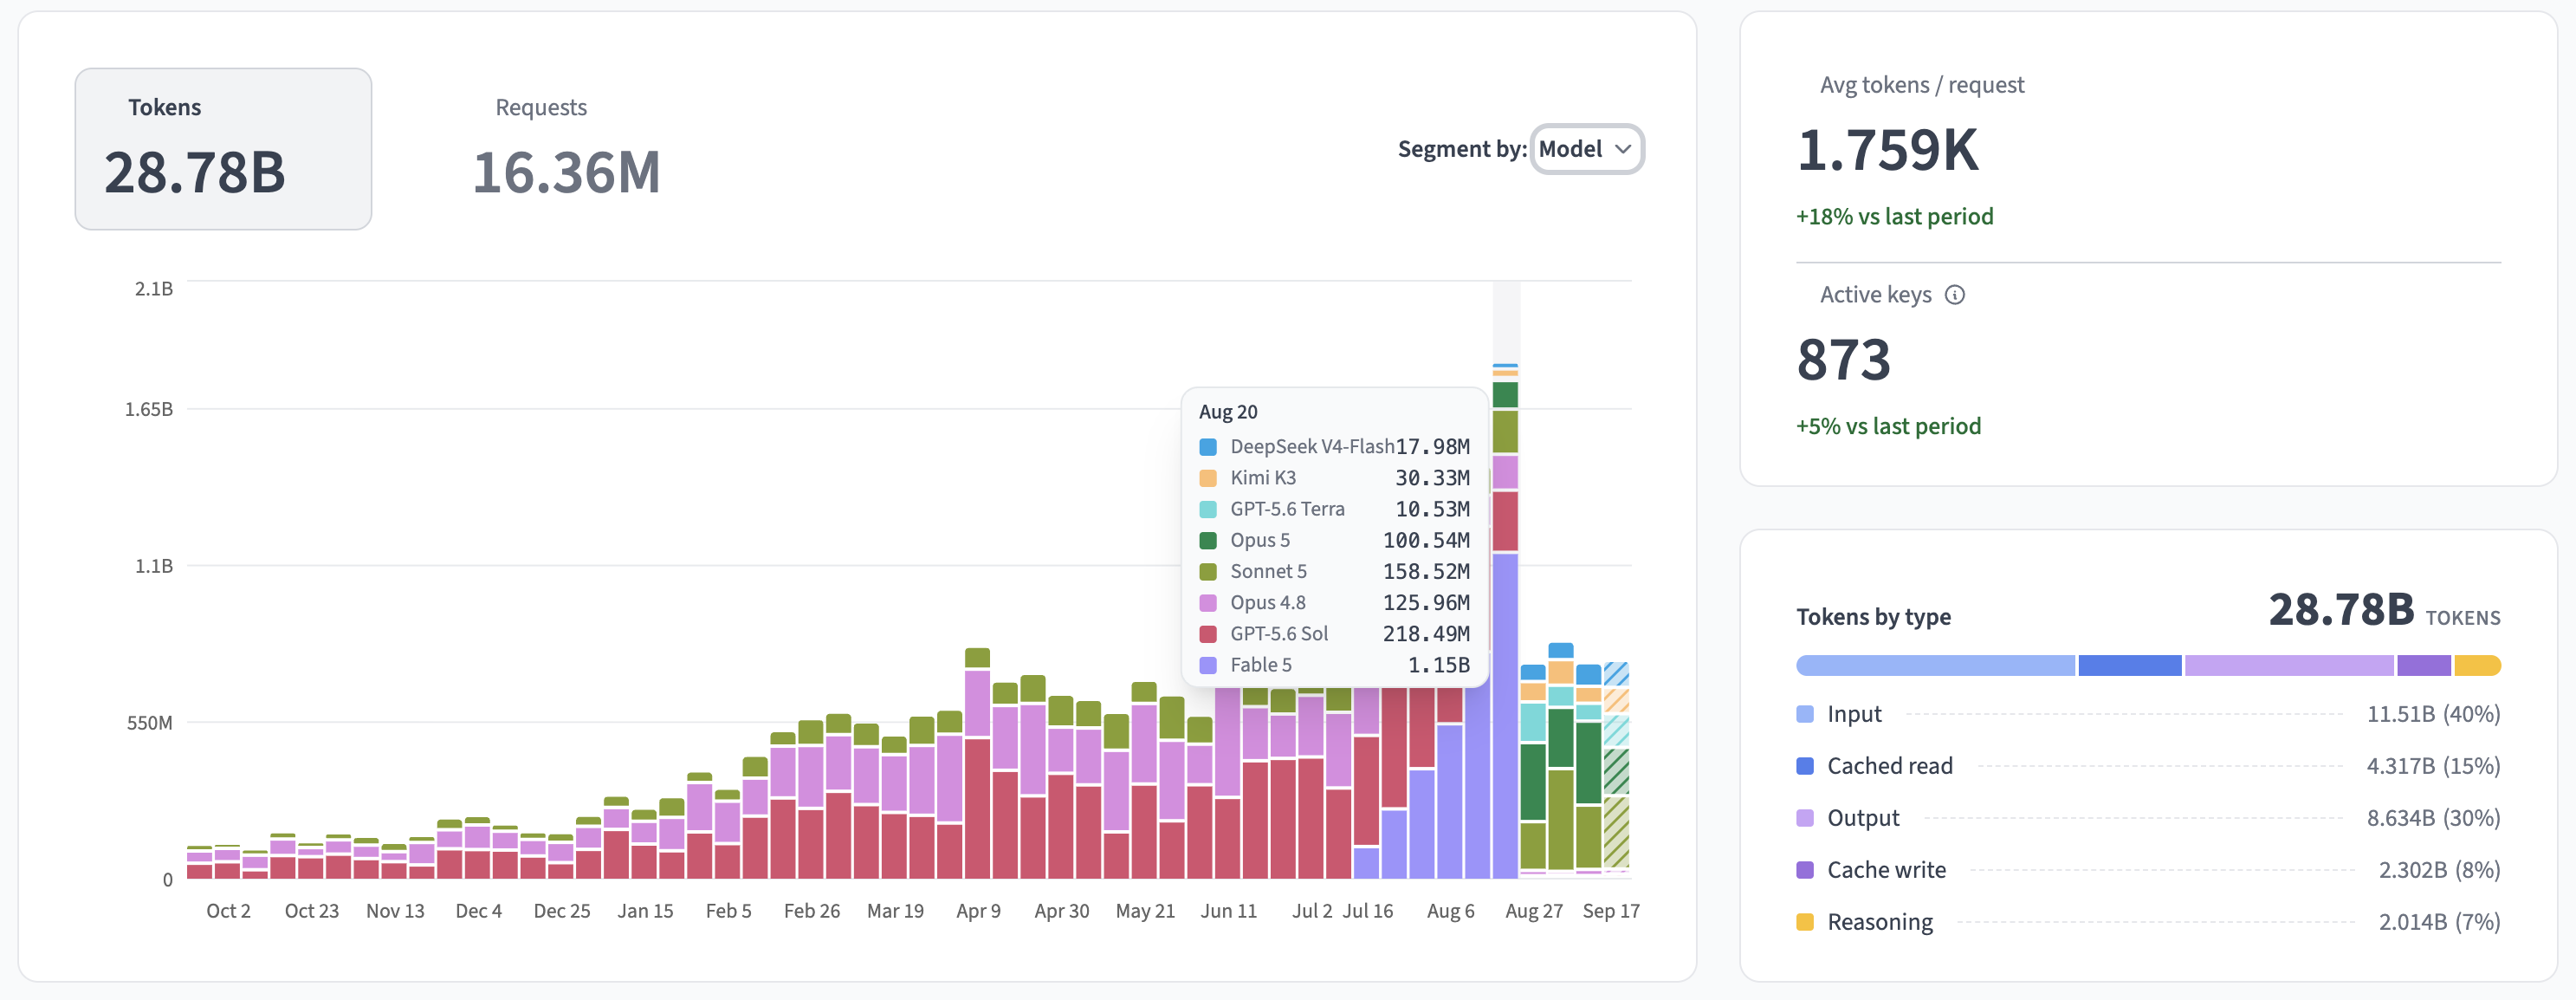 Tokens chart segmented by Model
Segmenting the Requests chart by Route instead shows how request volume splits across routes:
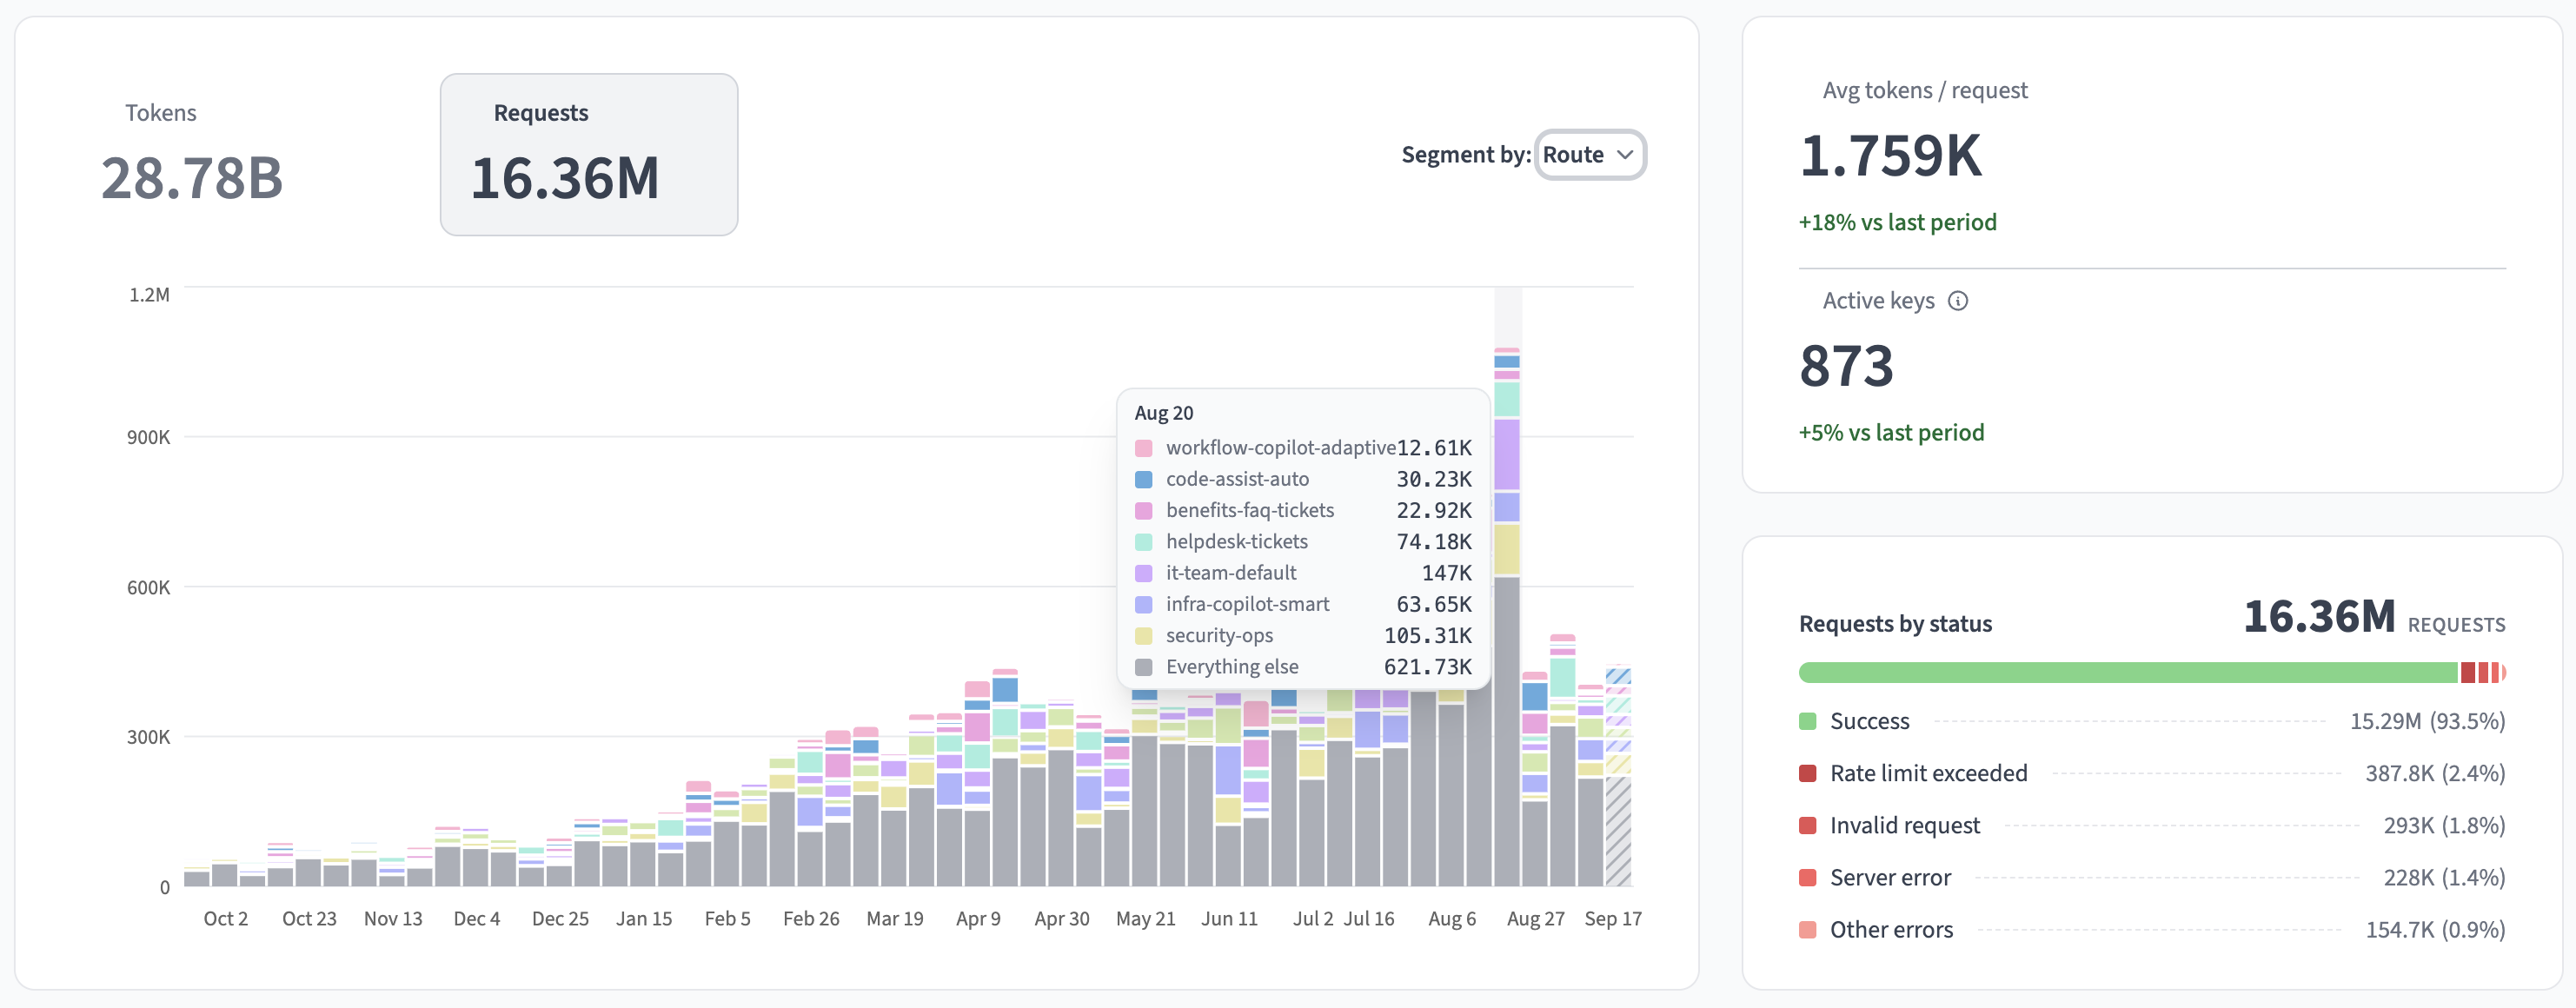 Requests chart segmented by Route
Usage breakdown
AI usage breaks down activity into three panels. Each panel lists the top contributors for the selected period and a summary of how much of the total they represent.
Workspaces
The Workspaces panel displays where usage originates. Use the drop-down menu to select breakdowns for Environments, Models, or Routes.
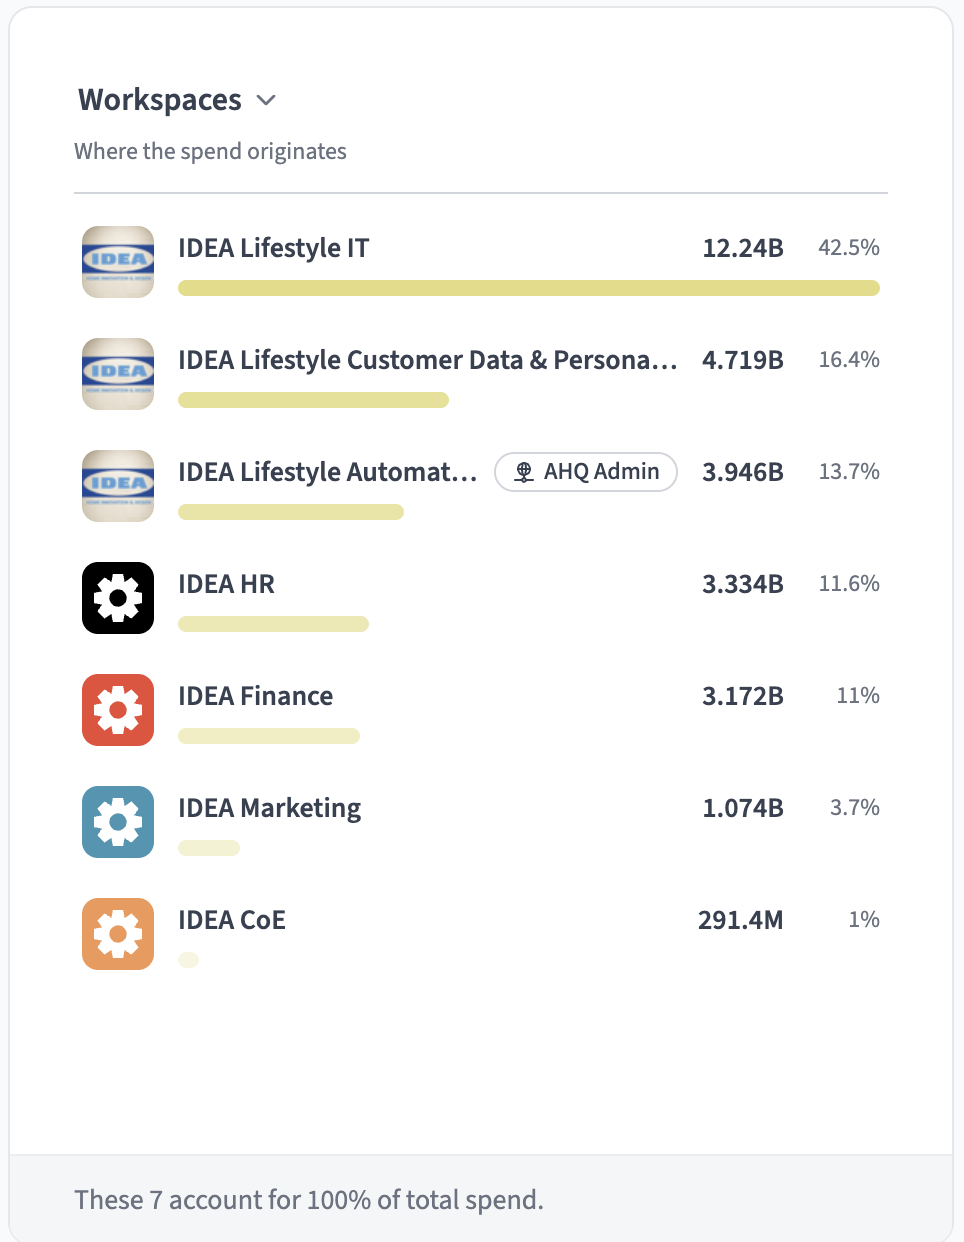 Workspaces breakdown panel
Identities
The Identities panel displays who's behind the usage. Use the drop-down menu to select breakdowns for User or Non-human identities. The panel also reports what portion of spend is attributable to a named identity versus machine-driven, for example, usage from service accounts or automated agents rather than a signed-in user.
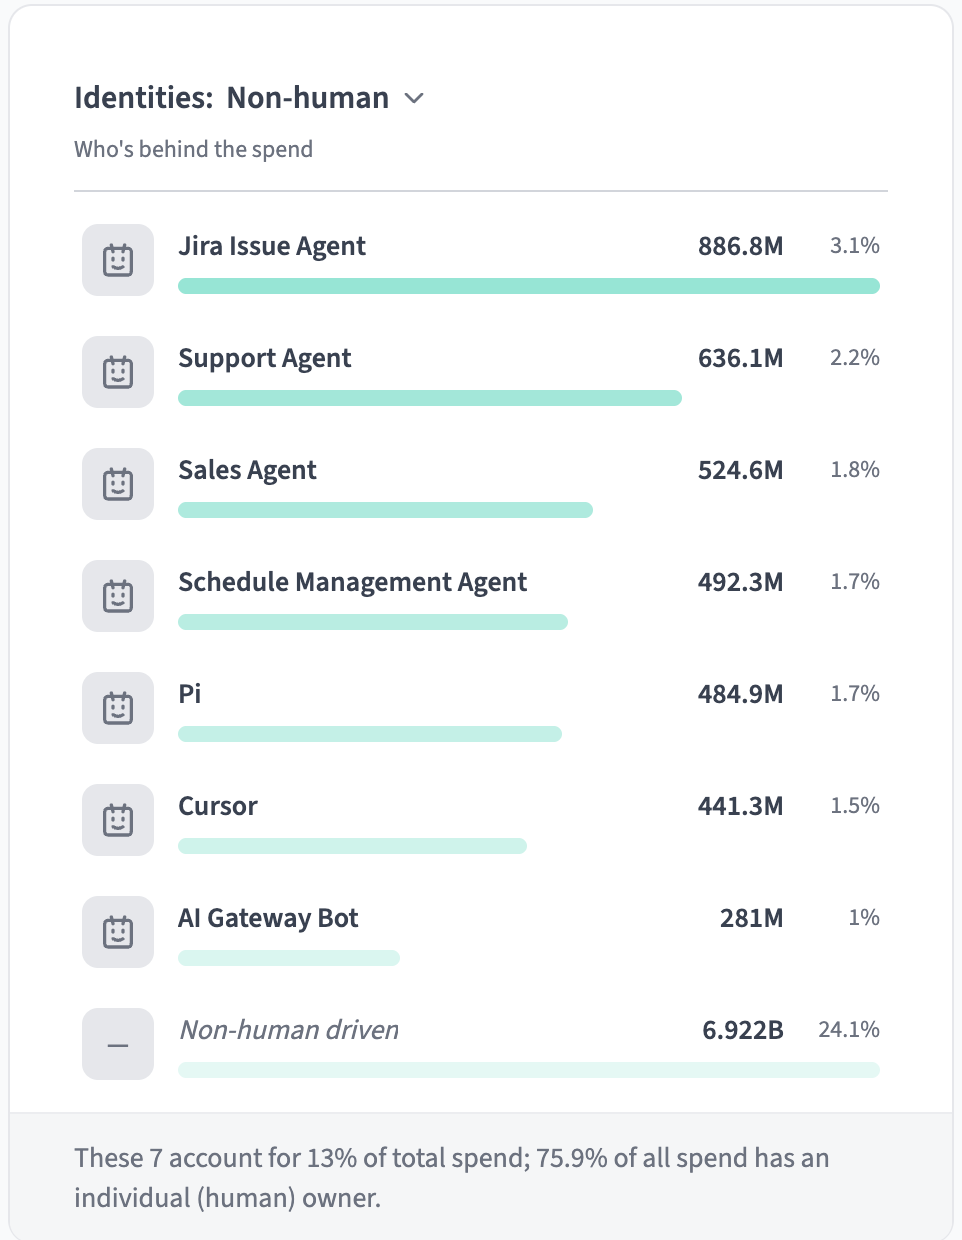 Identities breakdown panel
Consumers
The Consumers panel shows what's consuming tokens. Use the drop-down menu to select breakdowns for Apps, Agents, Recipes, or Direct API:
- Apps, Agents, and Recipes: Group usage by the client application, agent, or recipe making the request, aggregated across everyone who uses it.
- Direct API: Lists individual API keys used to call the Model Gateway directly. Each entry shows the key's label and the collaborator who created it.
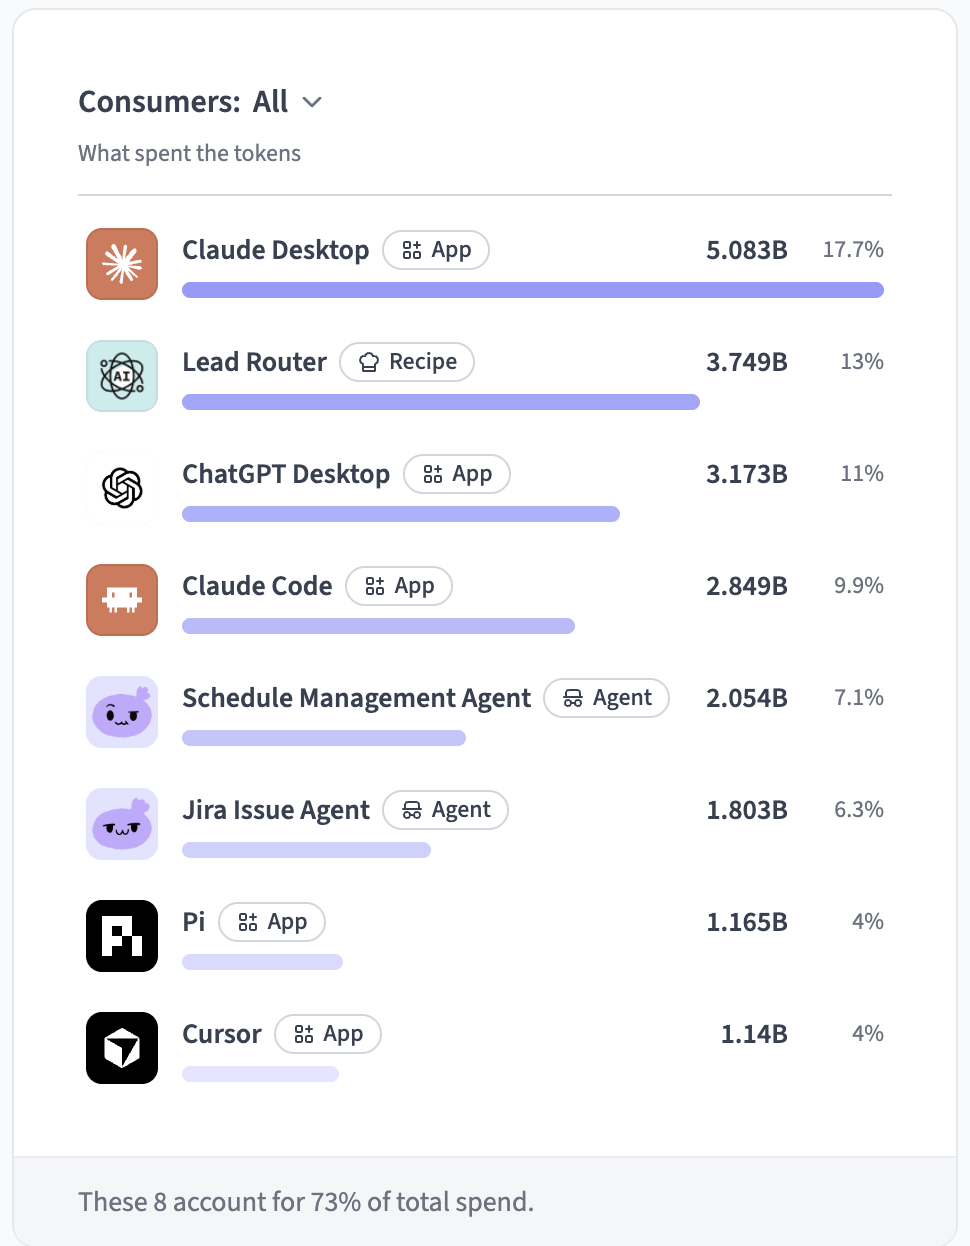 Consumers breakdown panel
Last updated: