# Overview page
The Overview page shows your genie's AI model, chat interface, job description, skills, knowledge bases, and app events.
# Overview page metrics
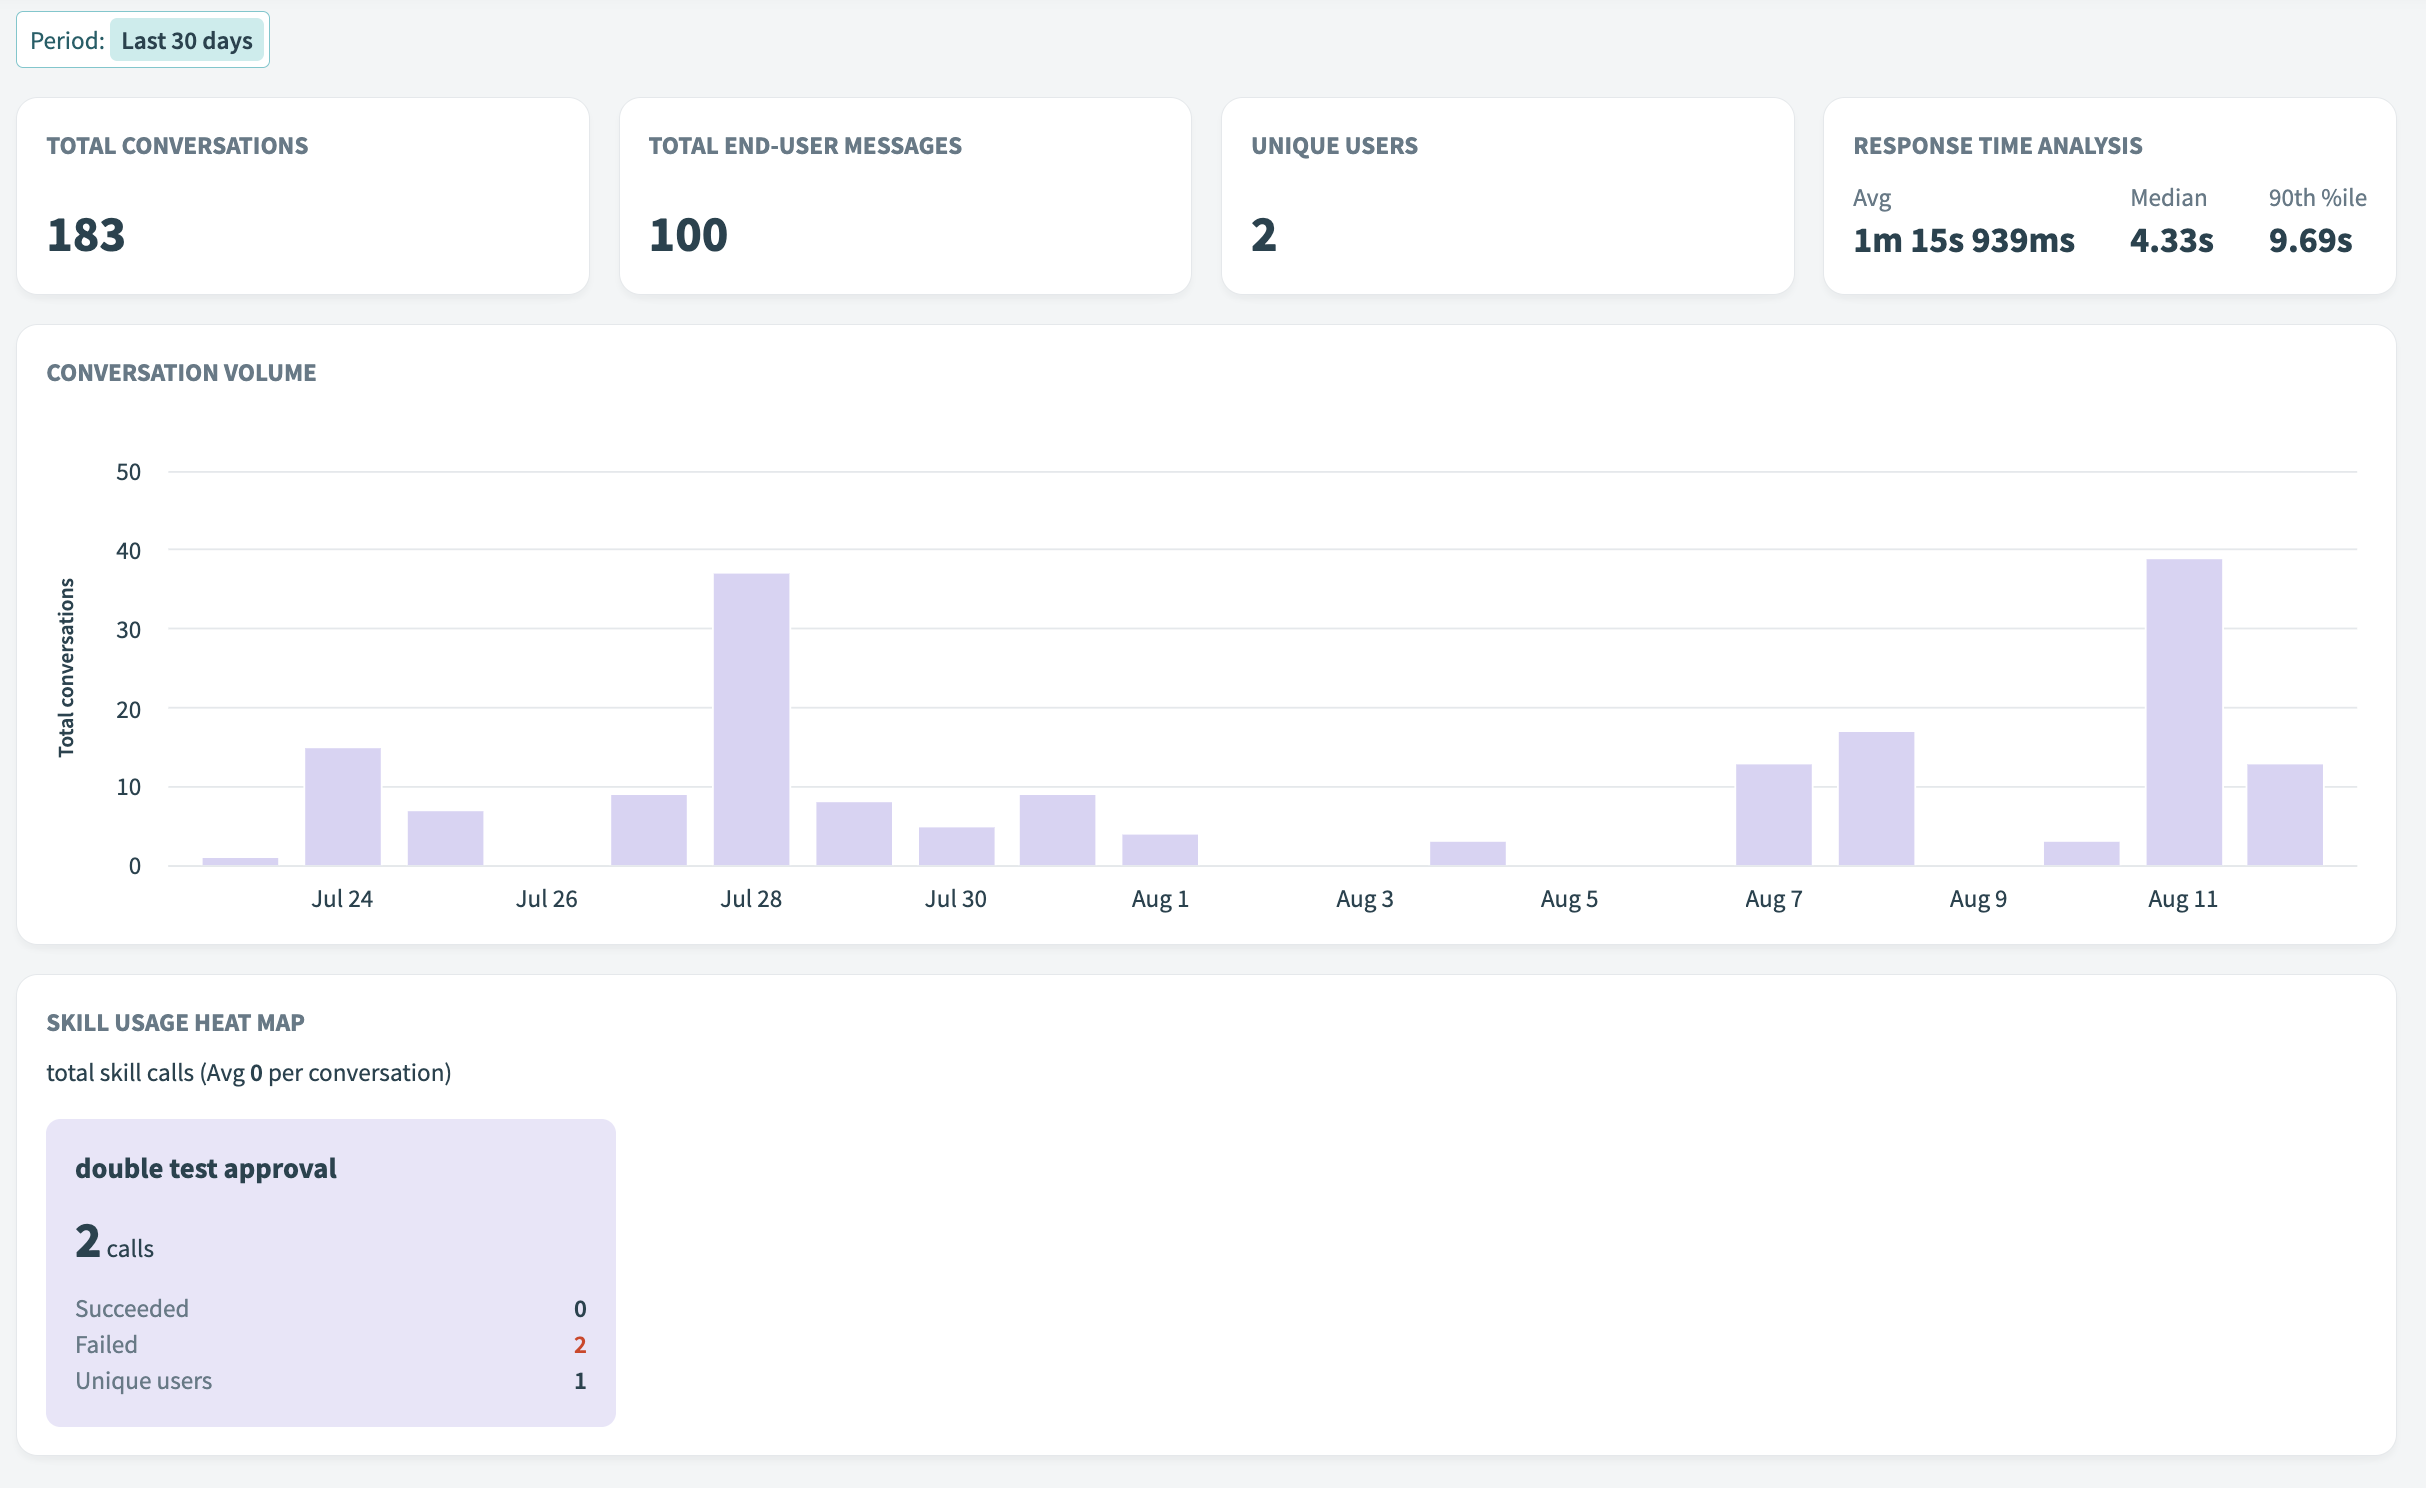
The Overview page includes a metrics dashboard. Each genie built in Agent Studio generates interaction data that you can analyze. These metrics help you understand how effectively your genie is performing, whether users are engaging with it, and how its skills and knowledge bases are being used. You can review key performance information, including:
- Total conversations
- Total end-user messages
- Unique users
- Response time analysis
- Conversation volume
- Skills usage heat map
You can select a time range to filter metrics and update the charts and heat maps on the Overview page. The following time ranges are supported:
- Last hour
- Last 24 hours
- Last 7 days
- Last 30 days
- Custom range
 Overview page metrics
# Access the Overview page
Complete the following steps to access the Overview page:
Sign in to Workato.
Go to AI Hub and click the Genies tab. A list of your existing genies displays.
Select the genie you plan to view. The Overview page automatically displays.
Optional. Click the links in the Overview panel to view your genie's job description, skills, knowledge, and app events.
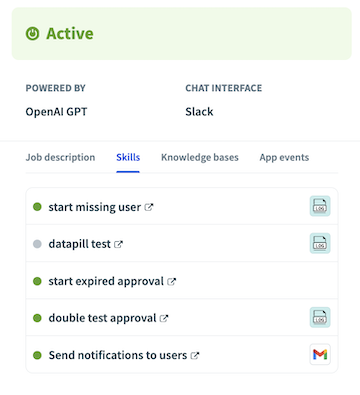 Overview panel
# Total conversations
The total conversations report shows the number of distinct conversations initiated with a genie each day based on the selected time range. A conversation is a unique thread between the genie and a user. Each conversation has a distinct conversation ID. The report counts how many new conversations were started each day within the time period you select.
Refer to the Conversations documentation for more information.
# Total end-user messages
The end-user messages report shows the total number of messages sent by users to a genie. This helps gauge how frequently users are engaging with the genie. A message is any input received from an end user, excluding input sent while the genie is stopped, still processing, or otherwise inactive. Business event messages are included in the total. The report displays the running total.
# Unique users
The unique users report tracks of distinct users interacting with your genie. This can help you track user engagement and understand whether usage is growing, stable, or declining over time.
# Response time analysis
The response time analysis report shows how long it takes for a genie to respond to user messages. This can help you assess whether response times meet user expectations. Response time measures the duration between a user’s message and the genie’s first reply. Response time is tracked in milliseconds and displayed in seconds if needed. The report includes average, median, and 90th percentile response times, grouped by day to show daily performance trends.
# Conversation volume
The conversation volume report provides a visual display of your total conversations over time. This can help you track engagement patterns and understand whether usage is growing, stable, or declining over time.
Refer to the Conversations documentation for more information.
# Skills usage heat map
The skill usage heat map shows how often each skill is called across all conversations with a genie. A skill is only counted when it’s both invoked by the genie and returns a response. This report only includes skills you created for your genie.
Skills usage data is pulled from conversation records within the timeframe you specify. The report also includes the execution status of each skill to help you calculate success rates. Results are ordered by frequency of use in descending order.
# Overview metrics use case examples
You can gain insights into your genie's performance through metrics analysis on the Overview page.
# Logistics coordinator genie
You can use the metrics on the Overview page to monitor operational reliability and partner performance. For example:
Skills usage heat map: Identify which logistics actions, such as Track shipment and Update inventory, are used most frequently to ensure coverage aligns with user needs.
Skill resolution metrics: Measure success and failure rates for skills that connect to external systems, such as warehouse databases or carrier APIs. High failure rates may indicate integration issues or data format mismatches.
Total conversations: Monitor how often employees interact with the genie to check delivery statuses or flag exceptions. A spike in conversations could indicate a logistics disruption.
Unique users: Track adoption across warehouse and operations teams. A drop users may suggest the genie isn't being used for time-sensitive updates.
Response time analysis: Assess whether users are receiving updates quickly enough to act on disruptions or re-route deliveries.
# Data analyst genie
You can use the Overview page to track data coverage, report reliability, and stakeholder engagement. For example:
Skills usage heat map: Determine whether users are triggering multiple analysis skills in a single conversation, such as Query data, Generate chart, and Explain trend, indicating complex workflows are supported.
Conversation volume: Gauge how often business stakeholders rely on the genie for on-demand reporting rather than recurring insights.
Response time analysis: Confirm that responses for large queries, such as trend analysis, are returned within acceptable thresholds.
# R&D workflow genie
You can use the Overview page to measure scientific engagement, collaboration depth, and reproducible workflow support. For example:
Skills usage heat map: Determine which workflows are used most, such as Log experiment, Summarize results, or Track dataset versions. This can help highlight what parts of the research process are most often automated.
Conversation volume trends: Correlate conversation spikes with known project deadlines, grant submissions, or experiments in progress.
Unique user tracking: Measure how widely your genie is being adopted across research teams or departments.
Last updated: 8/18/2025, 3:06:28 PM