Insights
Insights is a data visualization and manipulation engine built into Workato and Workflow apps' no-code environment. It enables business users, IT professionals, and citizen developers to connect, manipulate, and visualize data, making data-driven decisions directly within Workato. You can access Insights from the side navigation bar in Platform > Insights.
The basic building blocks of Insights consist of data sources, query components, and chart components. When combined, these building blocks form data reports and visualizations called dashboards.
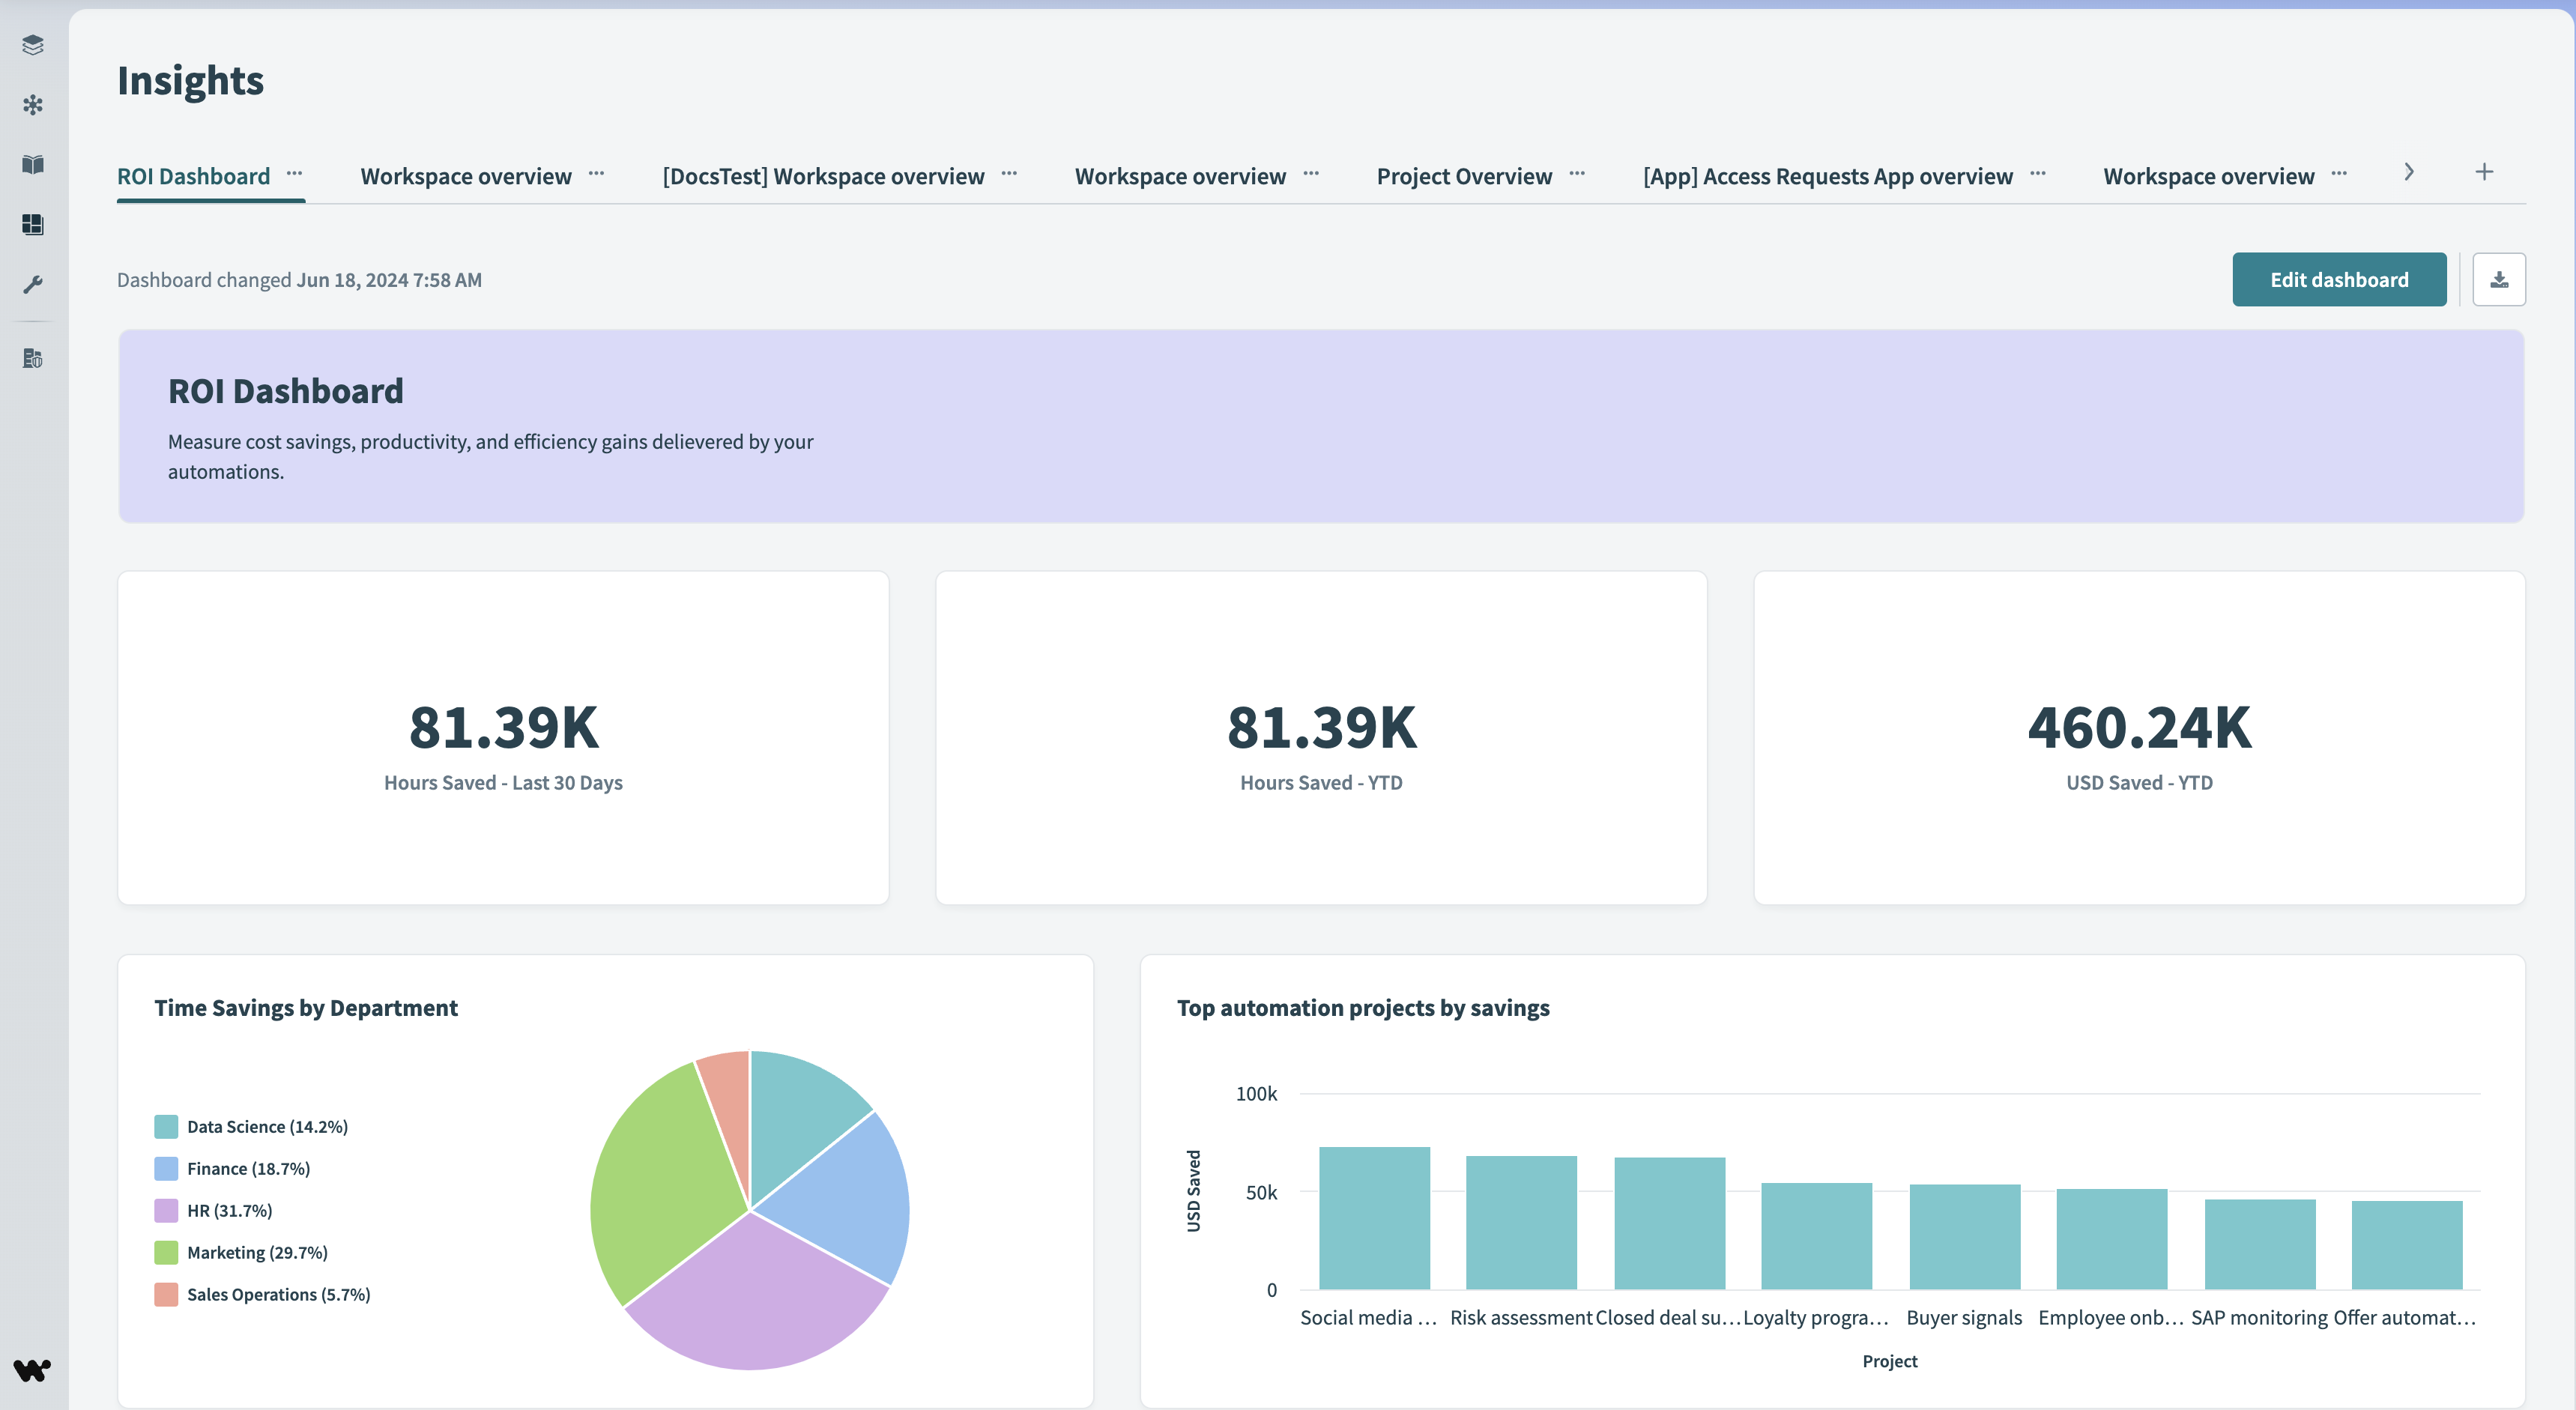 Insights dashboard
FEATURE AVAILABILITY
Insights is available to customers on specific pricing plans. Additionally, access to Insights dashboards within Workflow apps is determined by whether your plan includes the Workflow apps feature. Refer to your pricing plan and contract to learn more.
Supported data sources
Insights enables you to create comprehensive data reports using built-in and customizable data sources.
Standard data sources
The following data sources provide the foundation for your reports and analytics in Insights:
- Projects: Gain insights into all the projects within your workspace and view key project metrics.
- Recipes: Analyze data from all the recipes in your workspace to create detailed reports on recipe execution and performance.
- Job history: Access detailed data for all jobs run within your workspace over the past 365 days, allowing you to track and analyze job performance and outcomes.
- Workflow apps: Retrieve data related to all the workflow apps in your workspace, providing visibility into app usage, efficiency, and workflow automation.
Additional data sources
In addition to these standard data sources, you can customize and enrich your reports with the following data sources:
- Calculated columns in individual job history: Add calculated columns to job history reports to capture and display additional recipe data. This customization gives you the flexibility to track the exact metrics you need for your specific workflows.
- Data tables: Use data tables to include supplementary data sources, providing a more comprehensive view of your operations and enabling deeper analysis.
Refer to the data sources section for a full list of data sources and their data columns.
Dashboard use cases
You can build custom dashboards based on your automation data. This provides visibility to the value created by automation and bridges the gap between automation and analytics. Insights always displays data in real time, without a need for expensive ETL/ELT and BI (business intelligence) practices.
Use Insights for the following types of data analysis:
Usage analytics
Workato Insights can track how a Workato workspace is used, including recipe success rates and errors, display recipe/task consumption, break down data by projects and environments, and show full job history for the workspace.
Sample metrics include:
Of recipes/jobs/tasks:
- The number of tasks consumed by a recipe
- The number of tasks consumed by each environment
- The number of active recipes in an environment
- Error rates
- Job execution time
Full job history
- The total number of tasks consumed in a workspace
- The total number of active recipes in a workspace
Automation impact
This feature can provide insights into how automation impacts your business processes and calculate ROI. This can include time/money saved, reduced manual errors, and increased operational efficiency.
Sample metrics include:
- Total amount saved ($)
- Hours saved last month by a specific process
- Savings by process or department
App analytics
Workato Insights can provide analytics on user-centric processes implemented as a Workflow app.
Sample metrics include:
- Of open tasks:
- Average user processing time
- The time a task spends in a certain status
- Of approval processes:
- Average time to approve
- Of employees onboarded last month:
- Average time to complete processing
Workflow performance
Workato Insights can provide analytics on how well your automated workflows perform.
- Sample metrics include:
- Total amount of orders processed last month in an automated Order-to-Cash process
- Breakdown of orders by region
- Average order processing time
Supported queries and charts
Queries
Transform and prepare your data: Retrieve, analyze, and utilize the information stored in your data sources using the following queries on your data:
- Filter by
- Summarize
- Join to
- Sort by
- Row limit to
- Calculated columns
Charts
Visualize your data: Display data points, trends, patterns, and relationships by adding charts to your dashboard.
Insights supports the following chart types:
- Table (default)
- Line graph
- Bar graph
- Pie chart
- KPI chart
- Area graph
Last updated: