Usage metrics
The Usage metrics tab gives Embedded partners an overall view of all customers, connections, and recipes used across all customers, providing you with an overview of the product's health. The dashboard displays stats and metrics related to product usage and gives insights into the apps and integrations your customers use most.
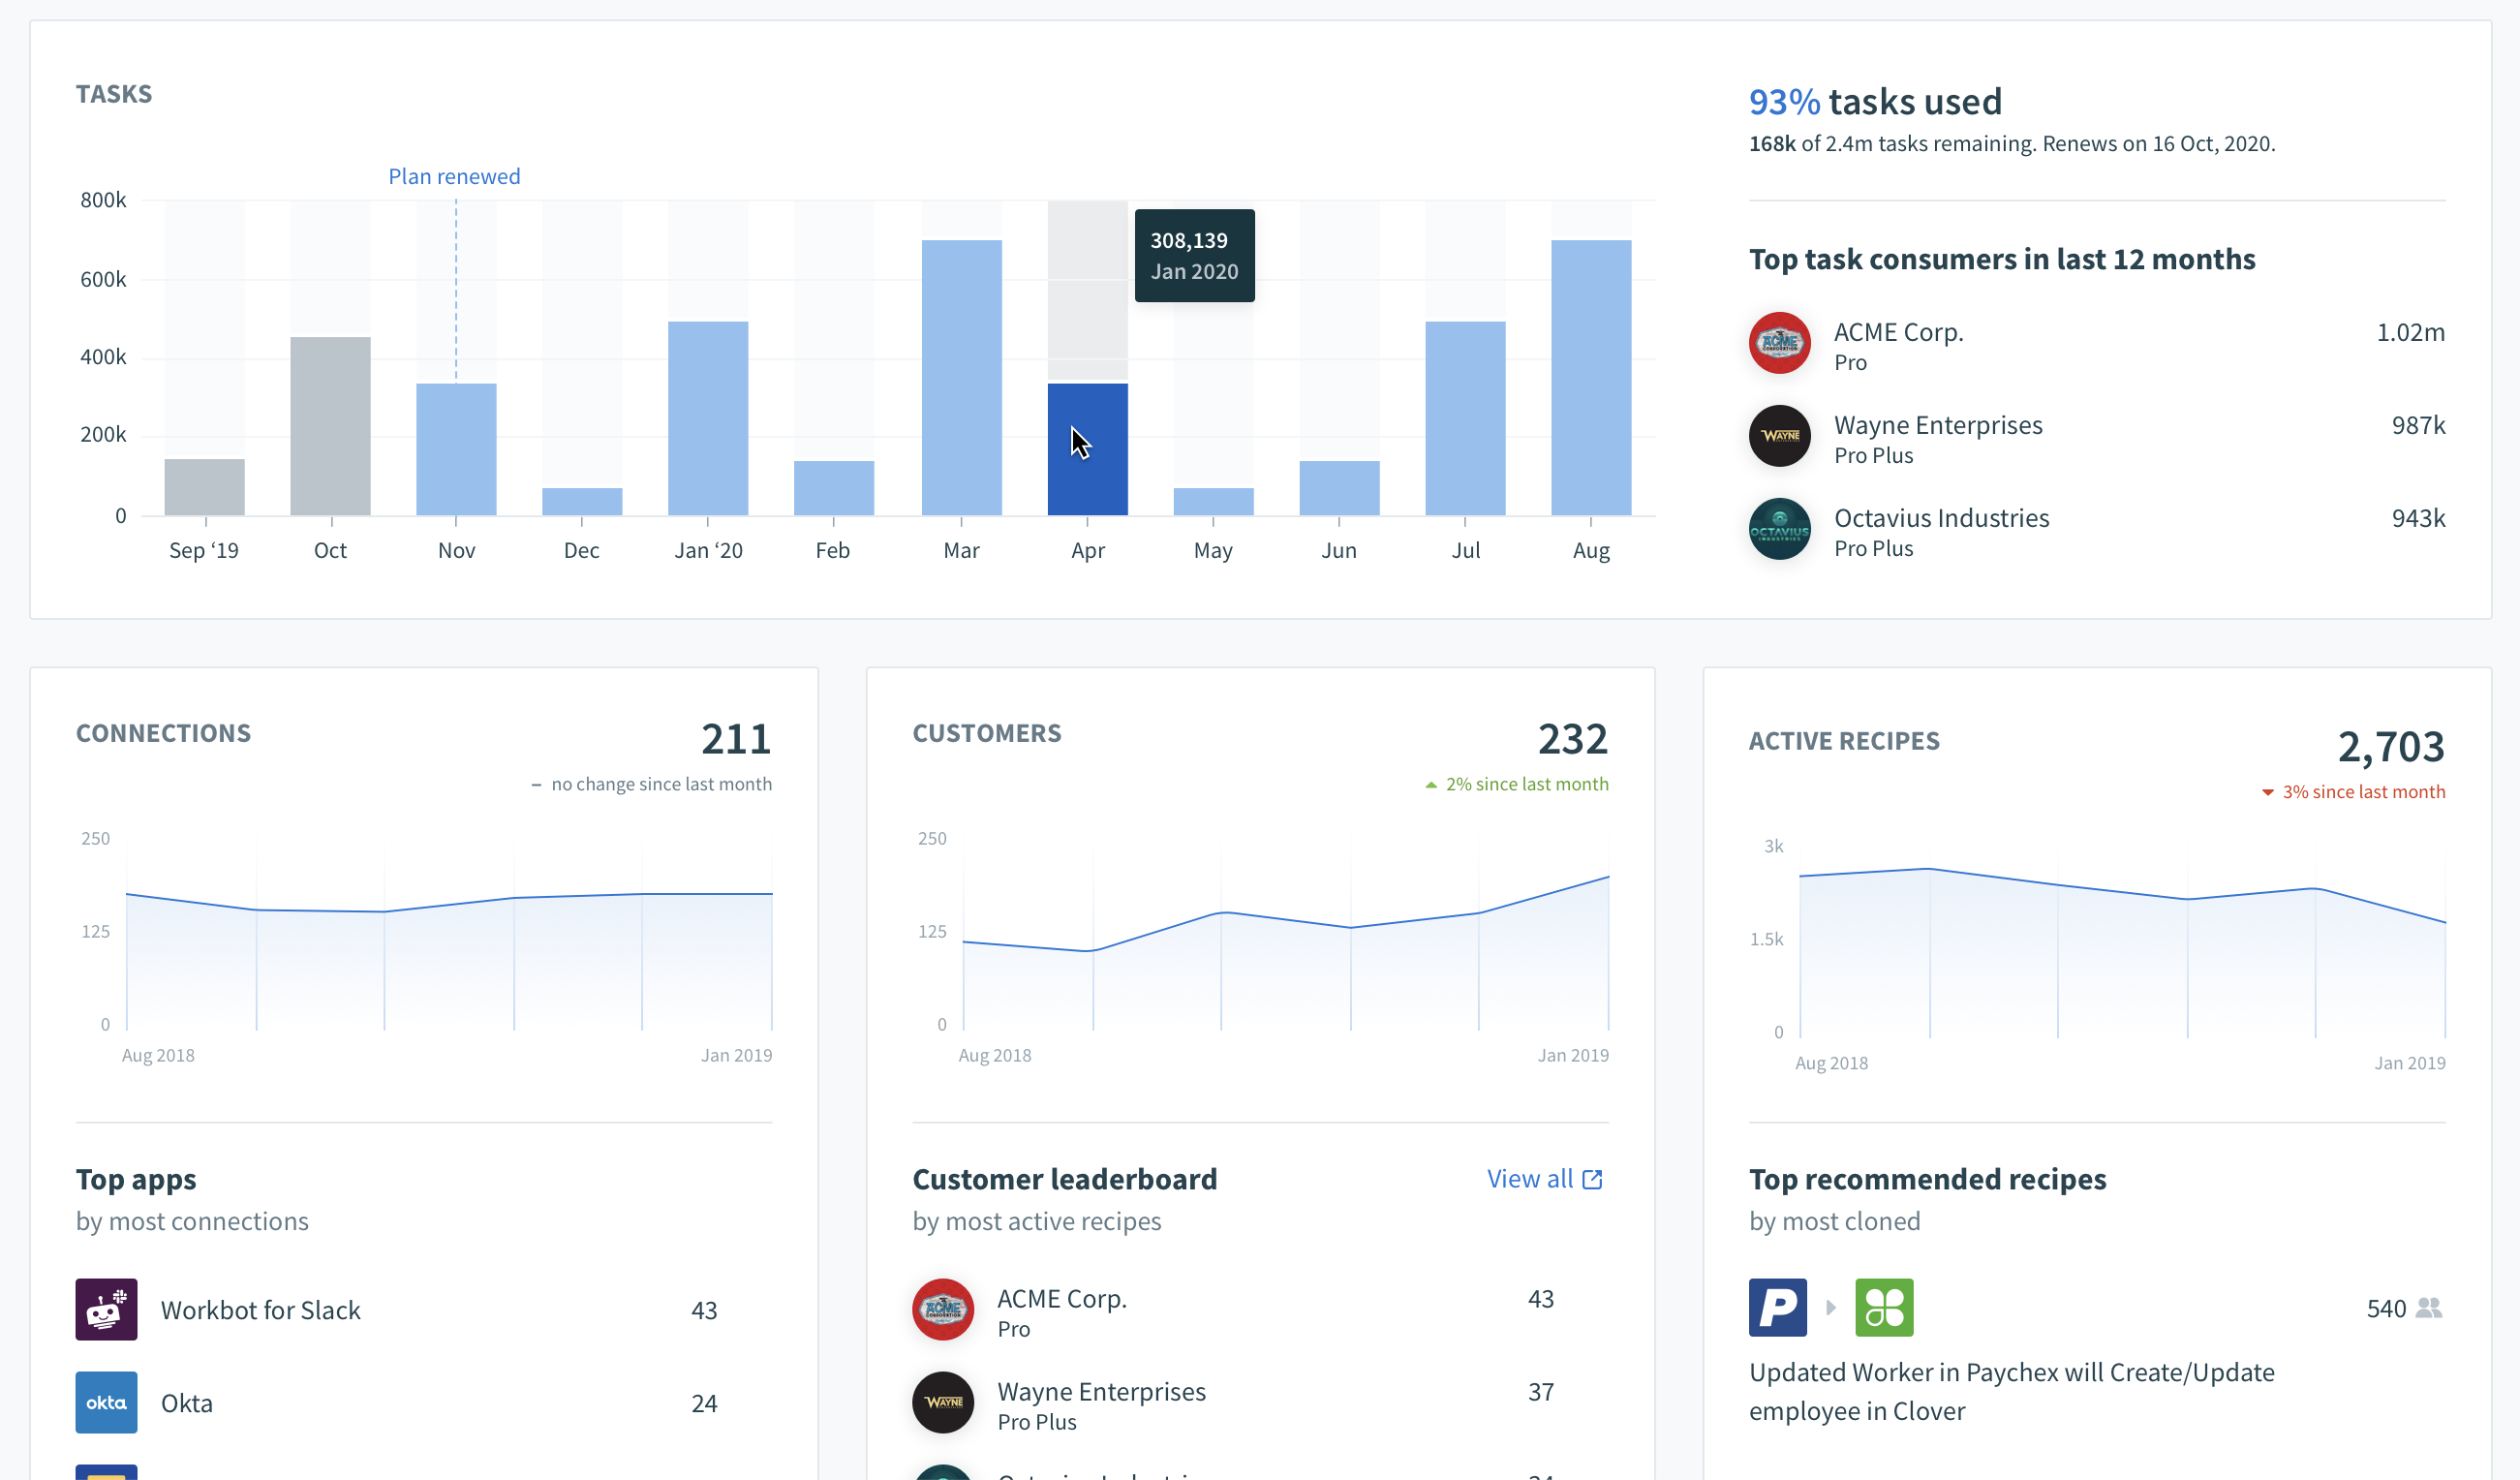 Usage metrics tab
There are four distinct sections in the Usage metrics tab. Each section provides information on different usage metrics.
Tasks
FEATURE AVAILABILITY
Task usage is only available from Oct 1, 2020.
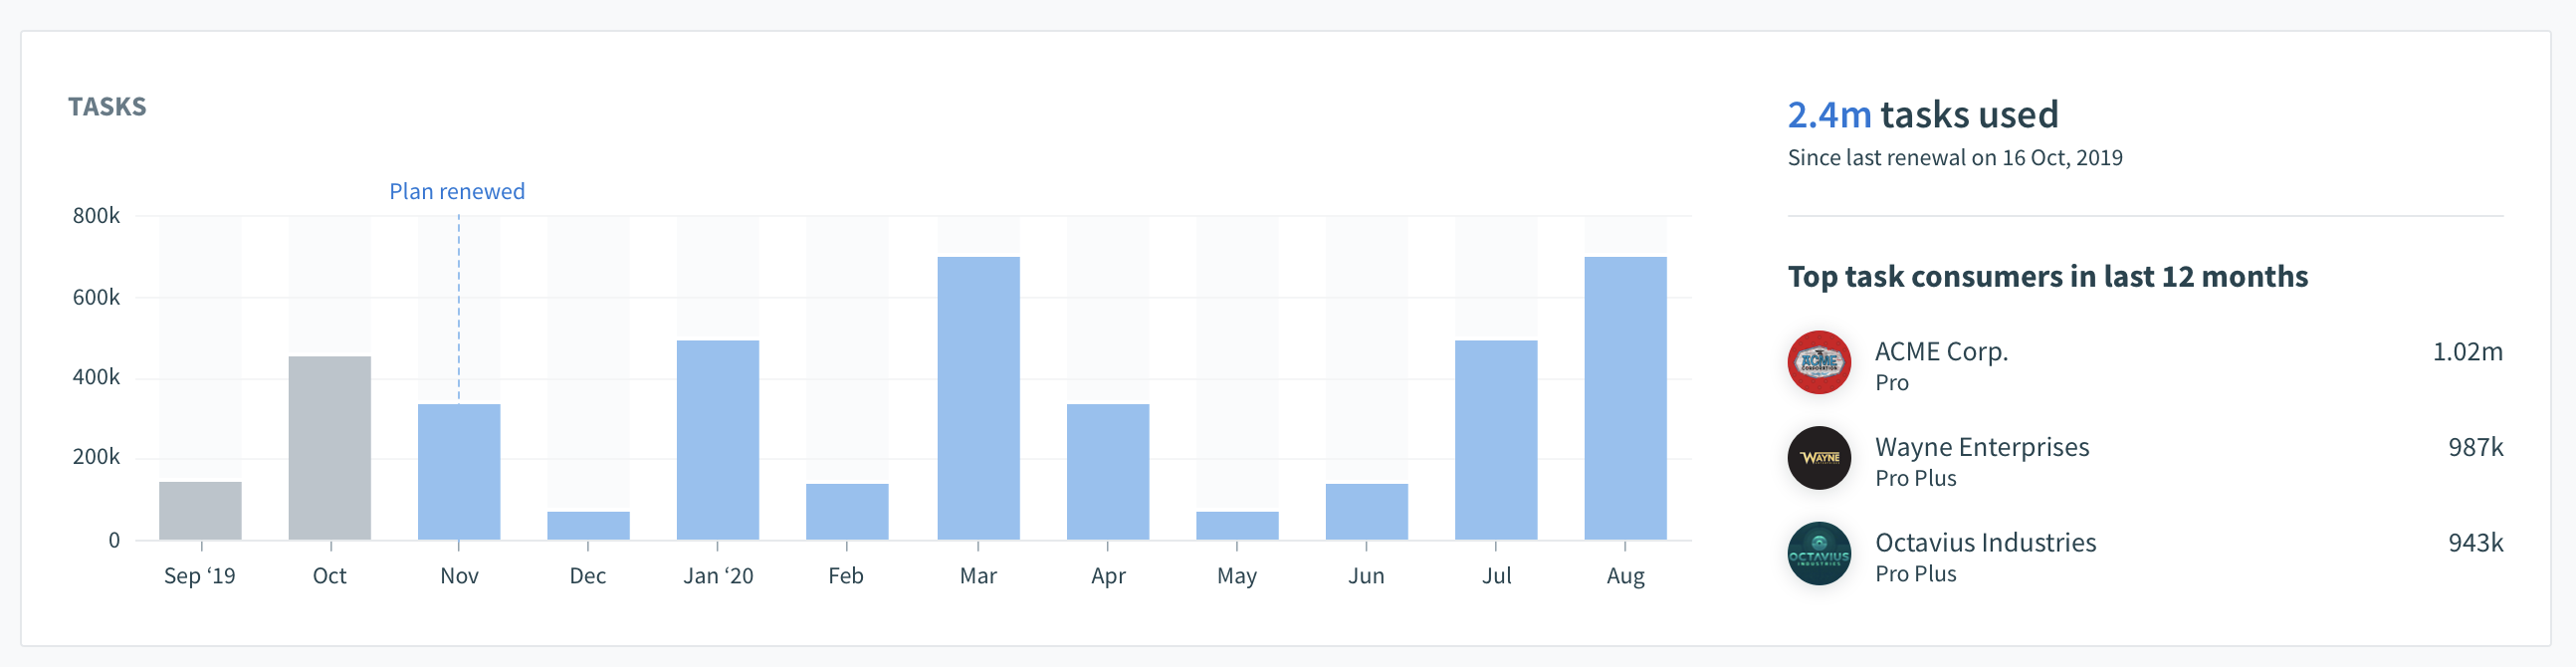 Usage metrics: Tasks
This section displays the total task count across all customers by calendar month. A task is a unit of work that occurs every time a recipe performs an action that requires compute resources. Hover over each month to view the task count for that month.
The section on the right of the graph displays the top three customers with the highest usage in the last 12 months.
GET USAGE DATA PROGRAMMATICALLY
Use our Get monthly usage API to obtain task data for your embedded customers programmatically.
Connections
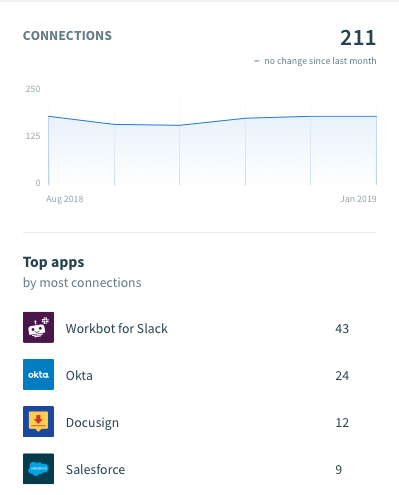 Usage metrics: Connections
This section displays the total connection count across all customers. A connection here refers to an app connection successfully authenticated in a customer workspace. All connections are included in this count, even those that aren't part of active recipes. This number does not include connections created in your Embedded admin workspace.
The graph displays the trend in connection count for the last six months, while the following section lists the count of the top 10 most popular apps. The apps displayed here can influence the type of recipes and solutions that you choose to provide in the Embedded Private Community. It also gives you insights into your customers' most popular use cases.
Customers
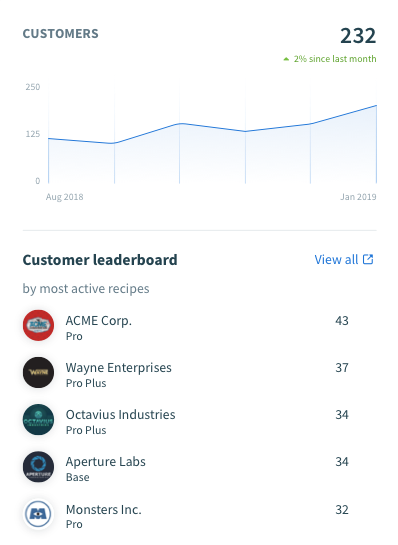 Usage metrics: Customers
This section displays the total number of customers and the trend in this number over the last six months. All customers, including those whose subscription has expired, are added to this count. Delete the customer if you want the customer removed from this calculation.
Access detailed information about individual customers by selecting their names and accessing their customer information page.
Recipes
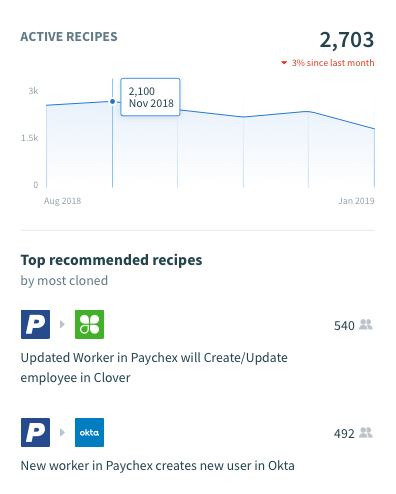 Usage metrics: Recipes
This section displays the number of all active recipes in customer workspaces. This metric is important because each active recipe in a customer workspace correlates to a successful integration. The top graph displays the trend in active recipes across customer workspaces for the past six months.
The Recommended recipes section displays the number of times your customers have cloned your recommended recipes. The top five recipes with the highest amount of clones appear on the dashboard. Learn more about promoting recipes in your customer community in the Recommended recipes documentation.
Last updated: