# Build your first dashboard
In this walkthrough, you'll build a workspace activity overview with three at-a-glance metrics and a breakdown of your most active projects.
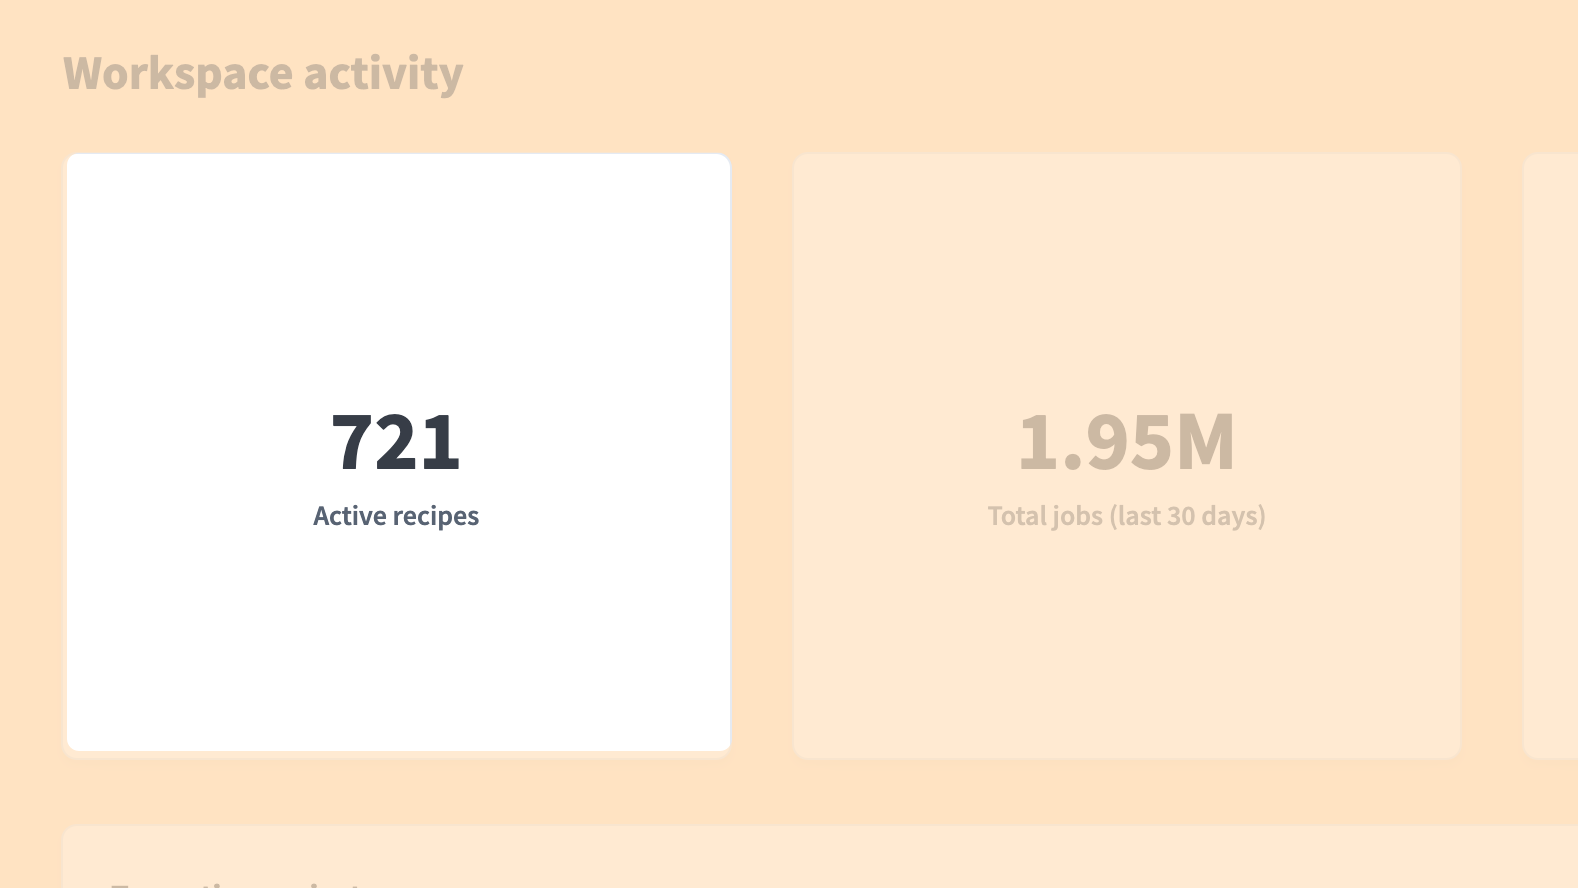
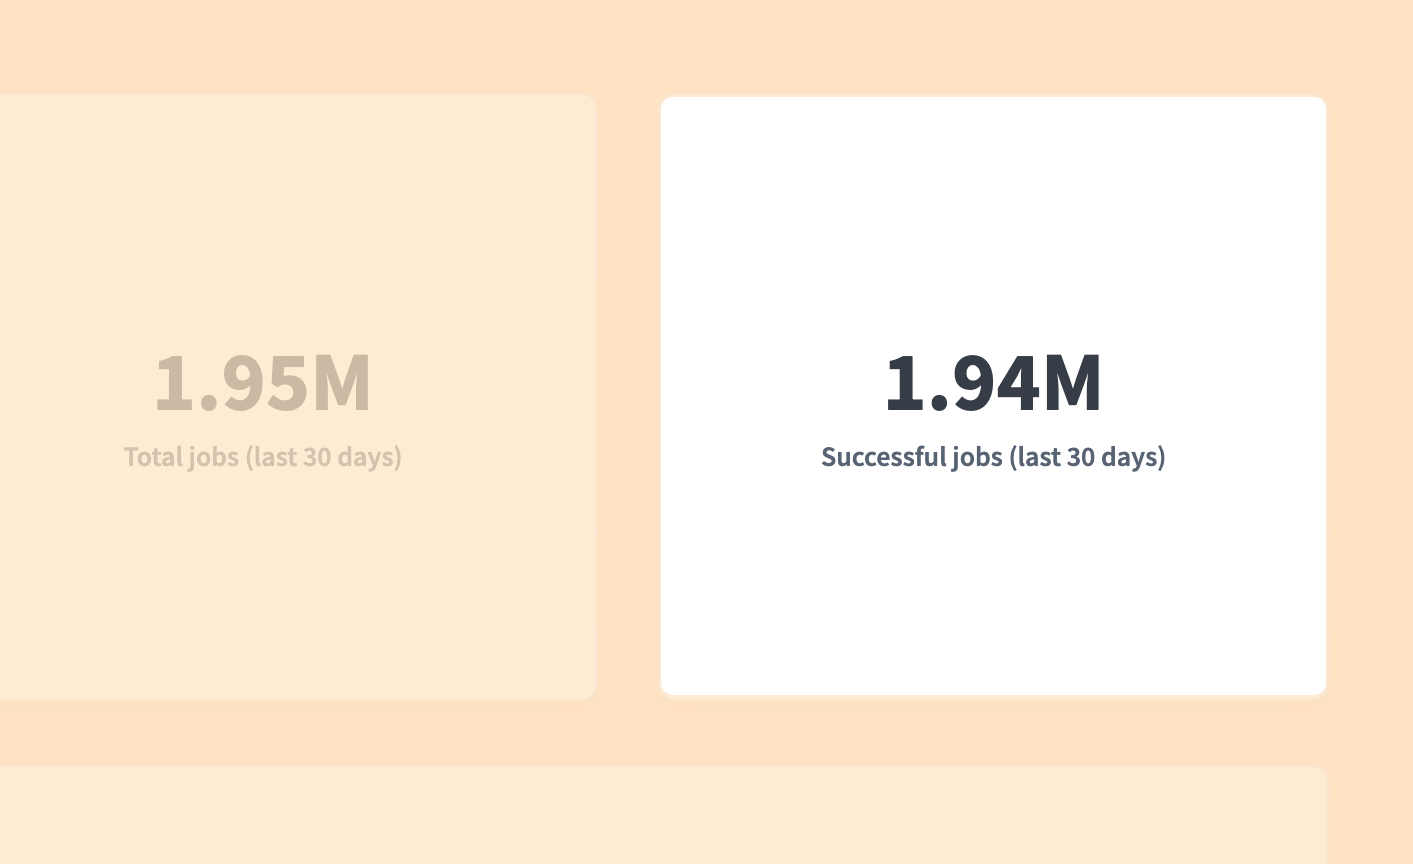
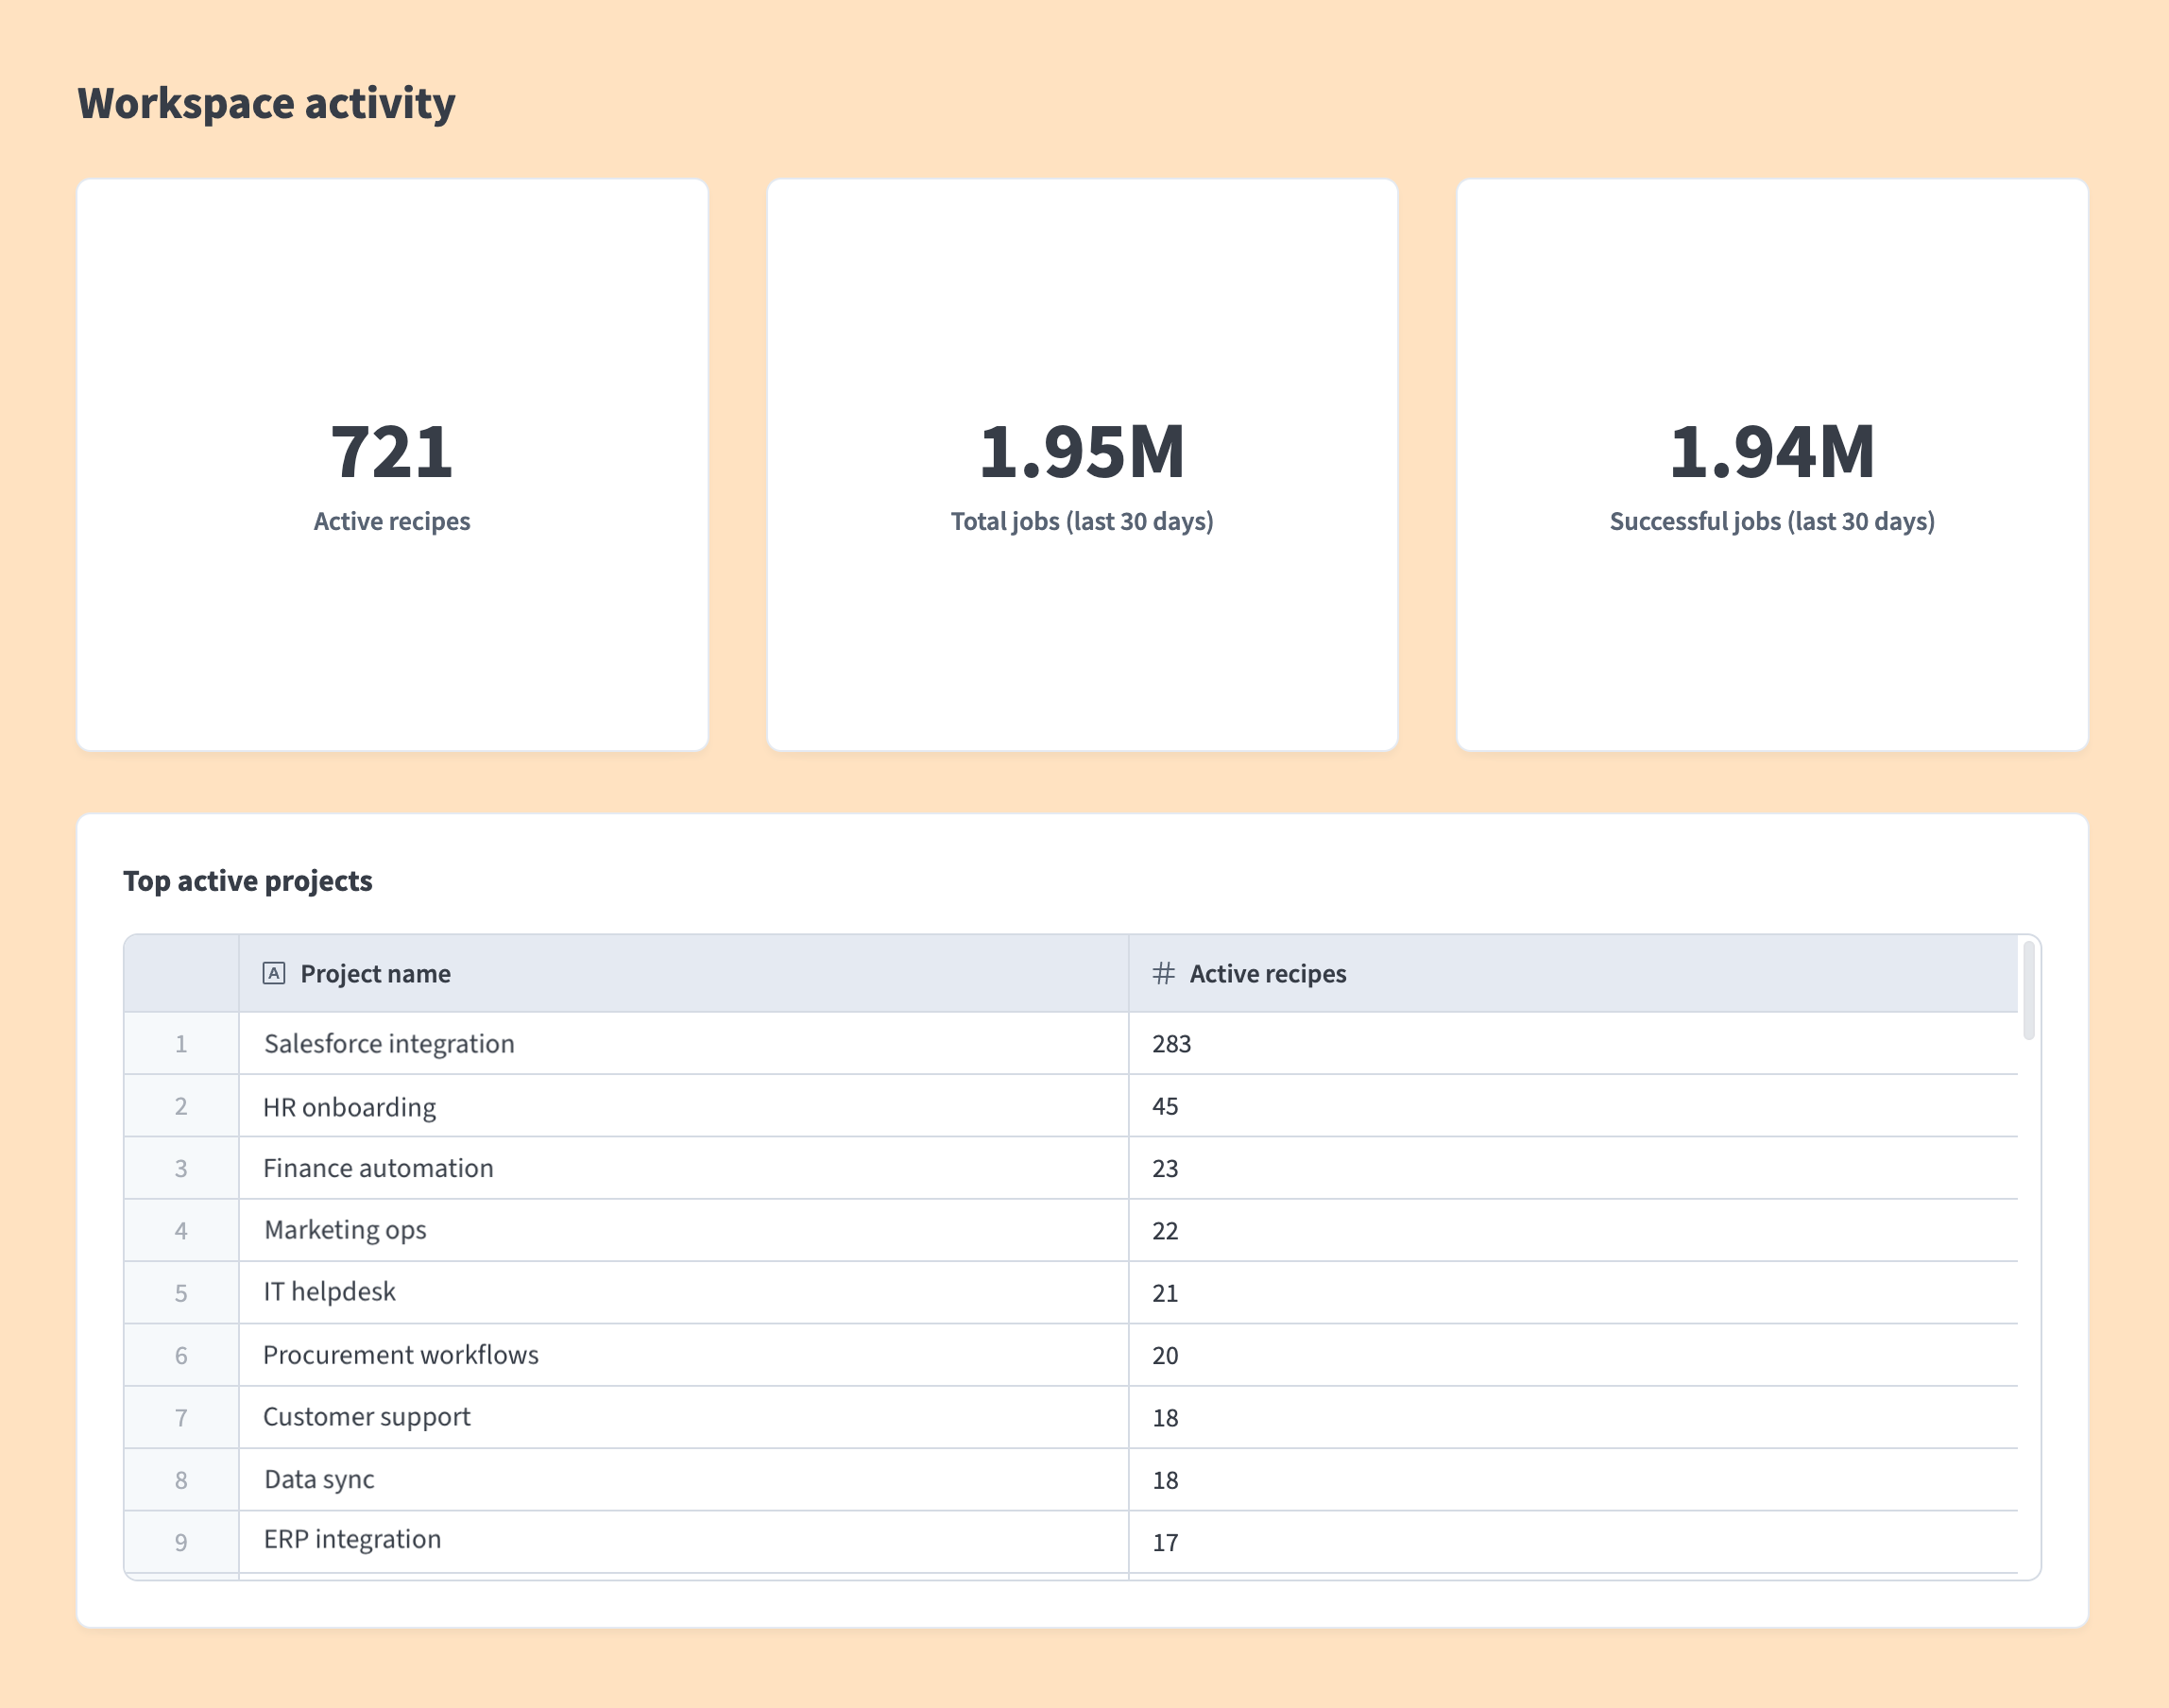 Example: Active recipes dashboard
# Before you start
This walkthrough assumes your workspace has some recipes running. If you're new to Workato, create your first recipe first, then return here.
Follow the Report builder or Query builder tabs throughout. The query builder requires more manual configuration: you'll build filter conditions, summarize data, and sort results for each chart.
PRIVATE BETA
The report builder is in private beta. Private beta features are available by invite only. Contact your Customer Success Manager to enable this feature.
Workato may update feature functionality or change availability without prior notice during the private beta.
# Create a new dashboard
Complete the following steps to create your dashboard:
Go to Platform > Insights and select Create dashboard.
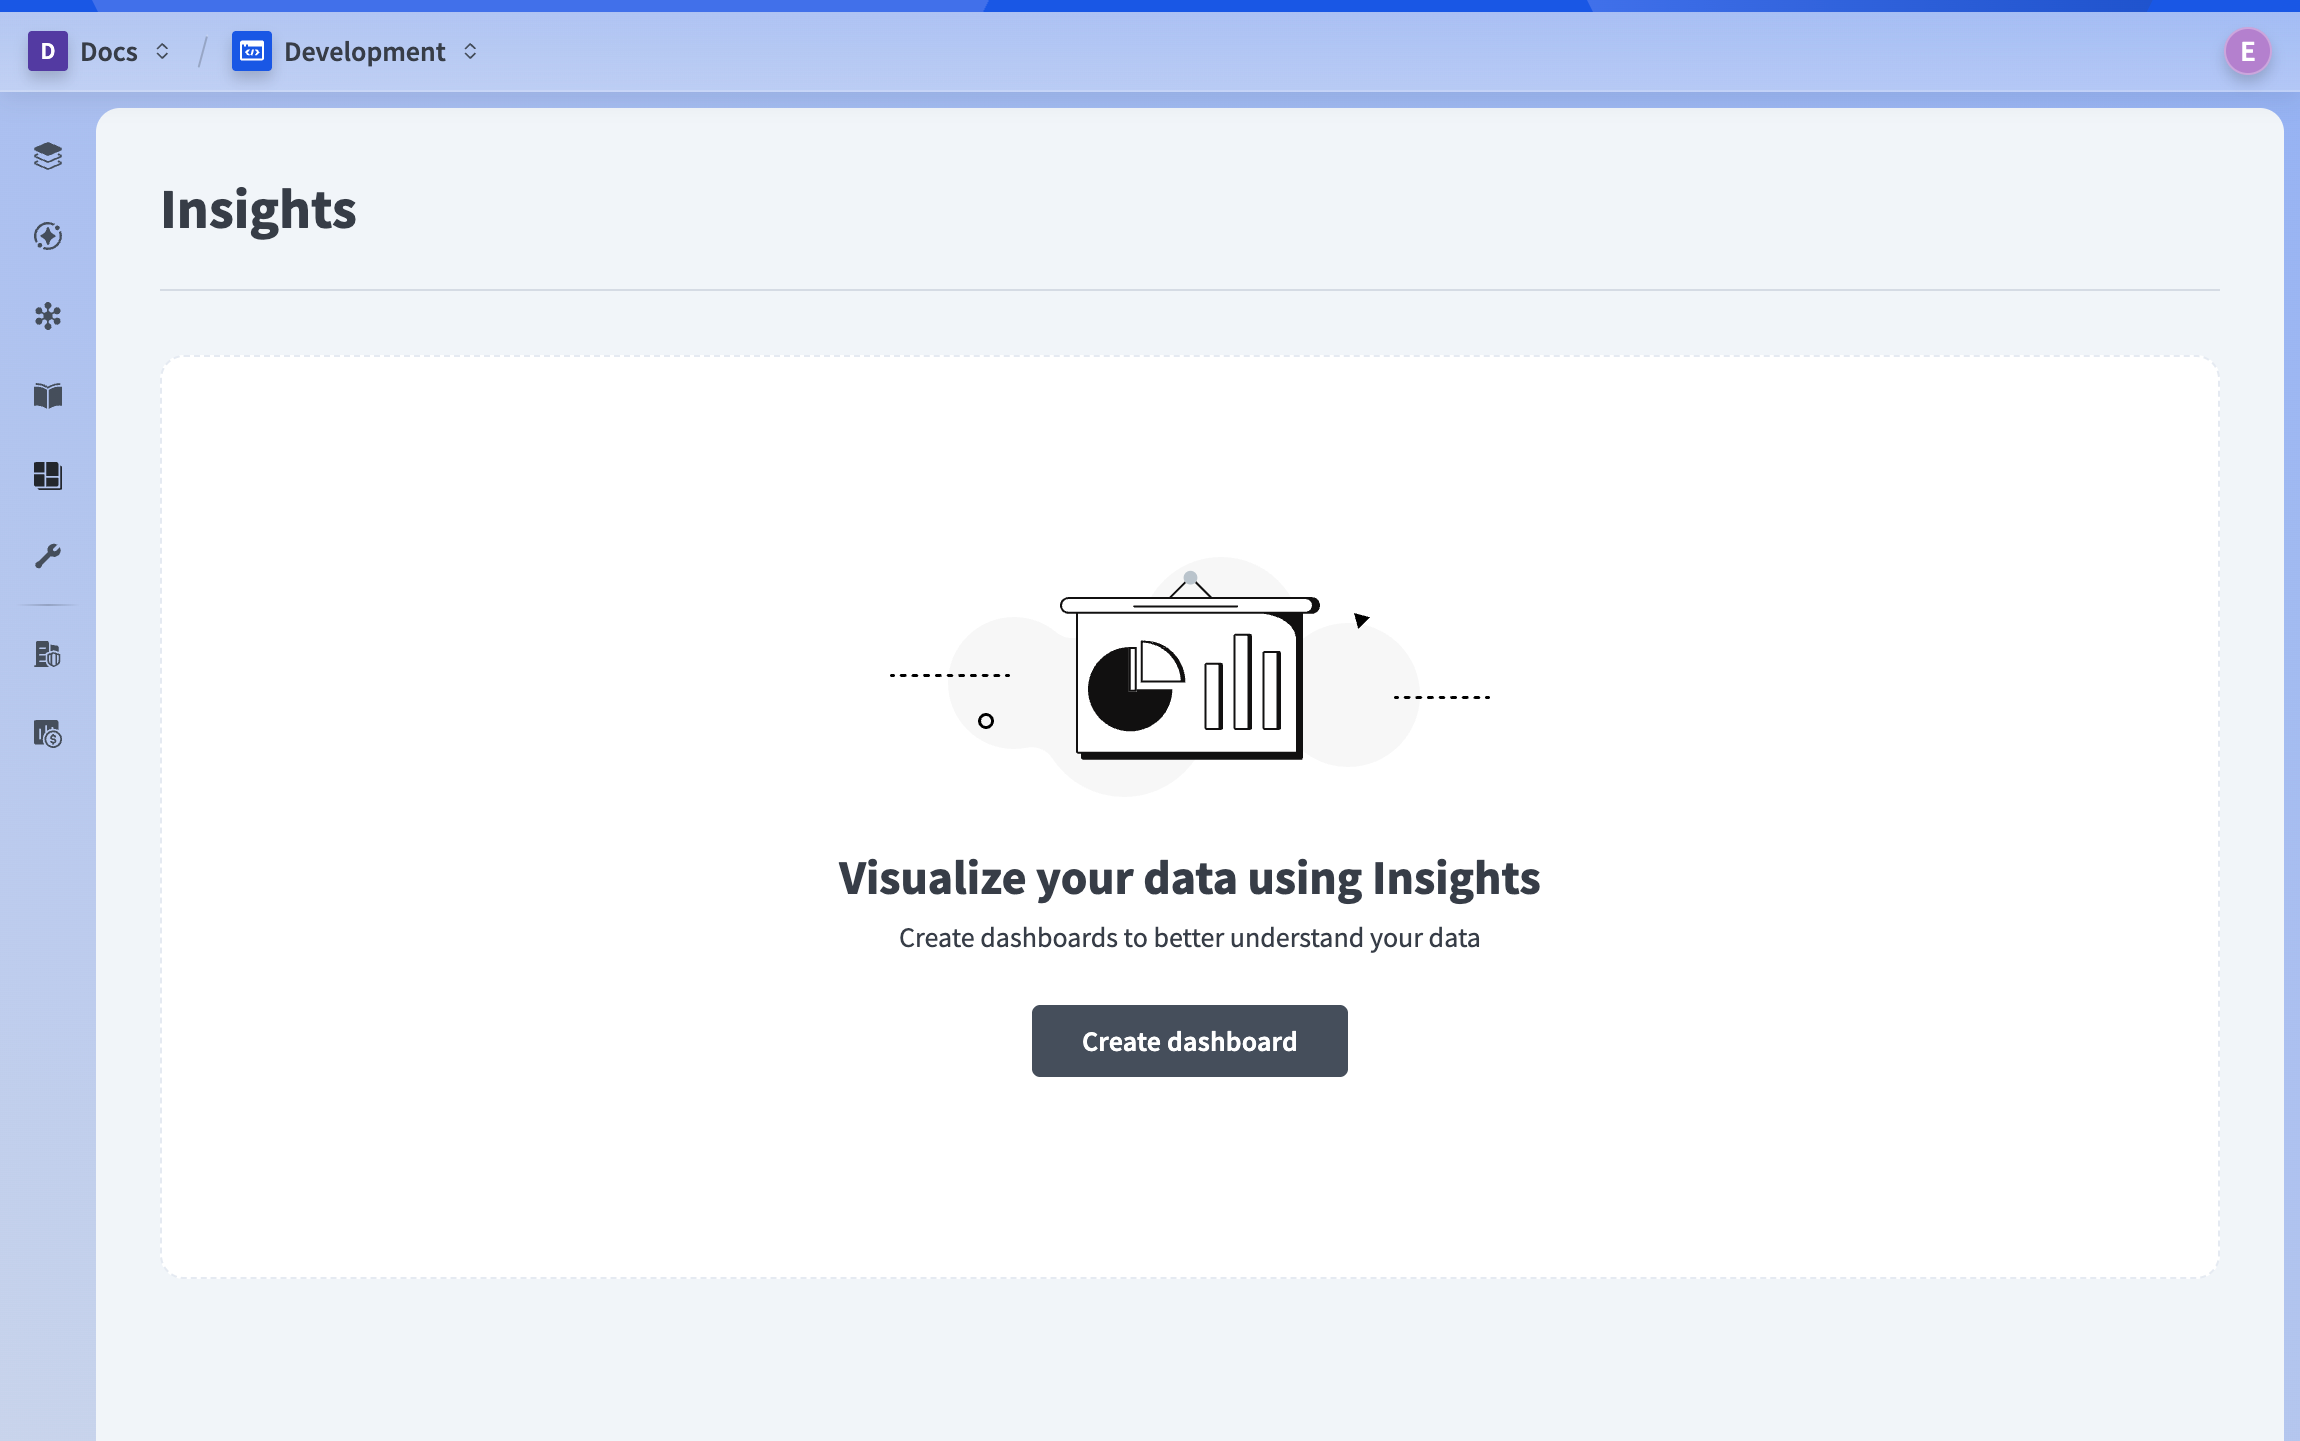 Create a new dashboard
Name your dashboard Workspace activity and select the Blank template.
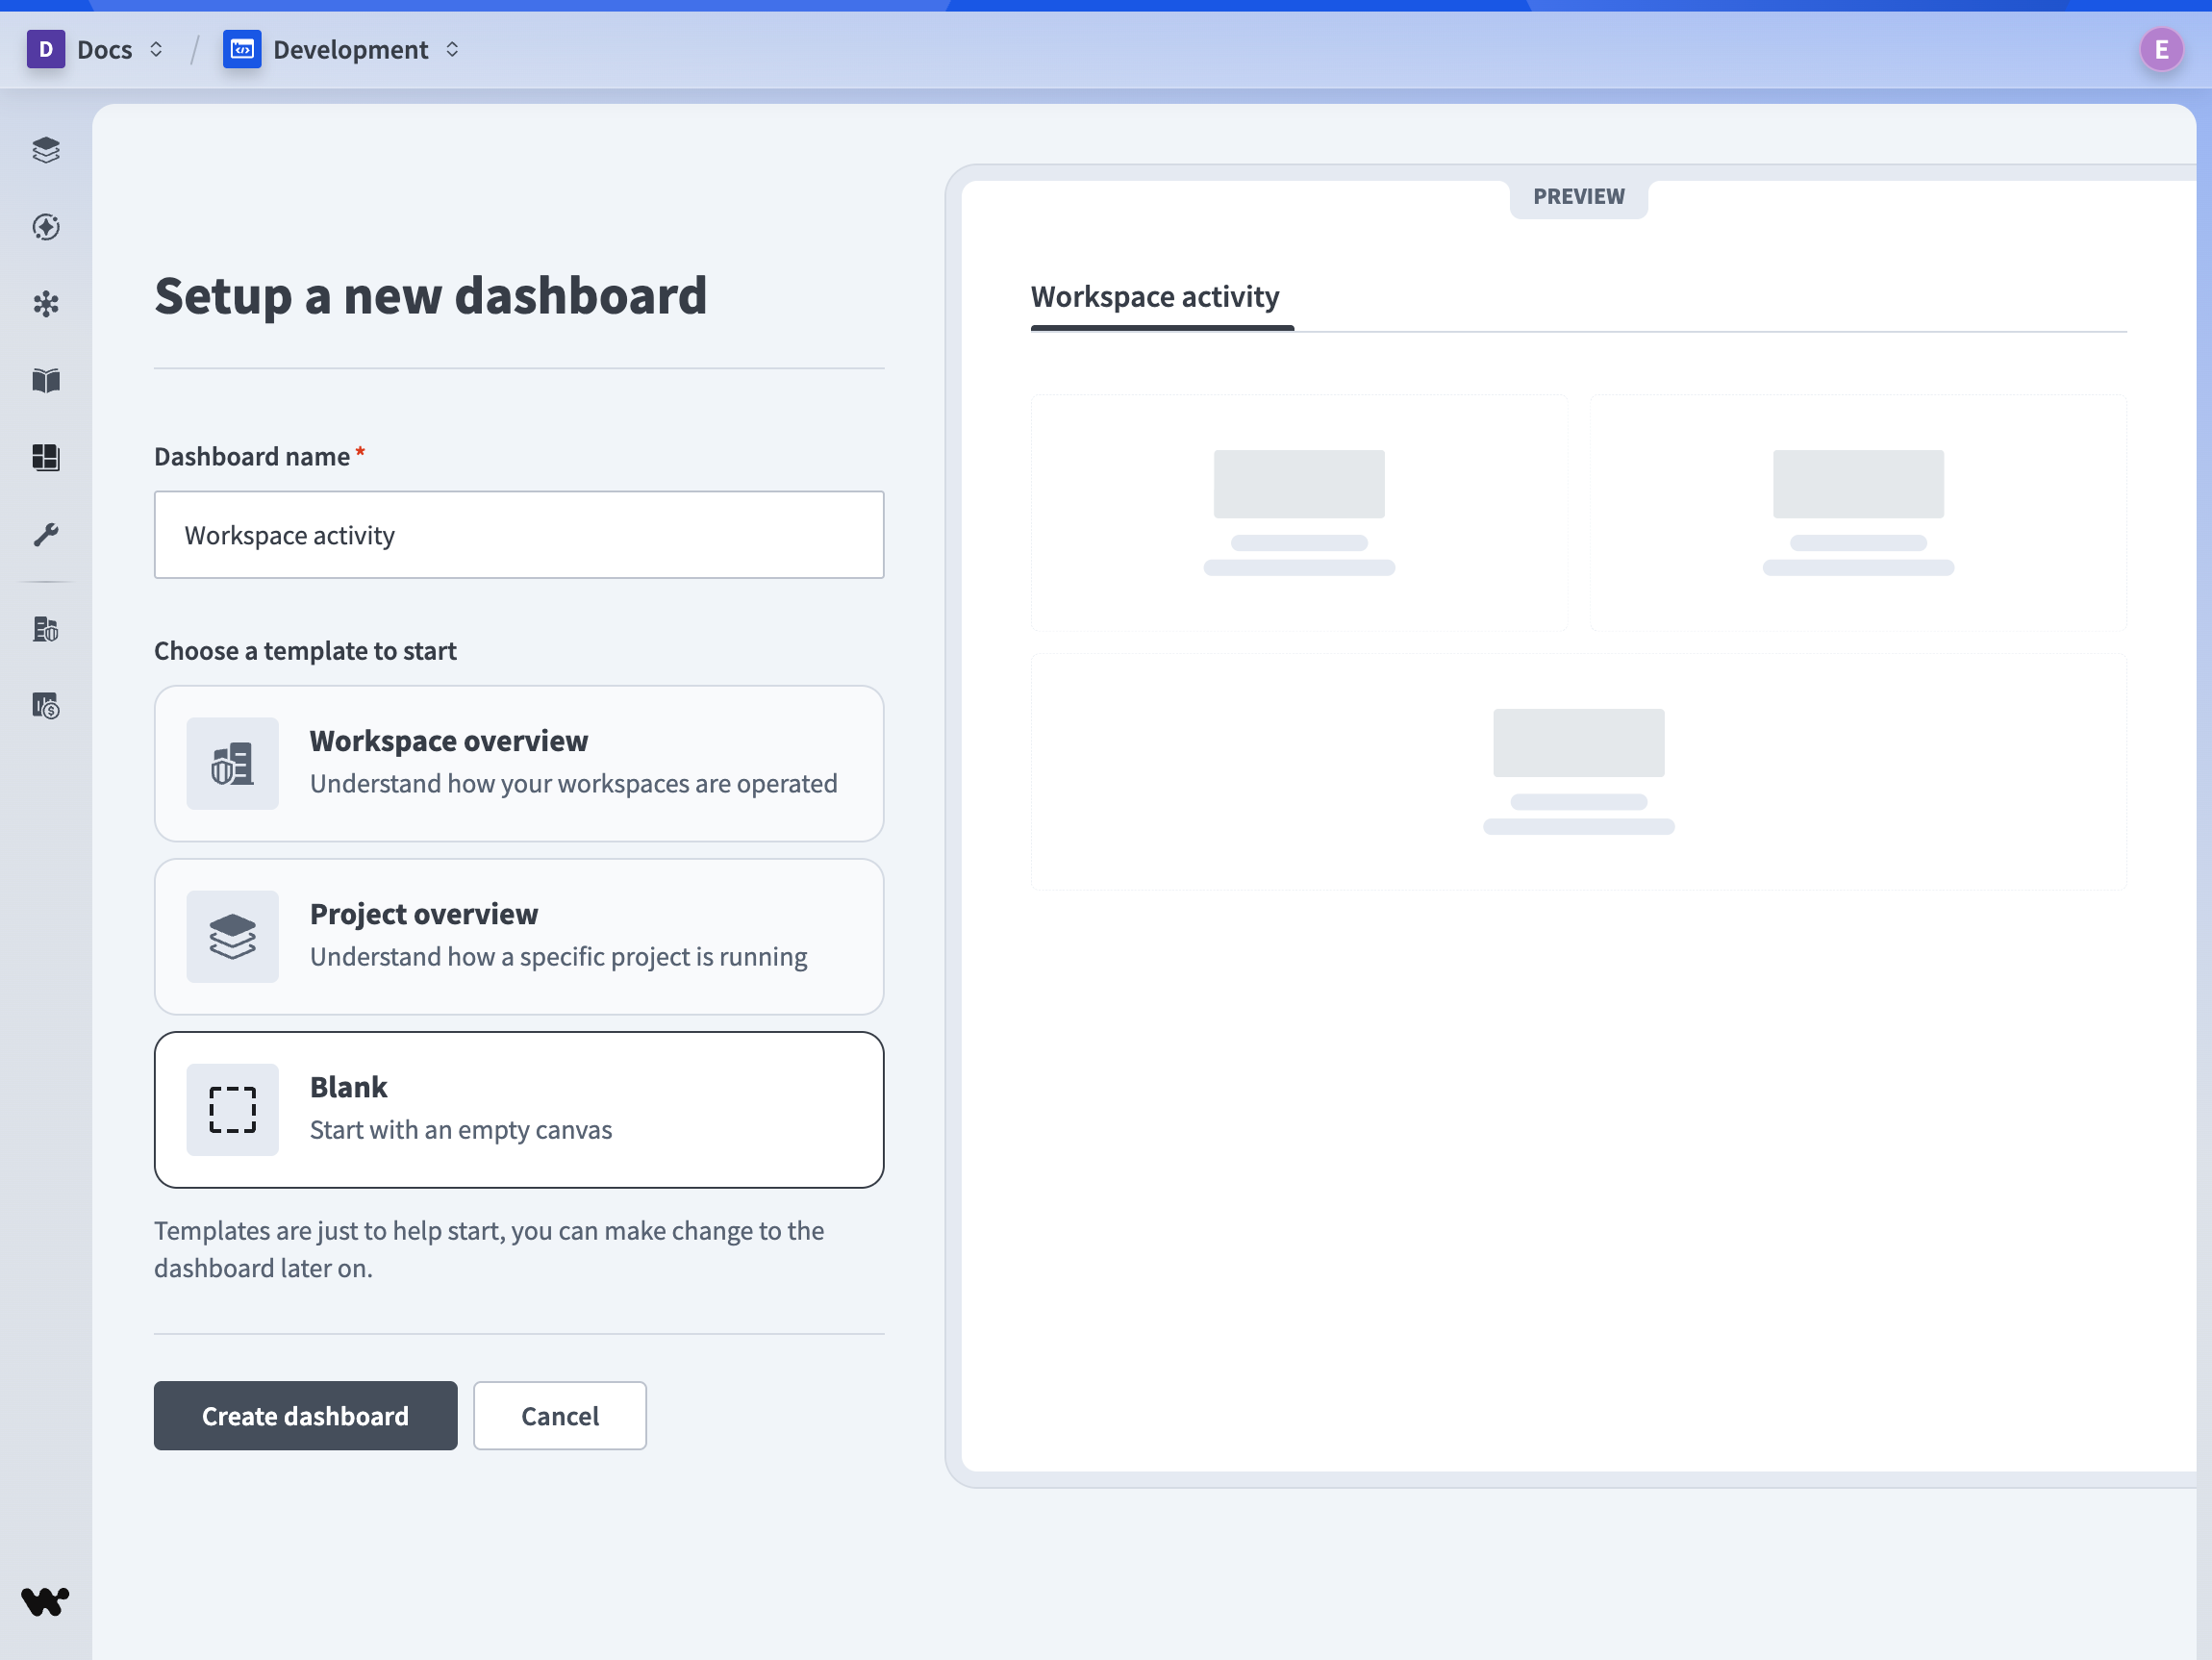 Name your dashboard
DASHBOARD TEMPLATES
The Blank template lets you build a dashboard from scratch. Dashboard templates are also available for common workspace and project views.
Click Create dashboard to open the dashboard editor.
# About the dashboard editor
The dashboard editor has four main areas:
- Components panel: contains the components you can add to your dashboard, including containers, text, dividers, and chart components.
- Dashboard canvas: the area your viewers see. Drag components here to build your layout.
- Editor panel: contains buttons to preview, save, and exit the dashboard.
- Component properties panel: appears when you select a component, letting you configure it.
Clicking Edit on a chart component opens the chart editor, where you set up the data query and choose how to display the results.
The components panel looks different depending on whether you have report builder access:
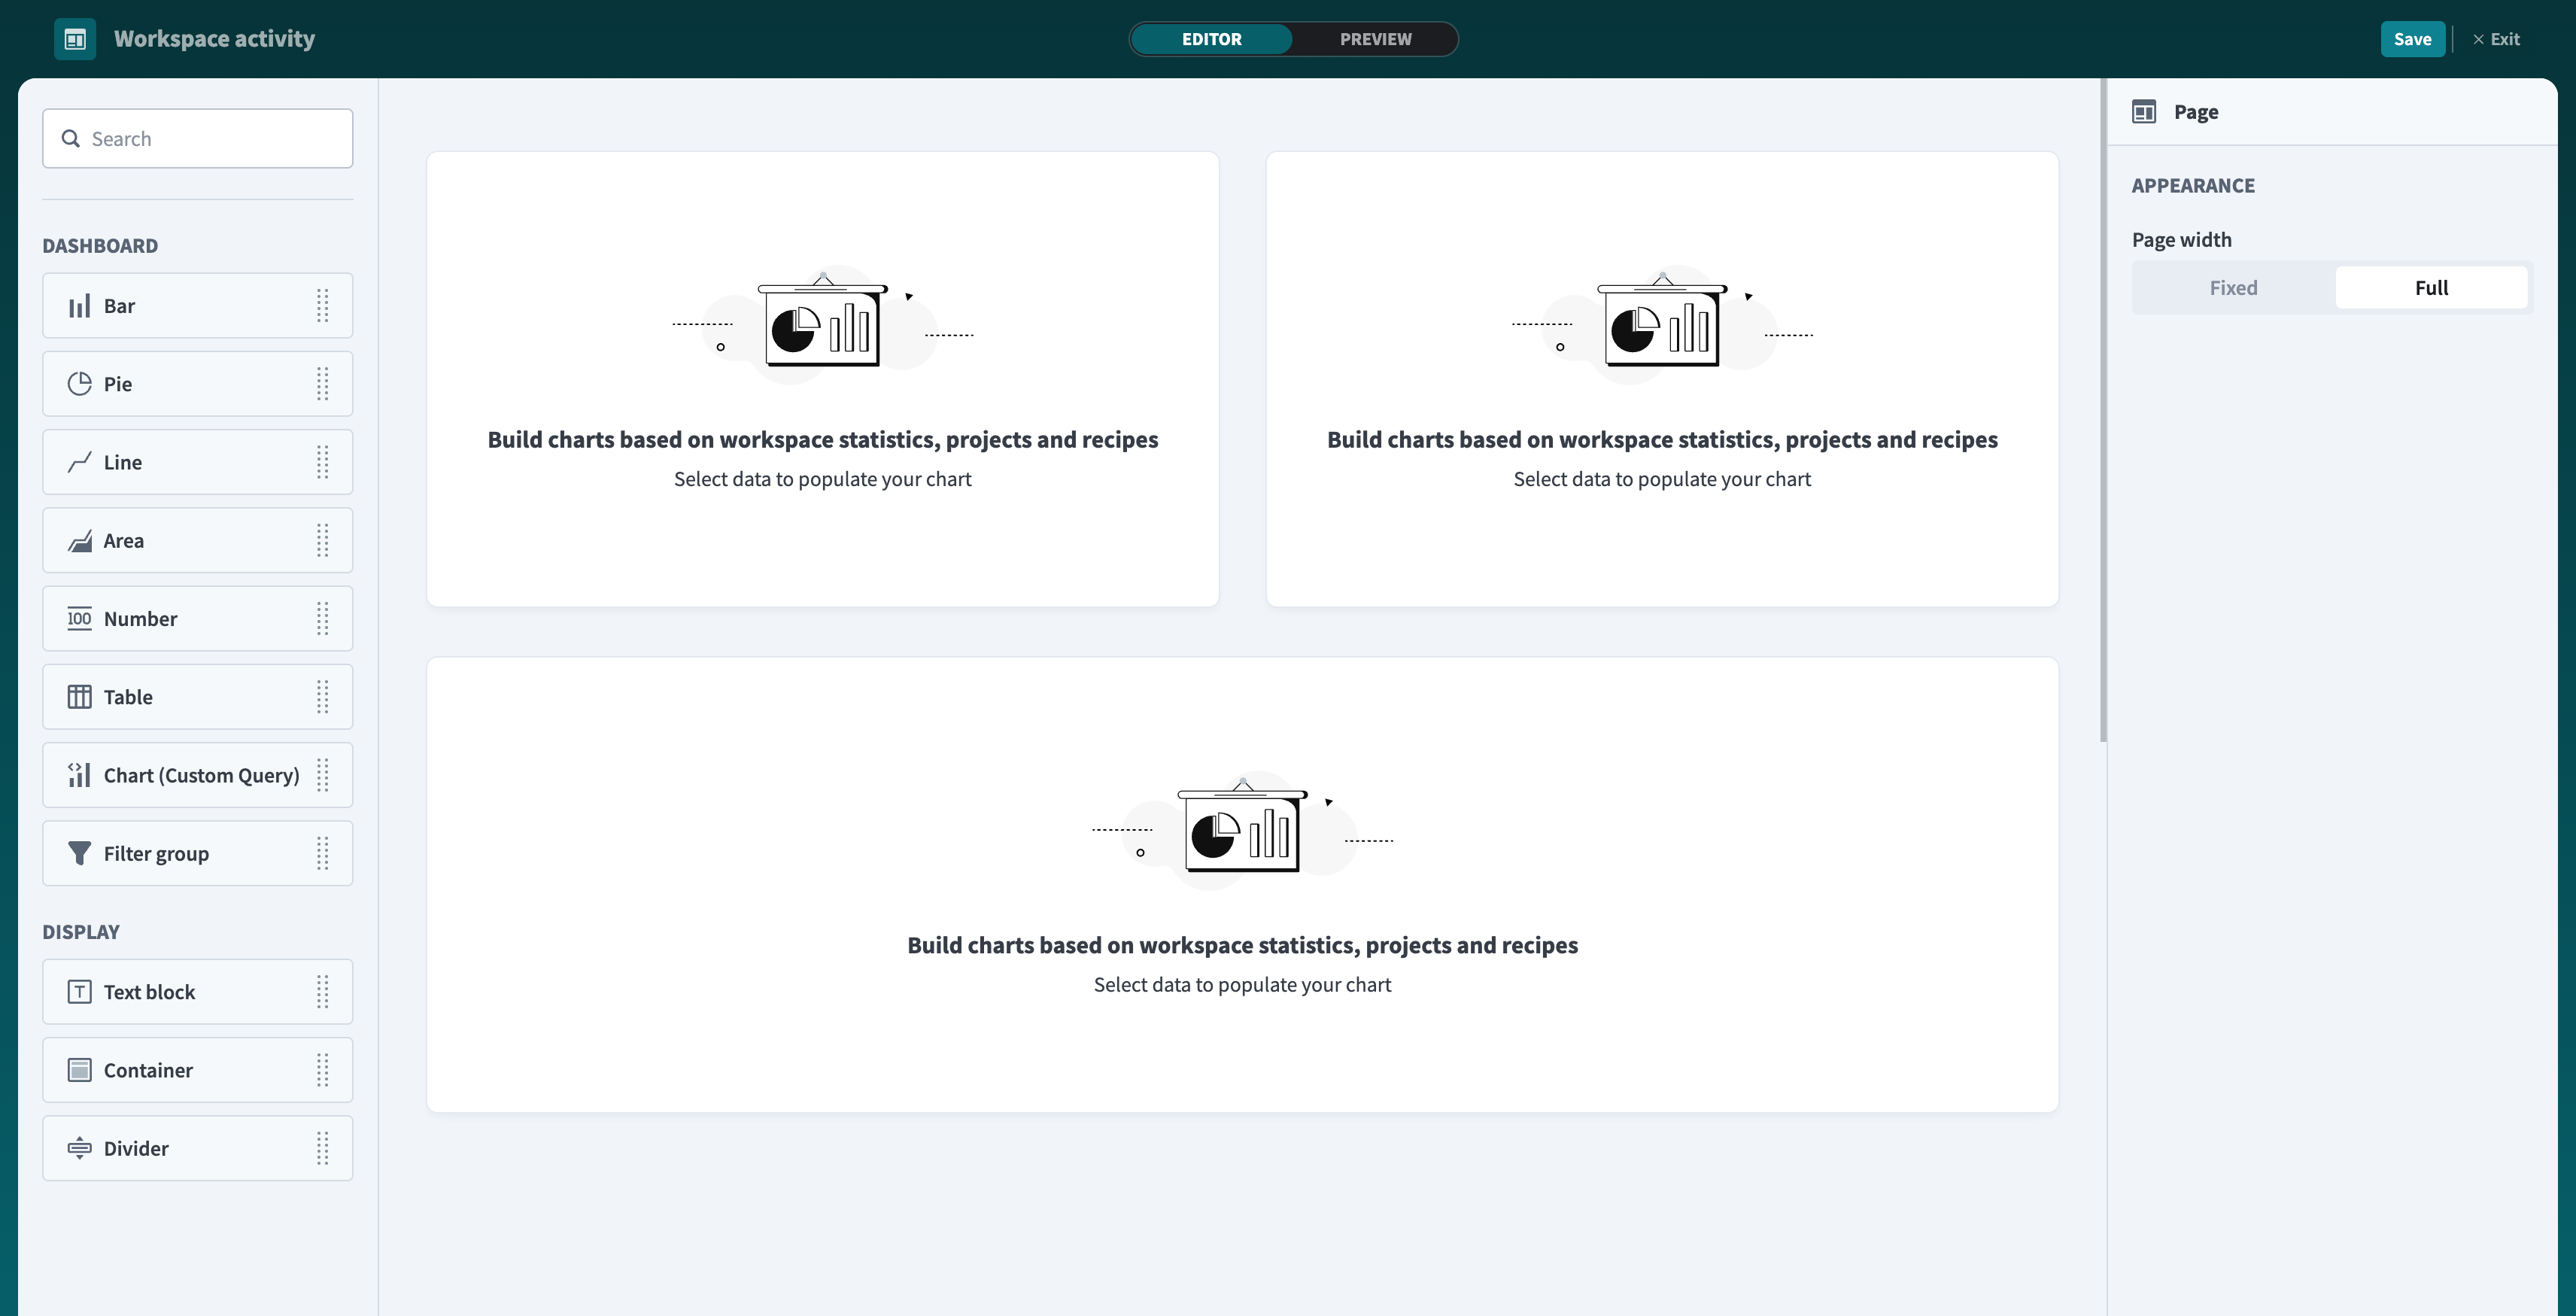 Dashboard editor with Report builder: the components panel shows specific chart types (KPI, Table, Bar, and others) along with a Filter group option
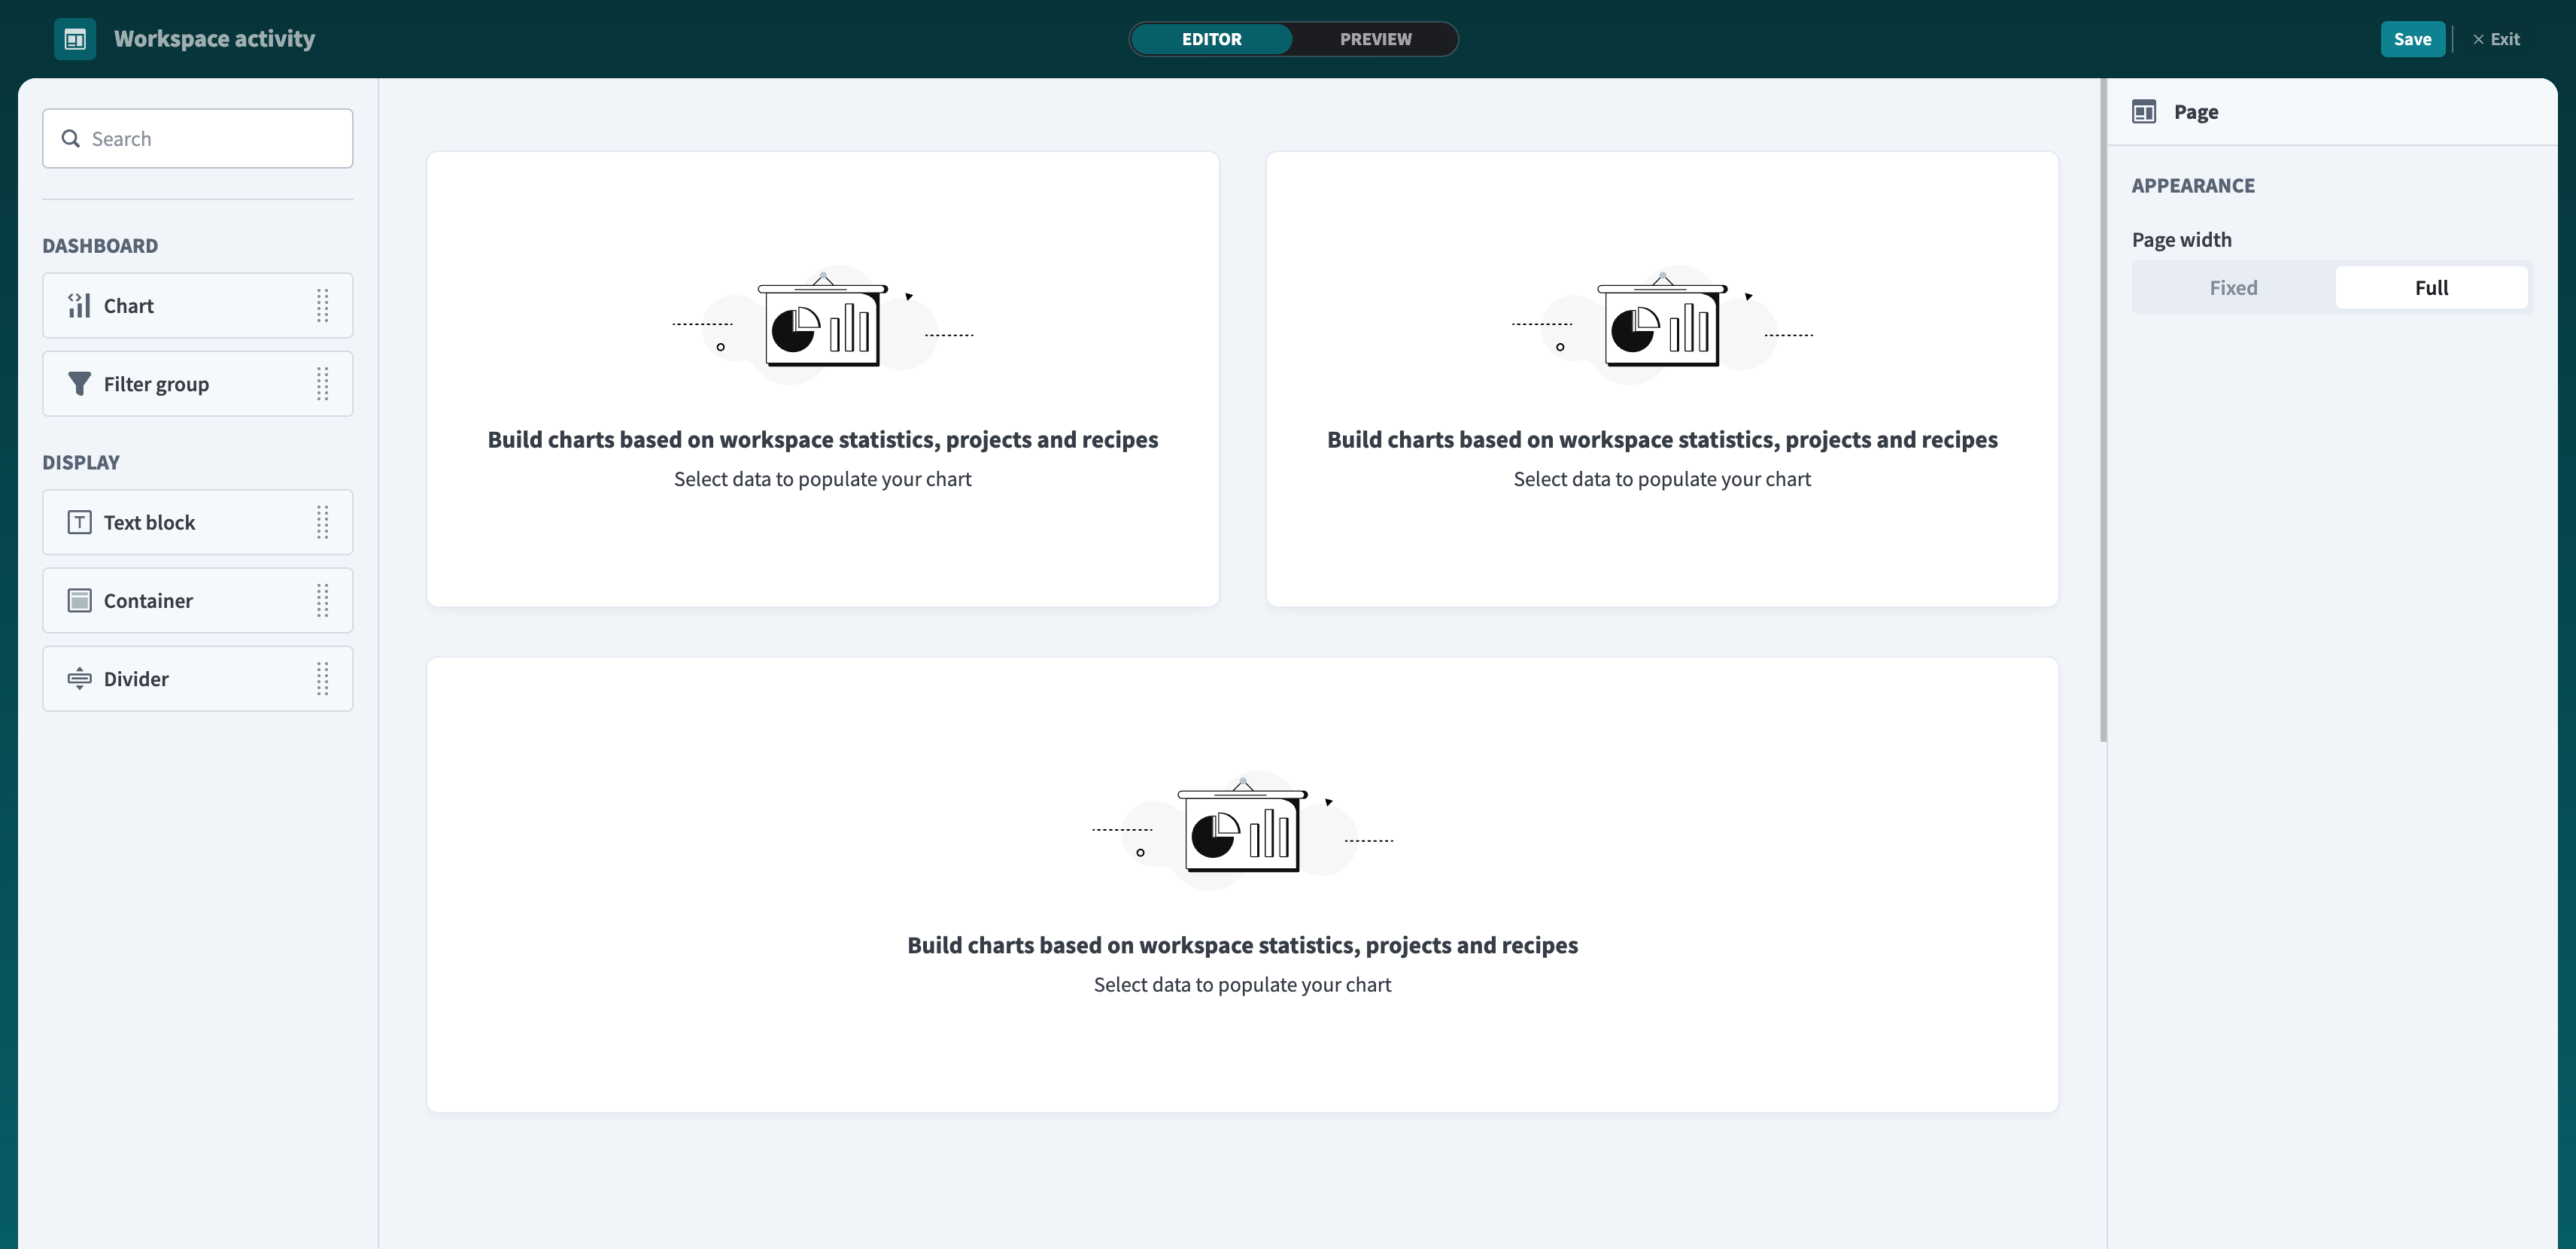 Dashboard editor with Query builder: the components panel shows a generic Chart component and a Filter group option
# Set up your layout
Complete the following steps to set up your layout:
Clear the existing charts from the canvas by selecting each component and clicking Delete.
Drag chart components from the components panel onto the canvas:
Drag chart edges and corners to resize and arrange the charts.
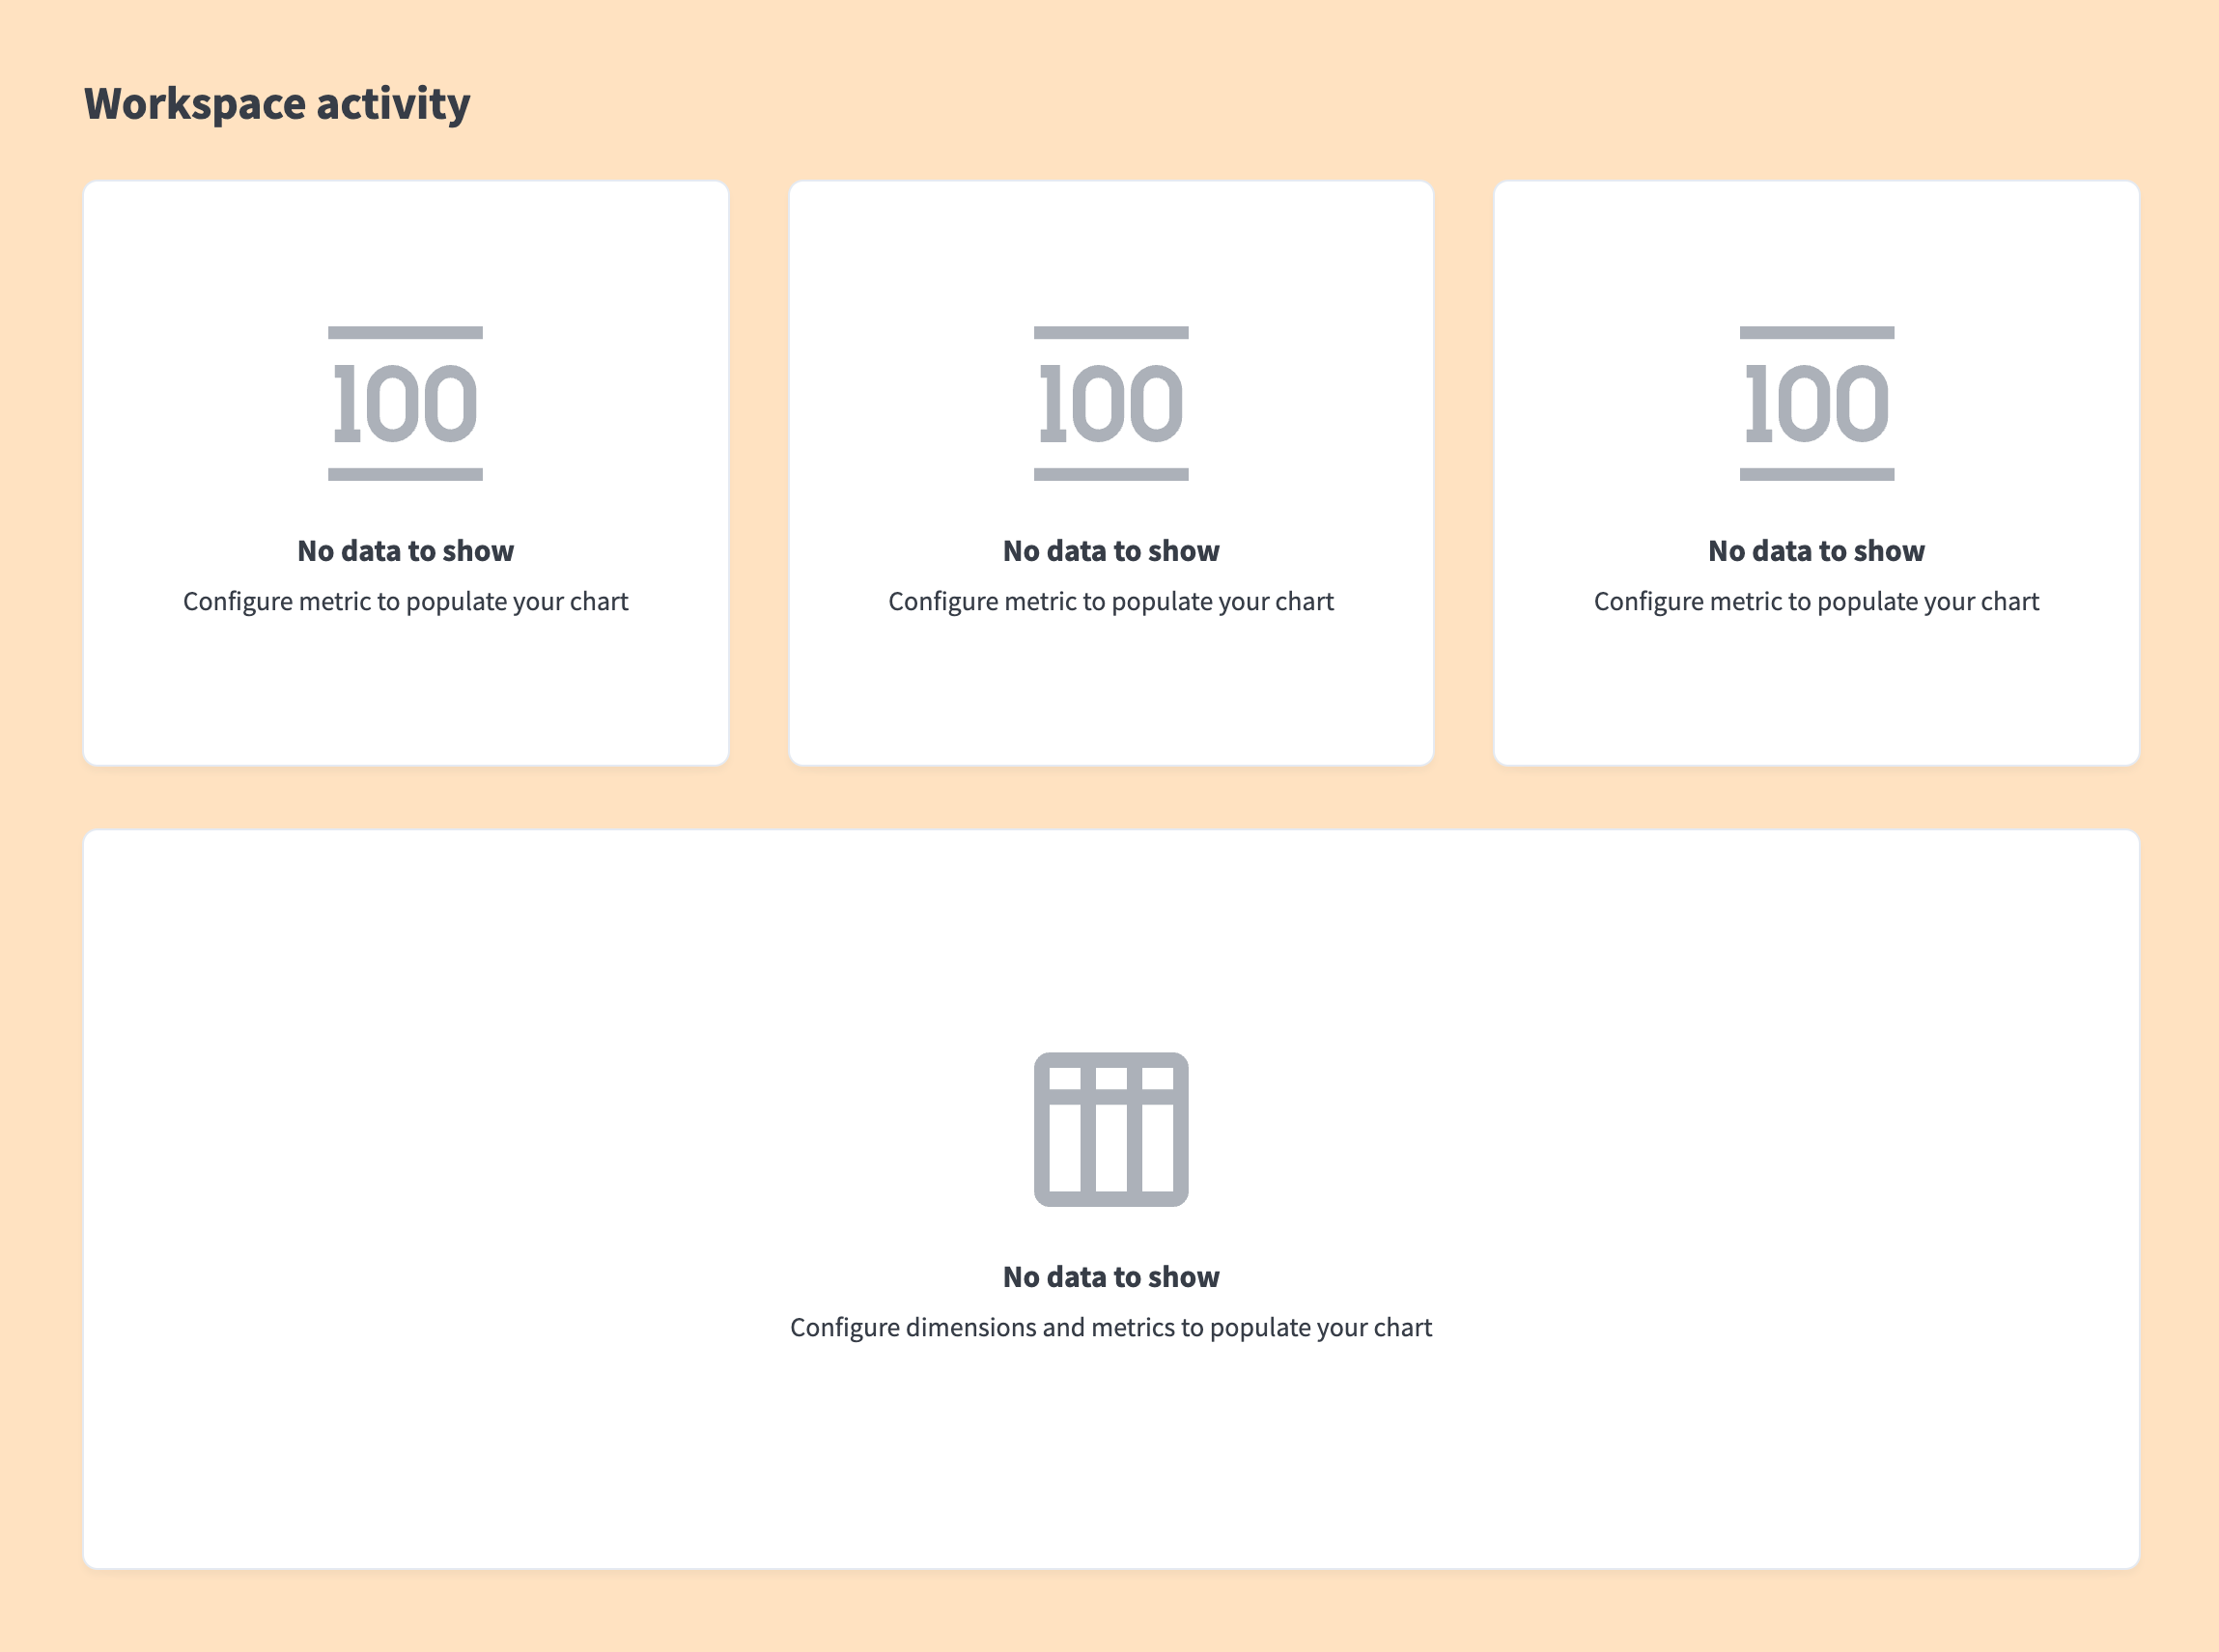 Target layout: three KPI charts on the top row, table spanning full width below
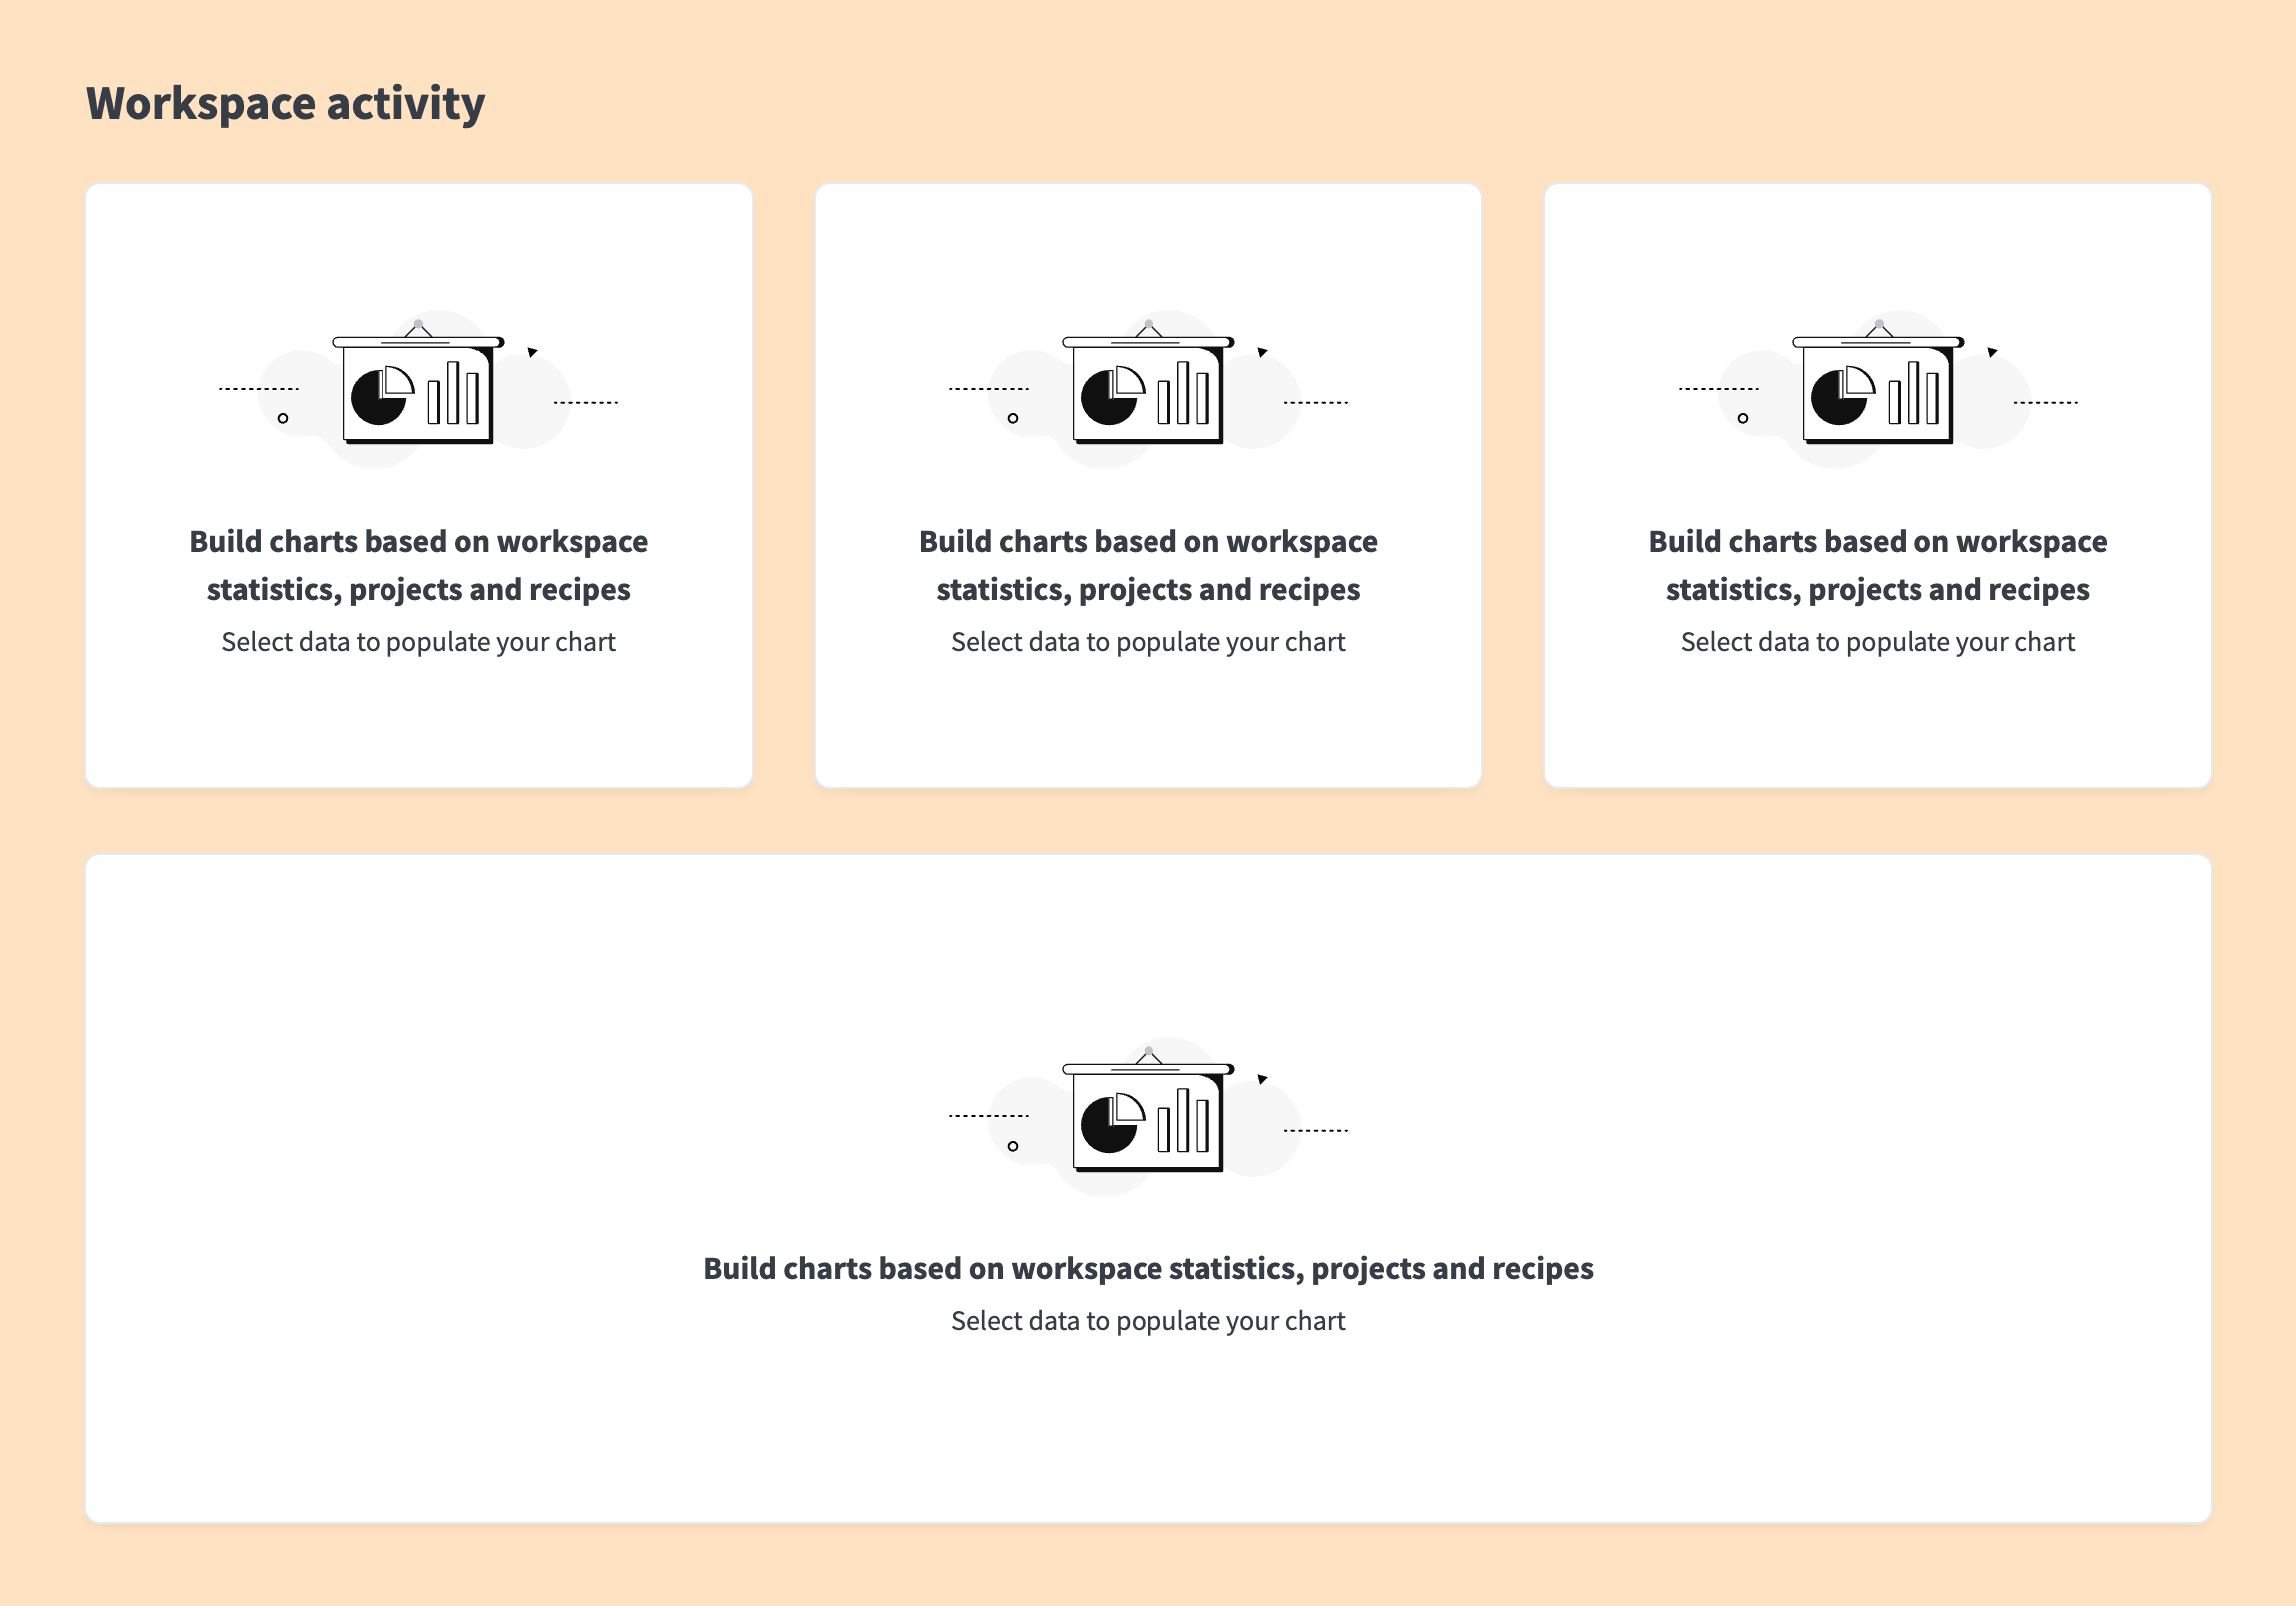 Target layout: three charts on the top row, one chart spanning full width below
DISPLAY COMPONENTS
Add Container and Text block components to provide context and help viewers understand what each chart represents. Use headings and descriptions to add background.
# Configure your charts
Select a chart on the canvas and click Edit to open the chart editor. The Report builder lets you pick a pre-built metric with minimal configuration. The Query builder requires you to build the query yourself step by step.
QUERY BUILDER PATTERN
Each chart in the query builder follows the same pattern:
- Select a data source
- Add Filter steps to narrow the data
- Add a Summarize step to aggregate it into a metric
- Configure Chart settings to choose how it's displayed
The results table updates after each step so you can see what your query returns.
# Chart 1: Active recipes
This KPI chart shows how many recipes are currently running in your workspace. Use this to verify that your automations are running as expected.
 Active recipes KPI chart
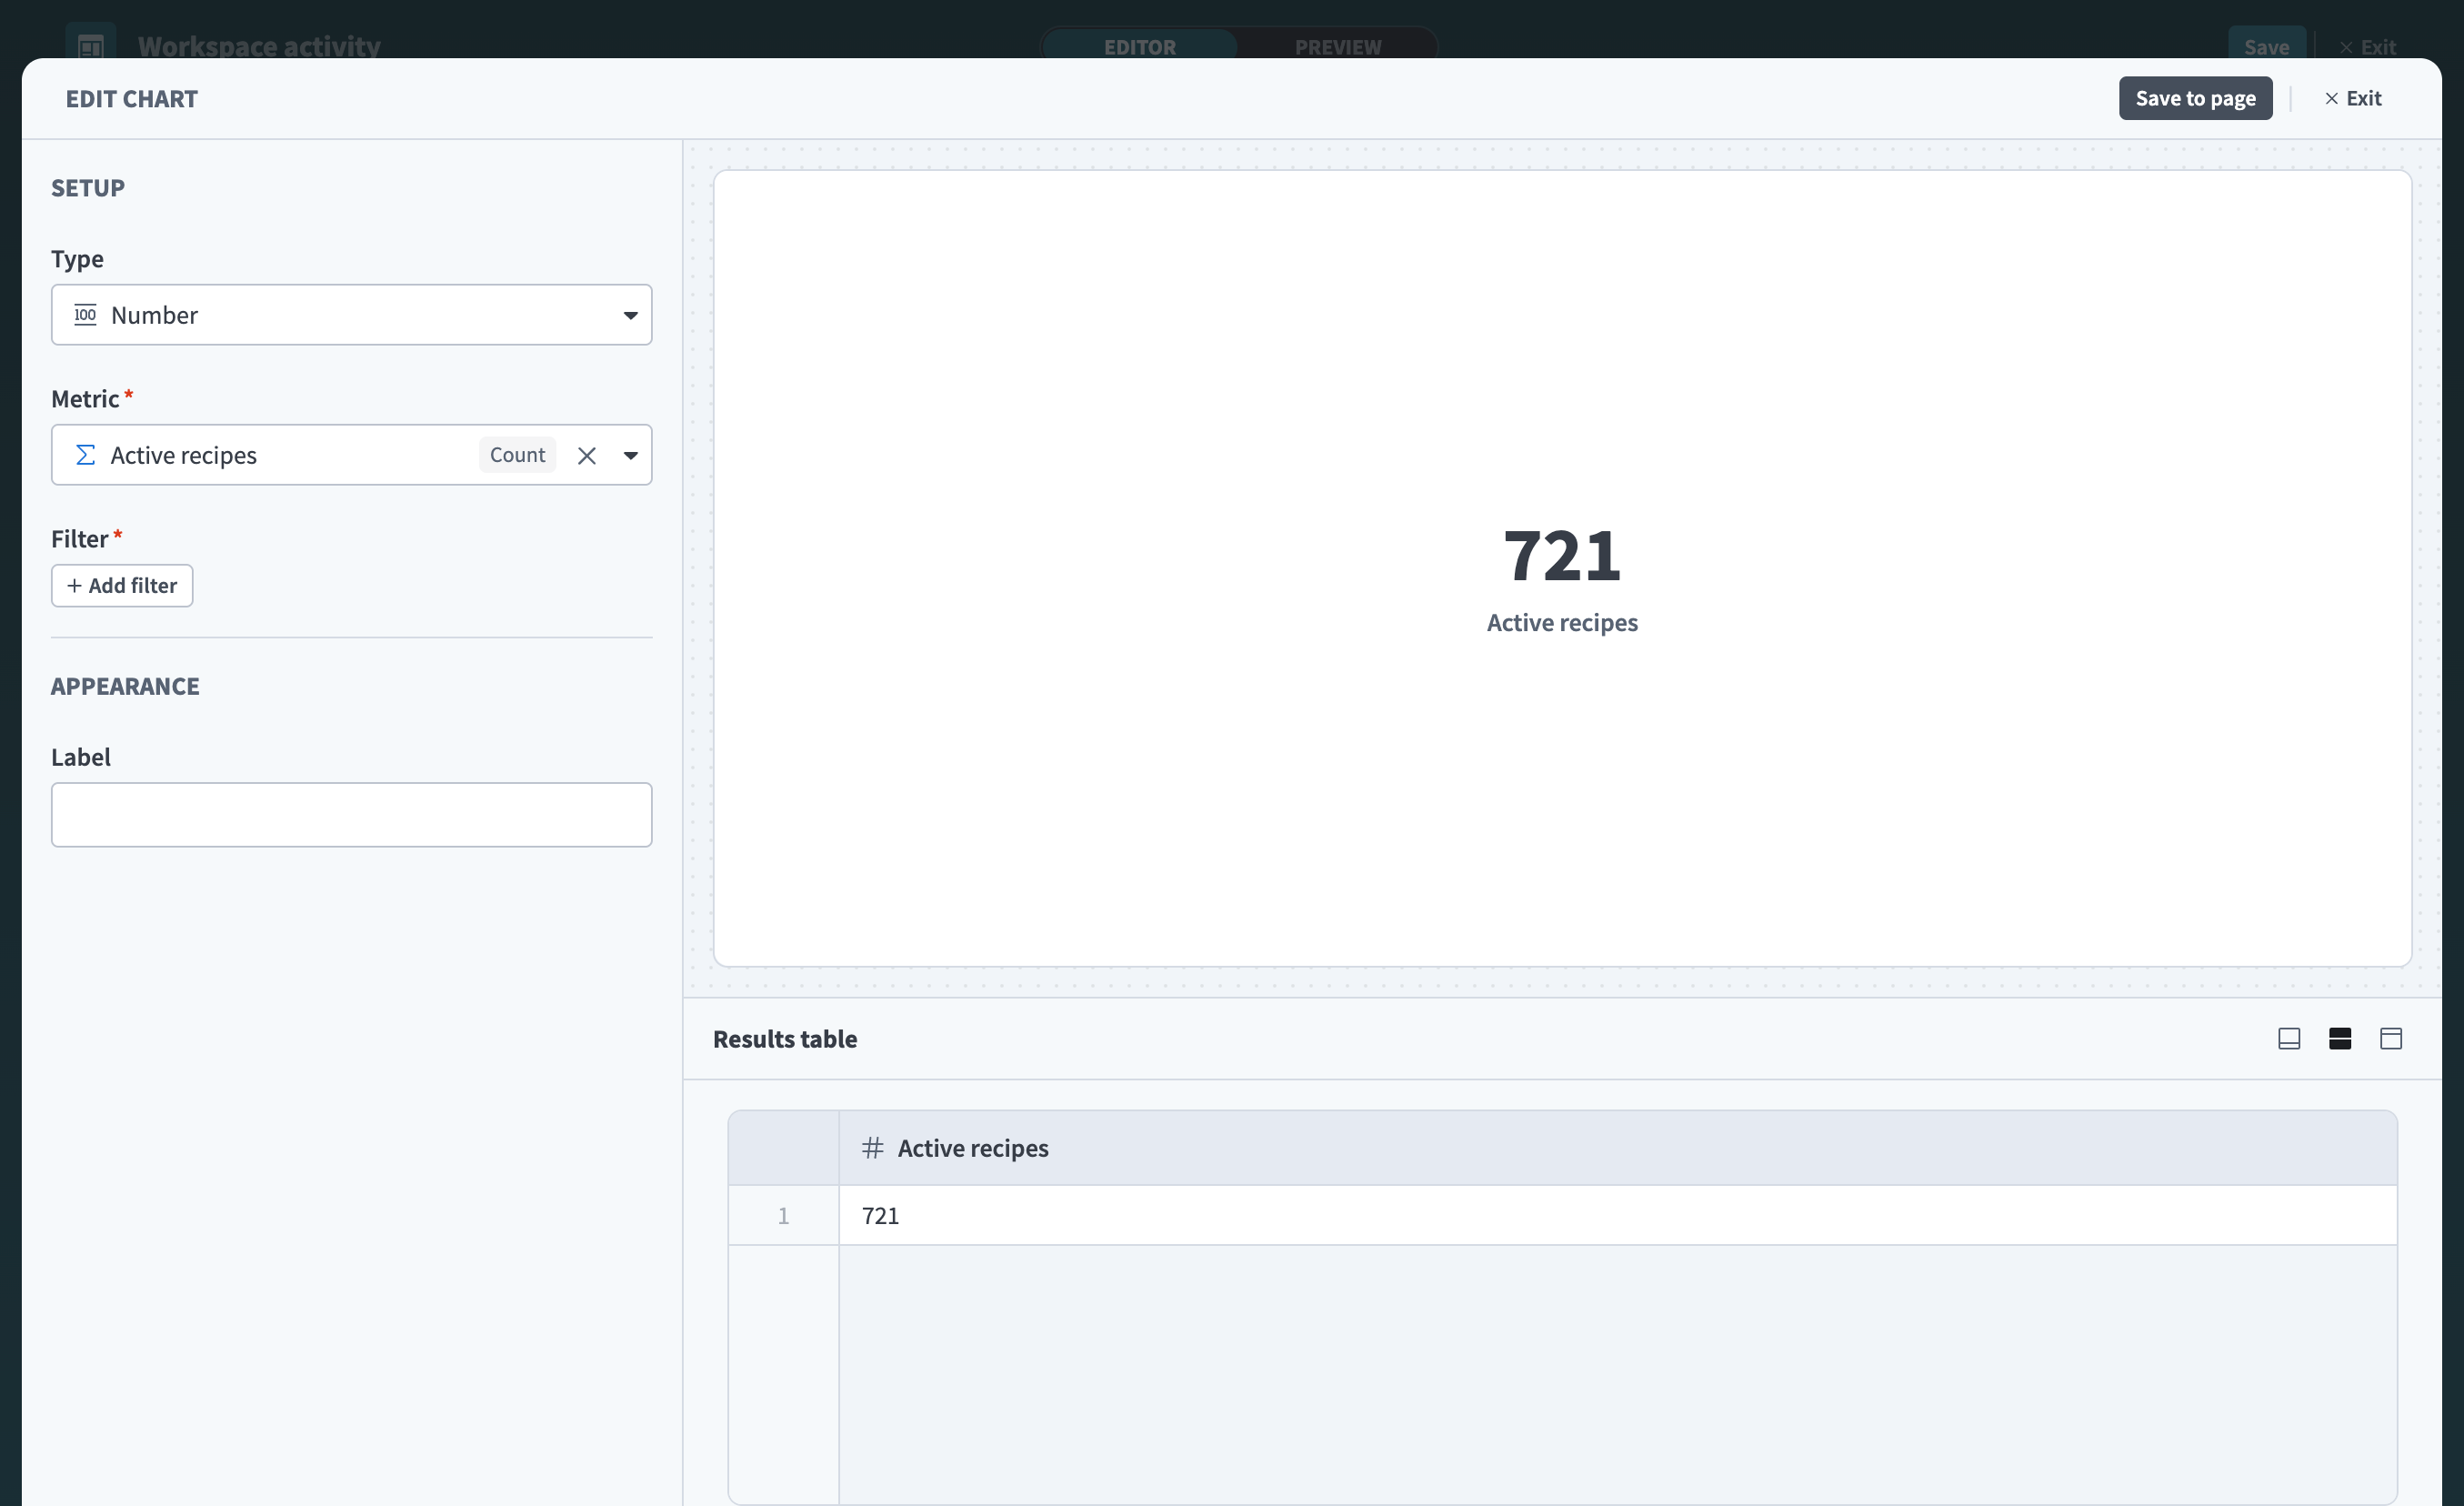 Active recipes chart configured in the Report builder
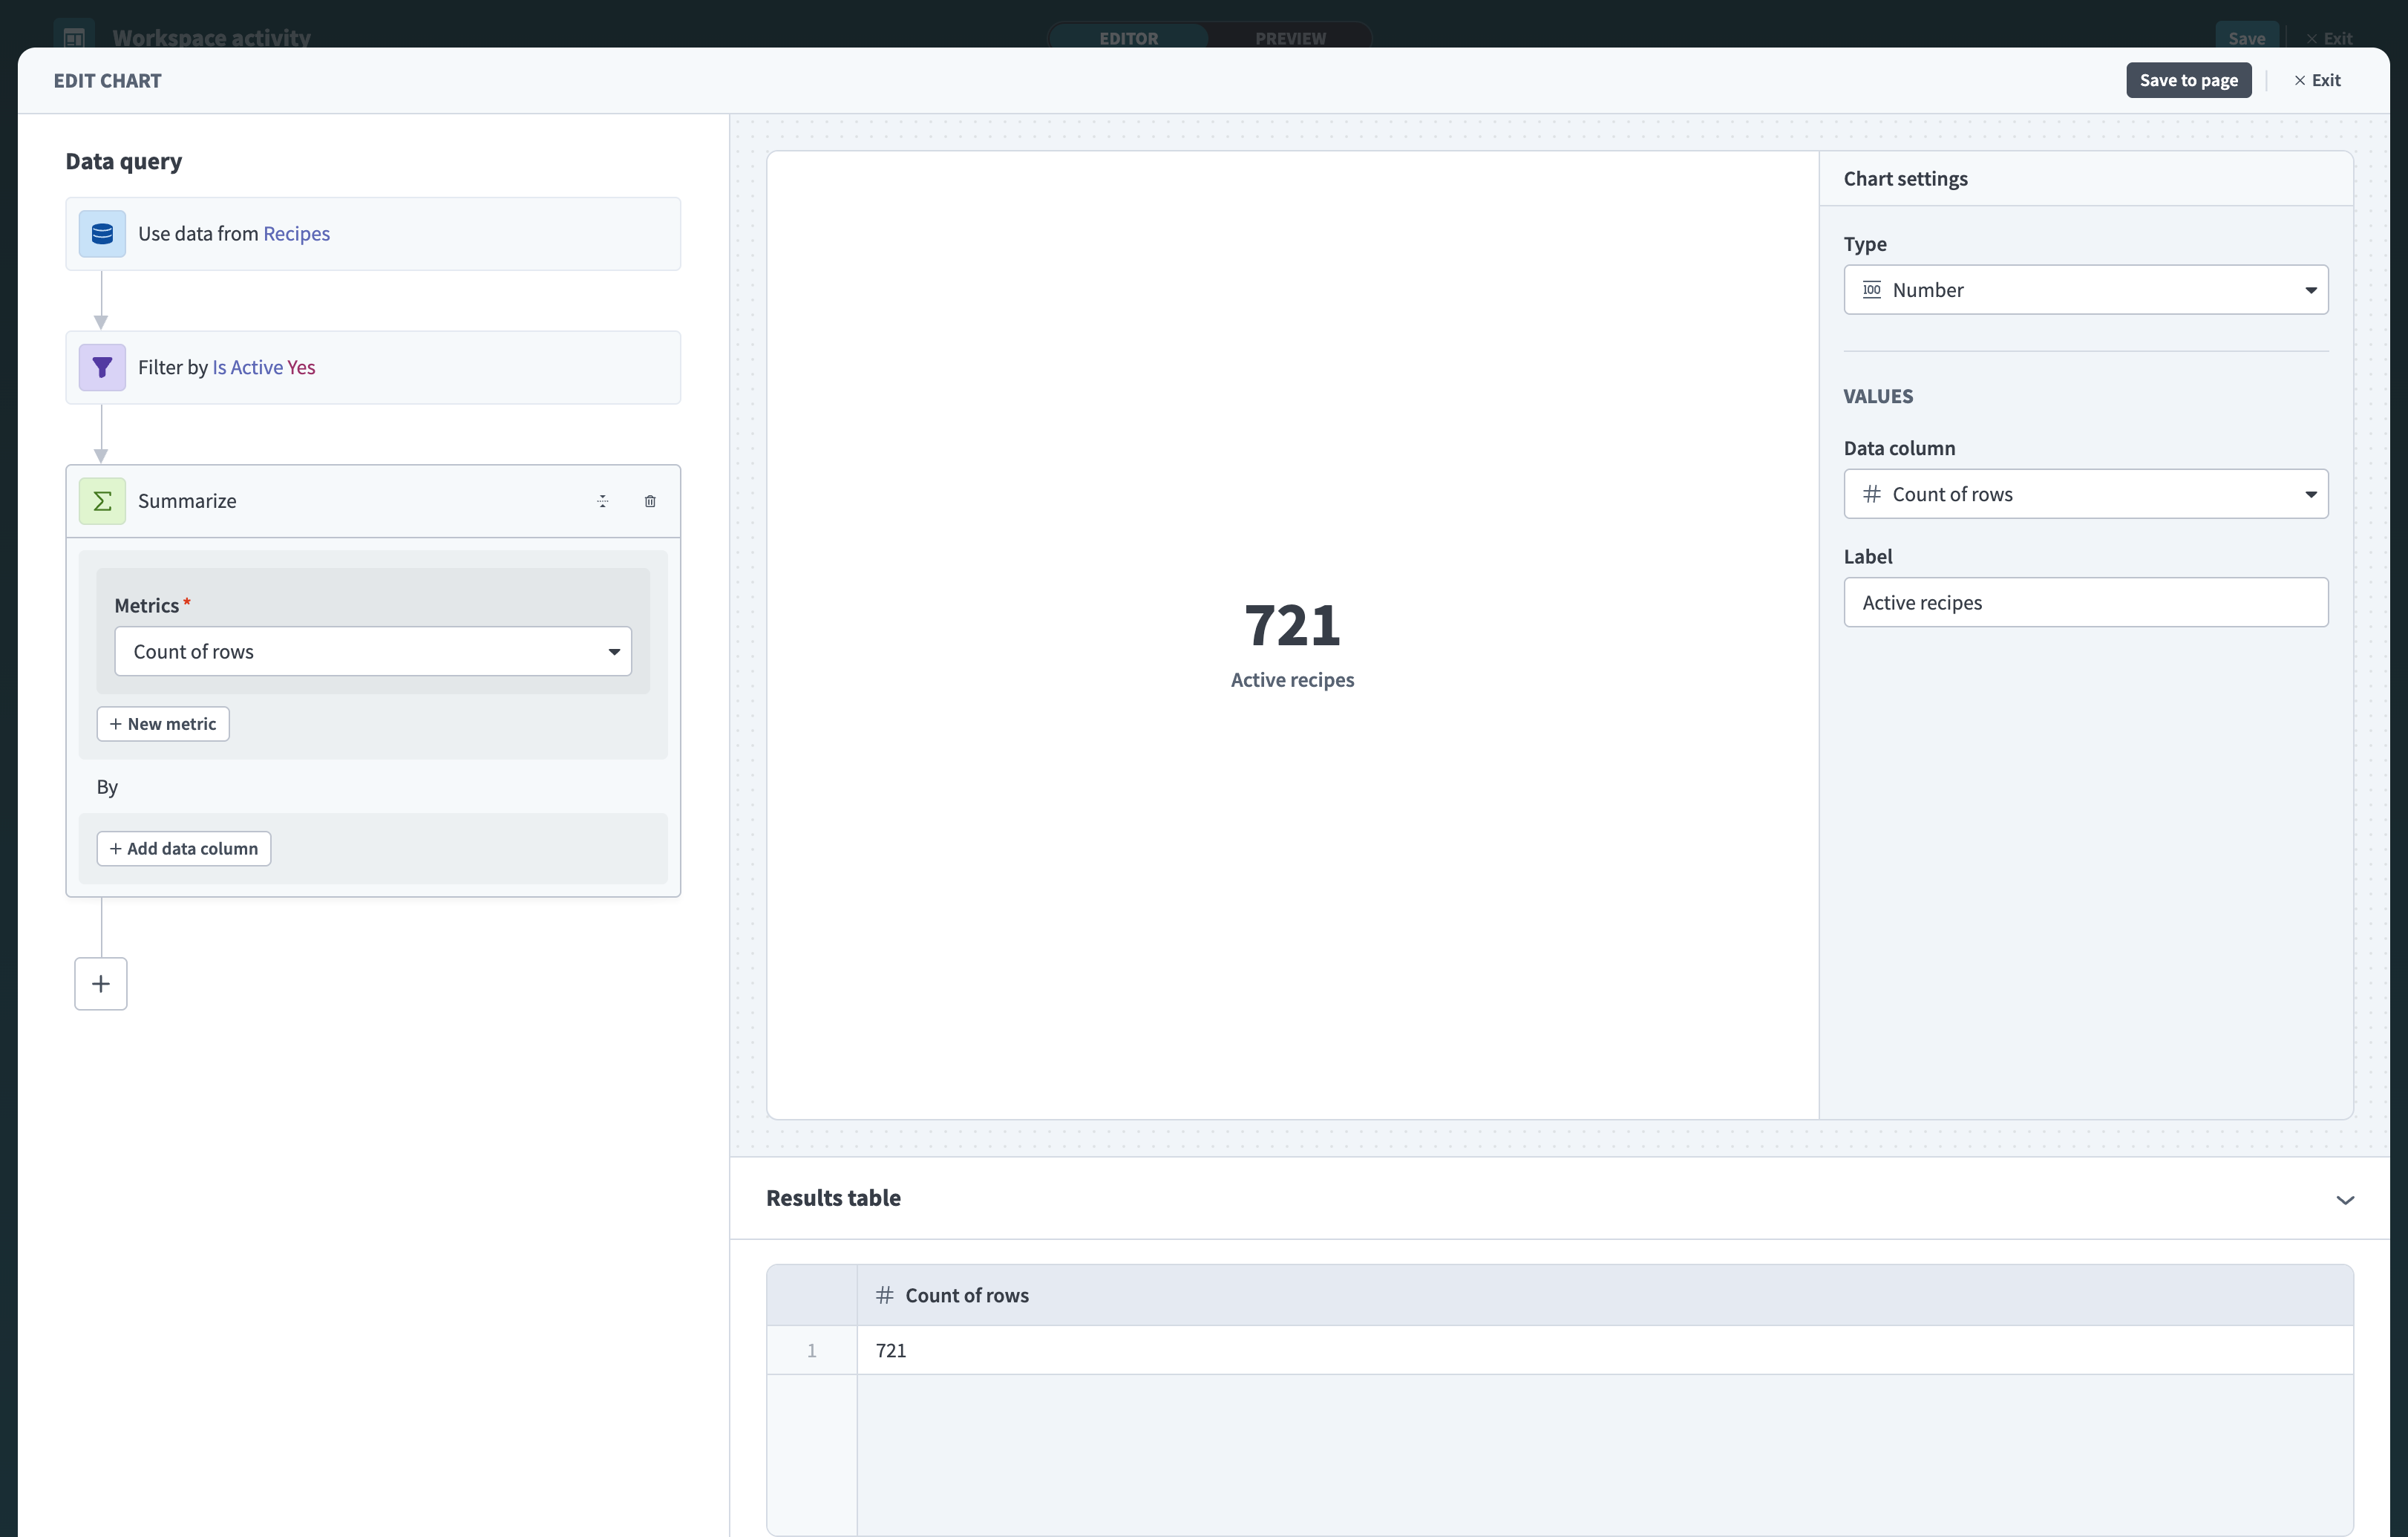 Active recipes chart configured in the query builder
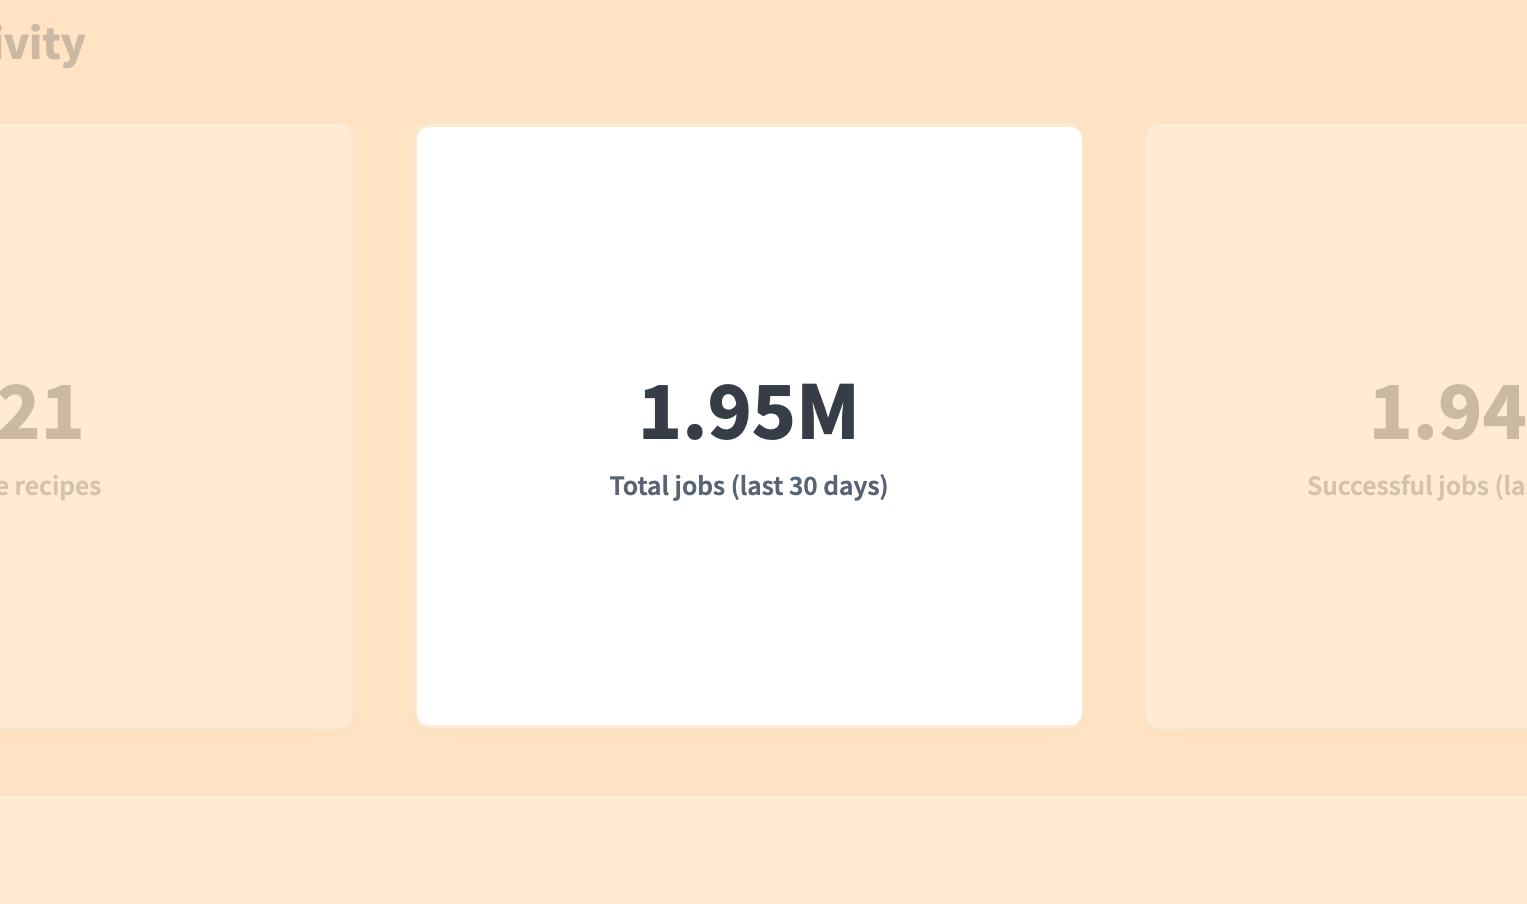
# Chart 2: Total jobs (last 30 days)
This KPI chart shows how many jobs ran in your workspace over the past 30 days. Use this to measure how actively your automations are being used.
 Total jobs chart
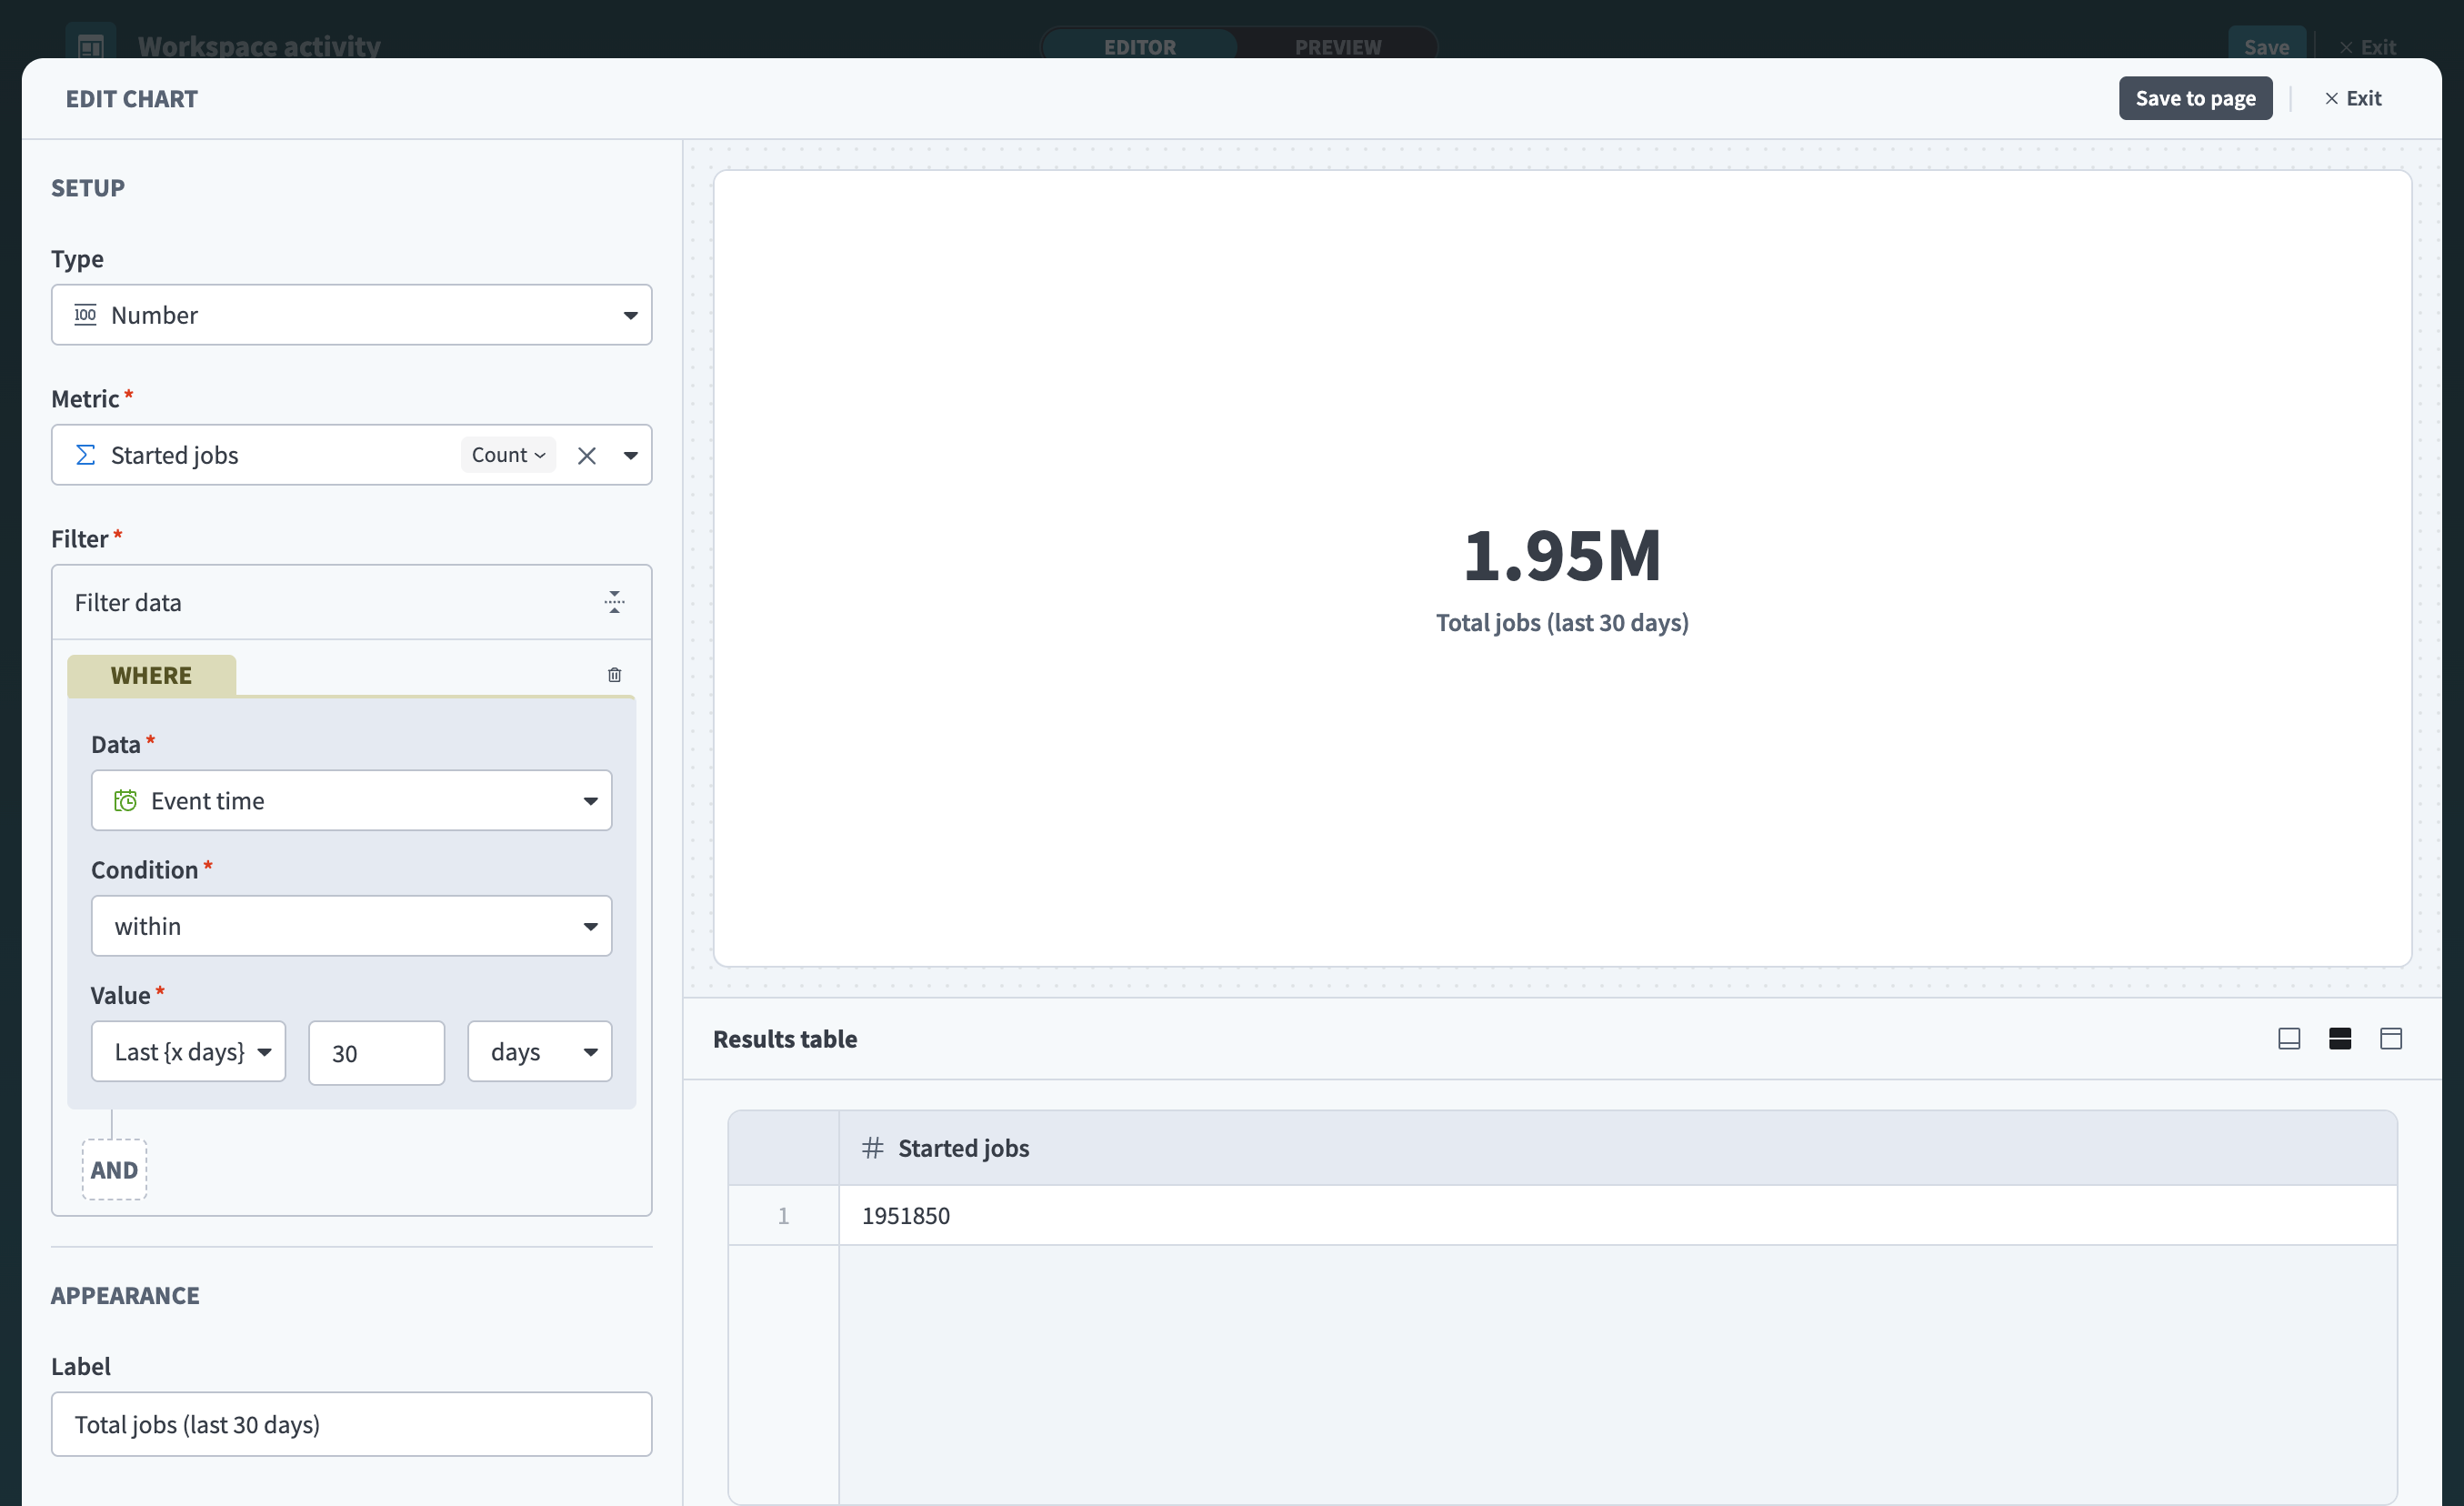 Total jobs chart with date filter and custom label
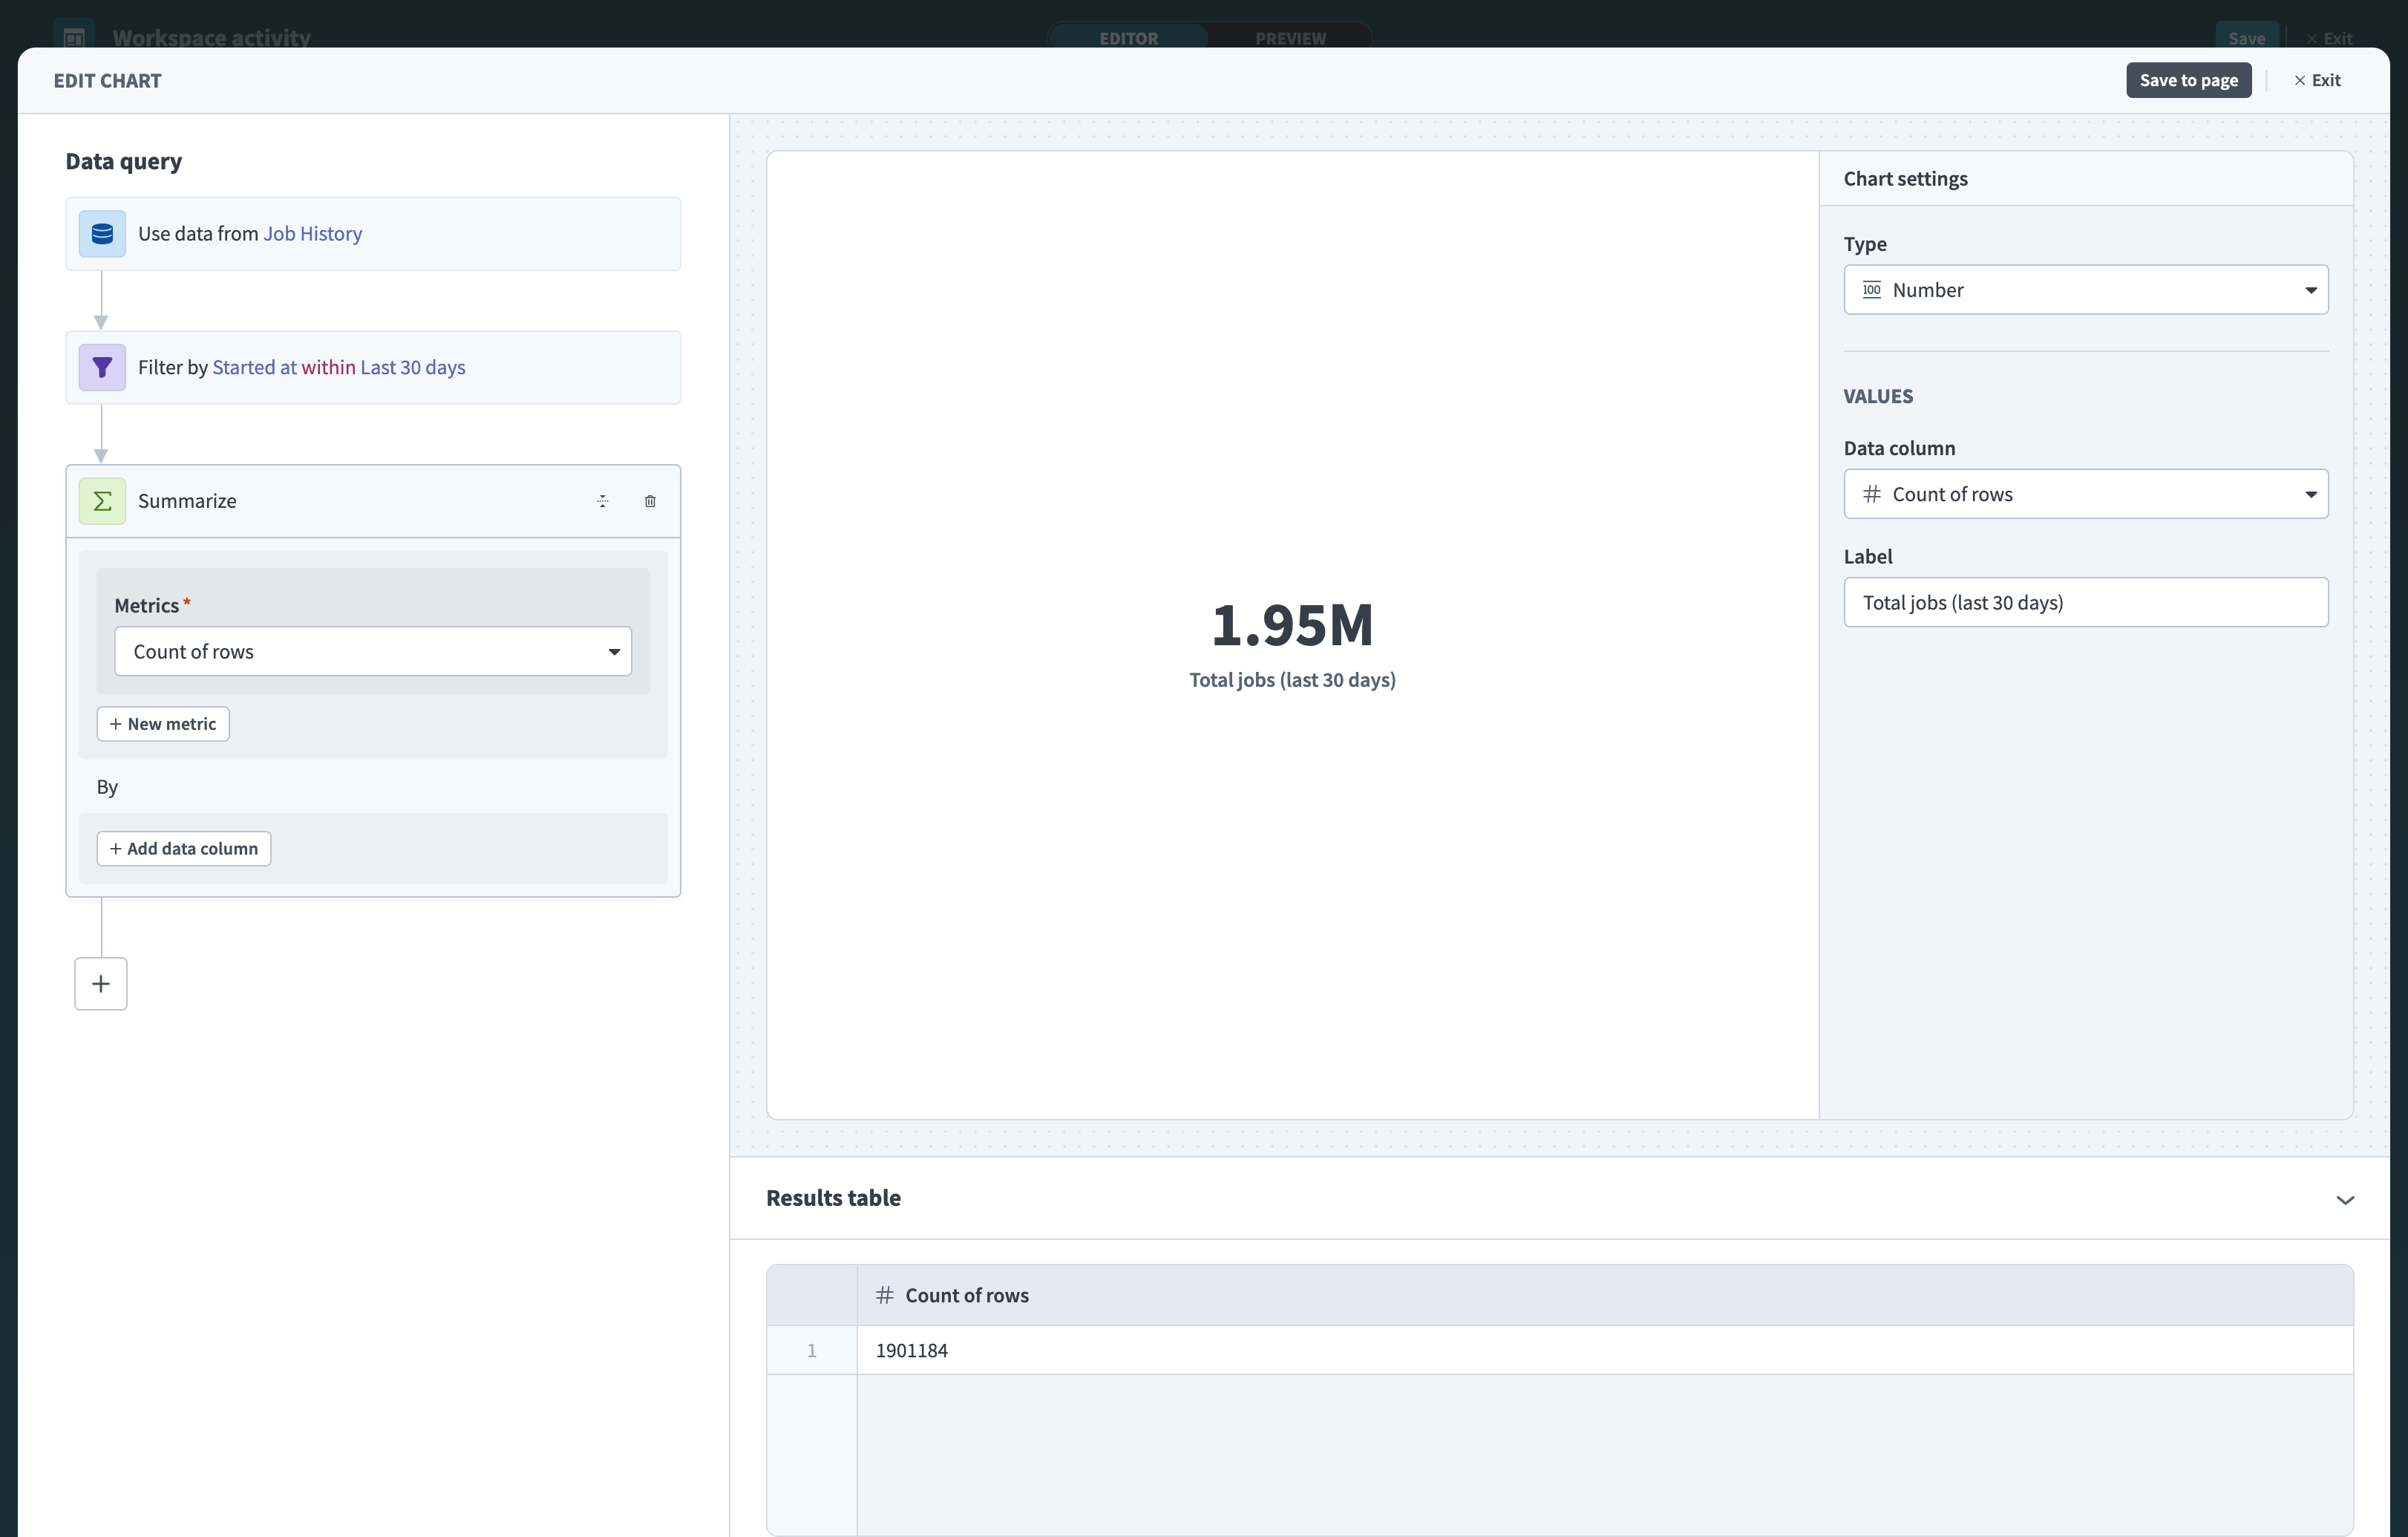 Total jobs chart with date filter and custom label
# Chart 3: Successful jobs (last 30 days)
This KPI chart shows how many jobs completed without errors in the past 30 days. Use this alongside total jobs to see how reliably your automations are running.
 Successful jobs chart
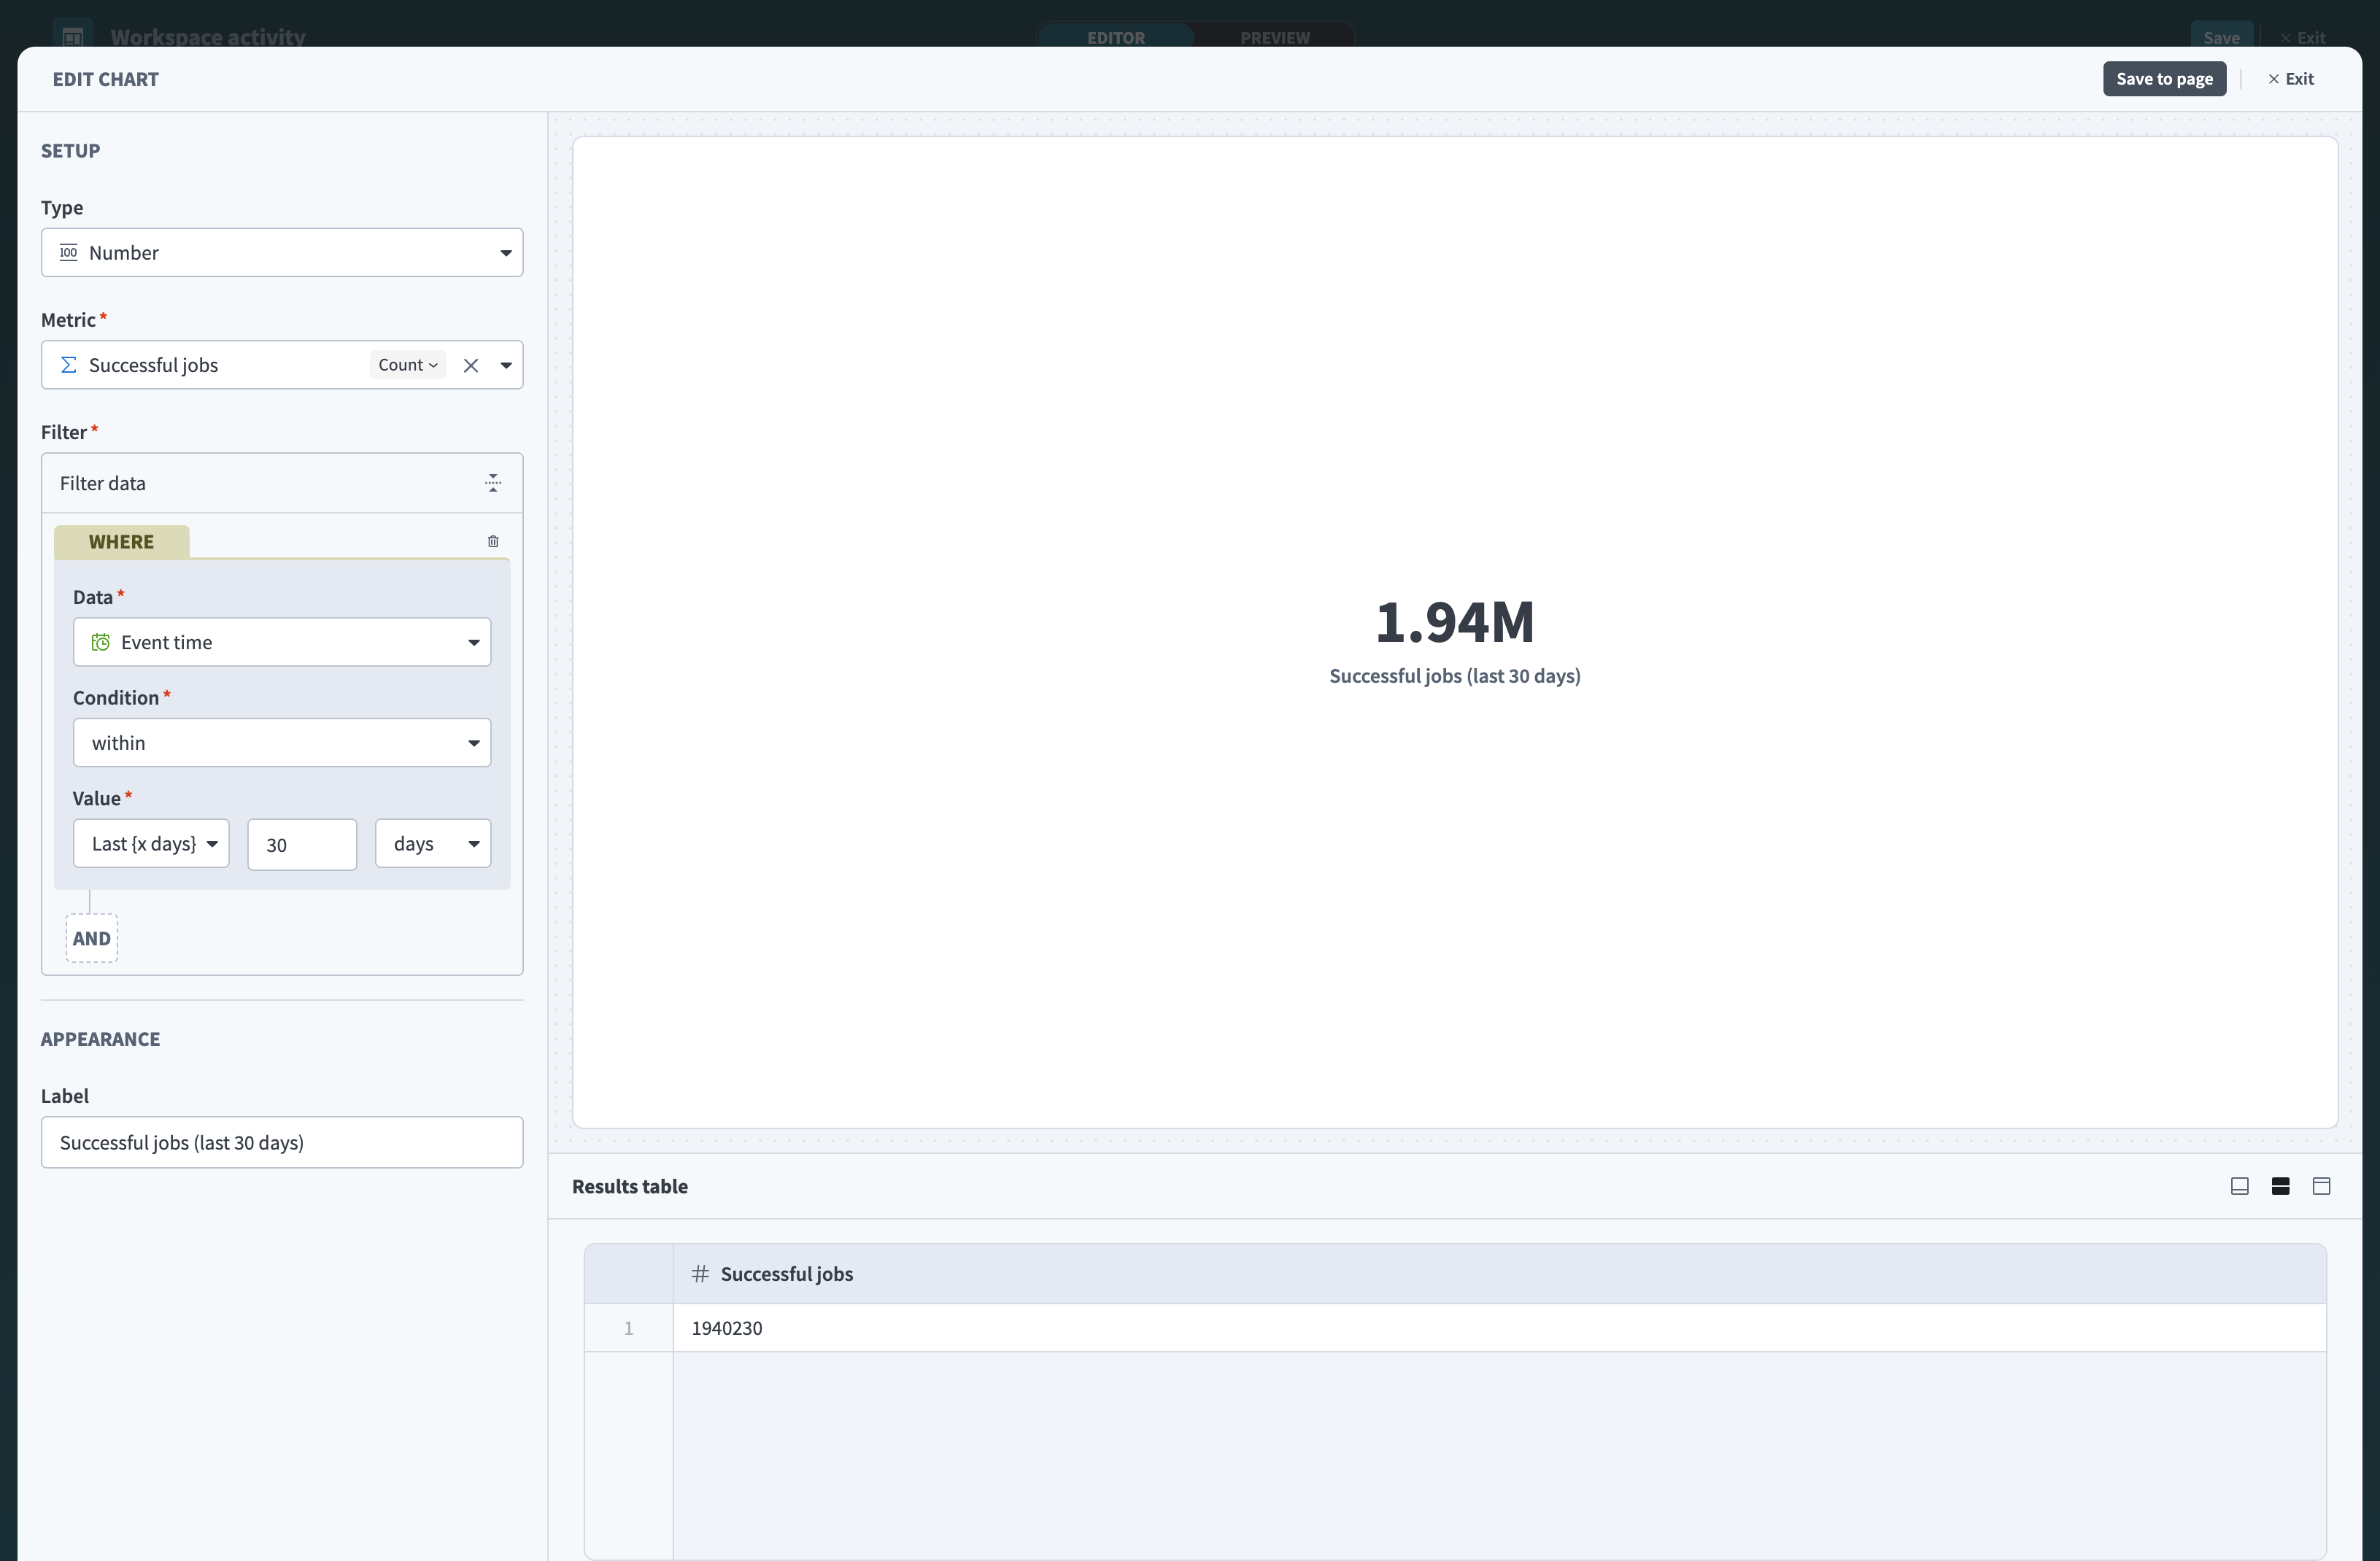 Successful jobs chart with date filter and custom label
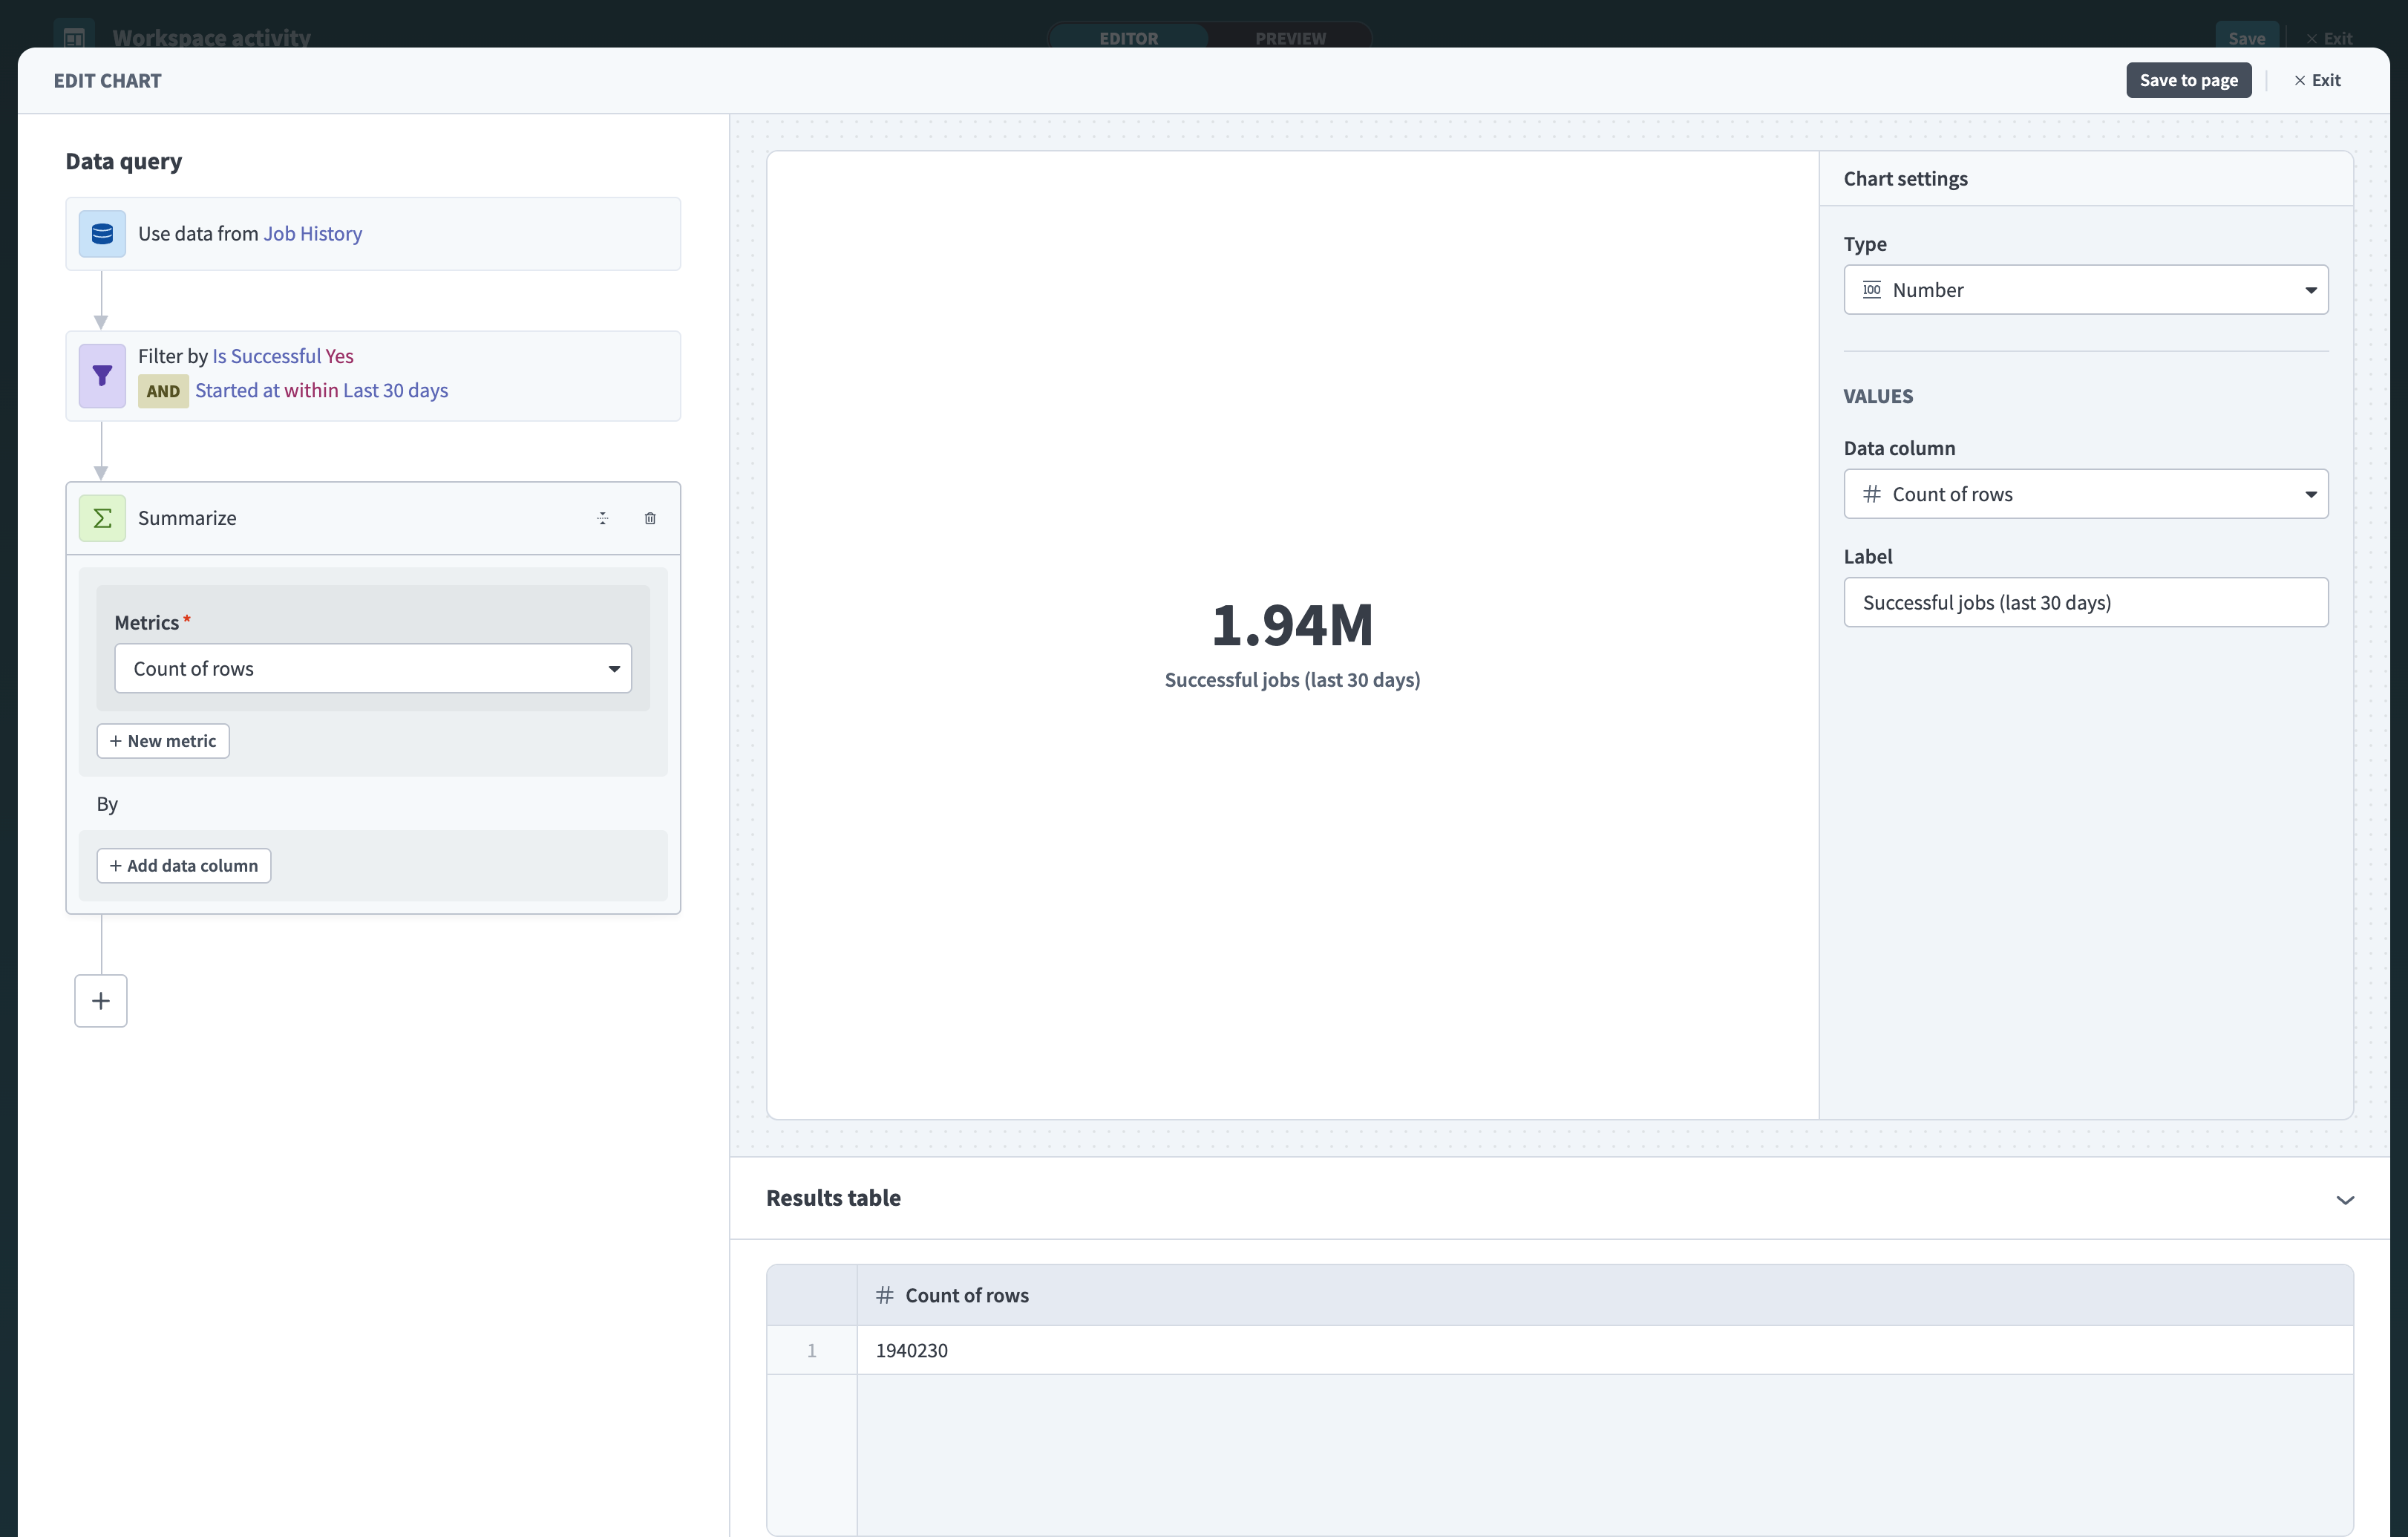 Successful jobs chart with date filter and custom label
# Chart 4: Top active projects
This table ranks your projects by the number of active recipes. Use this to see which projects have the most automations running and understand automation adoption across teams or departments.
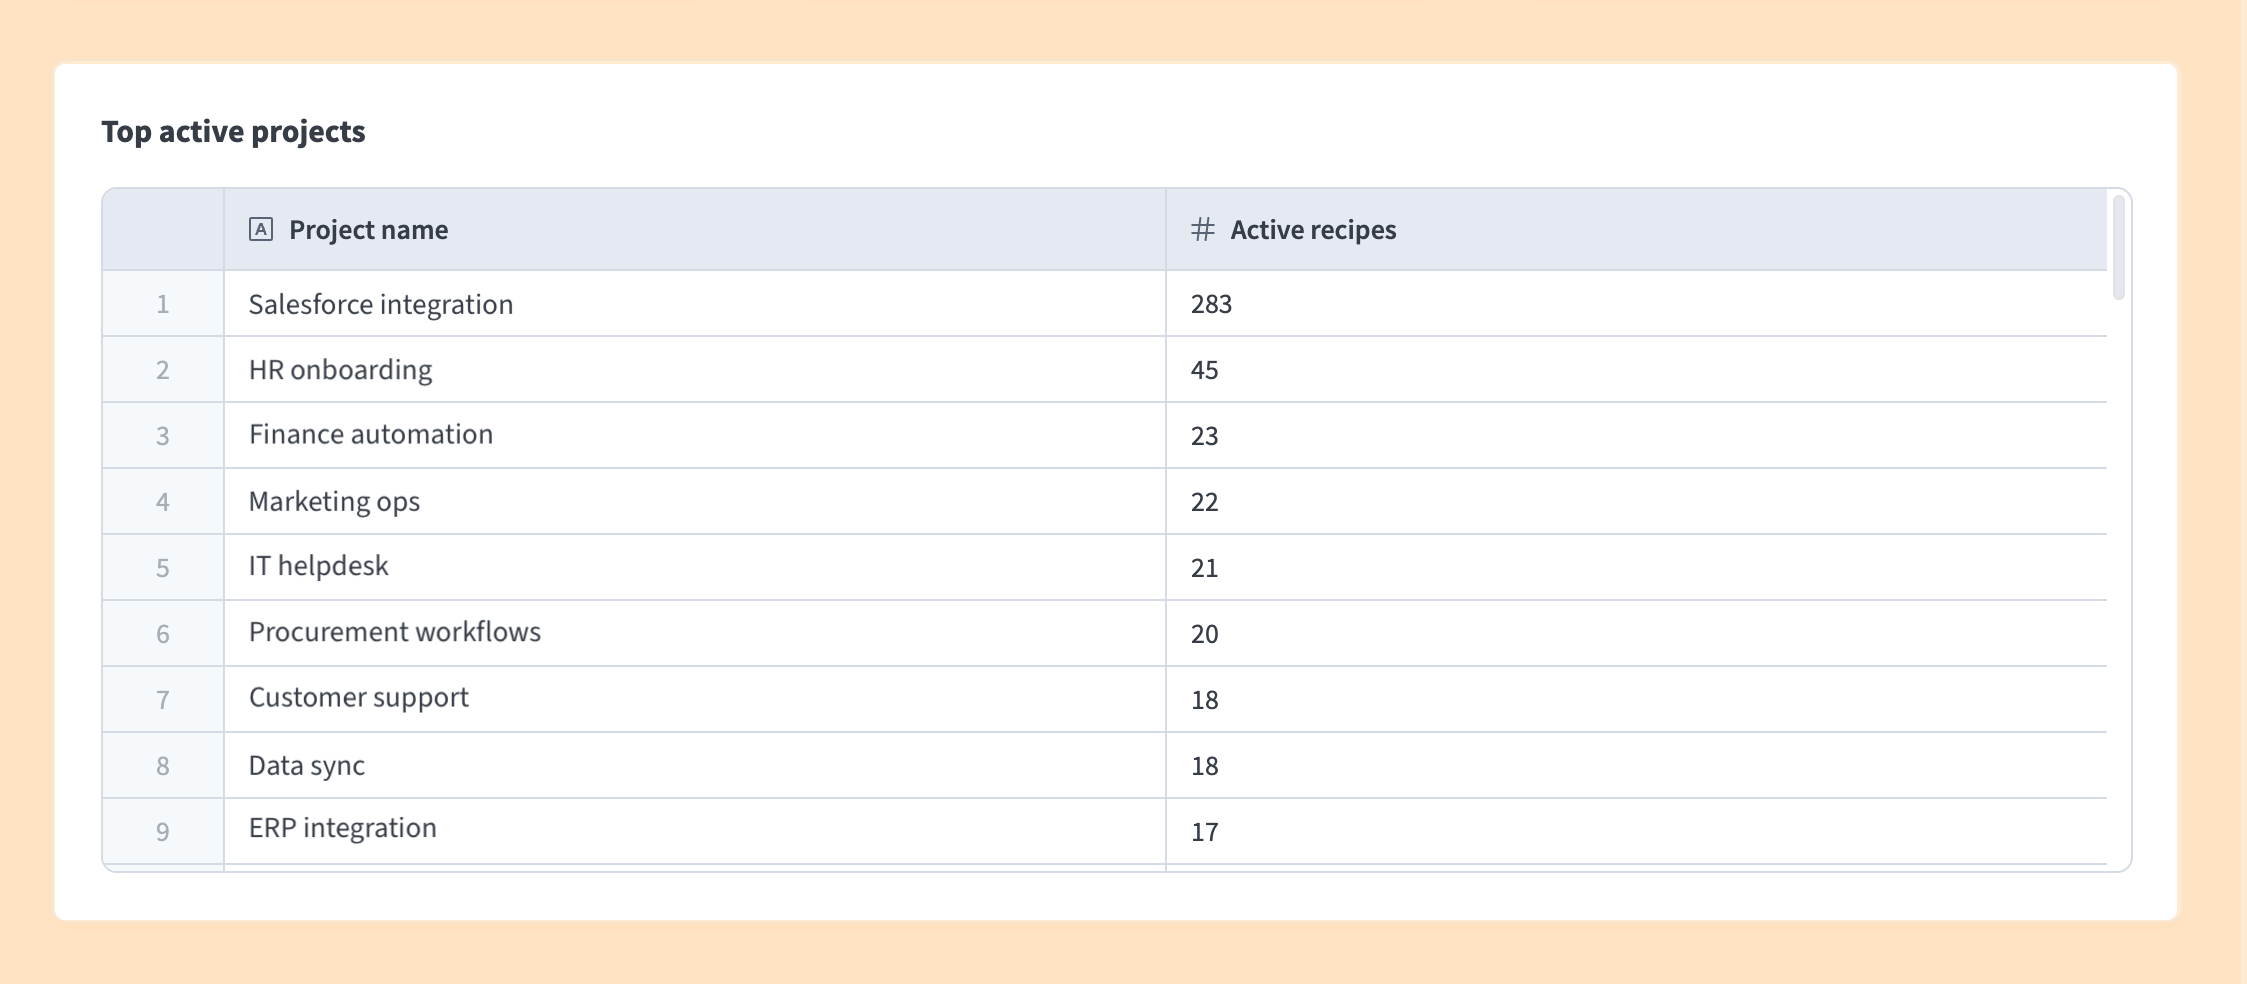 Top active projects chart
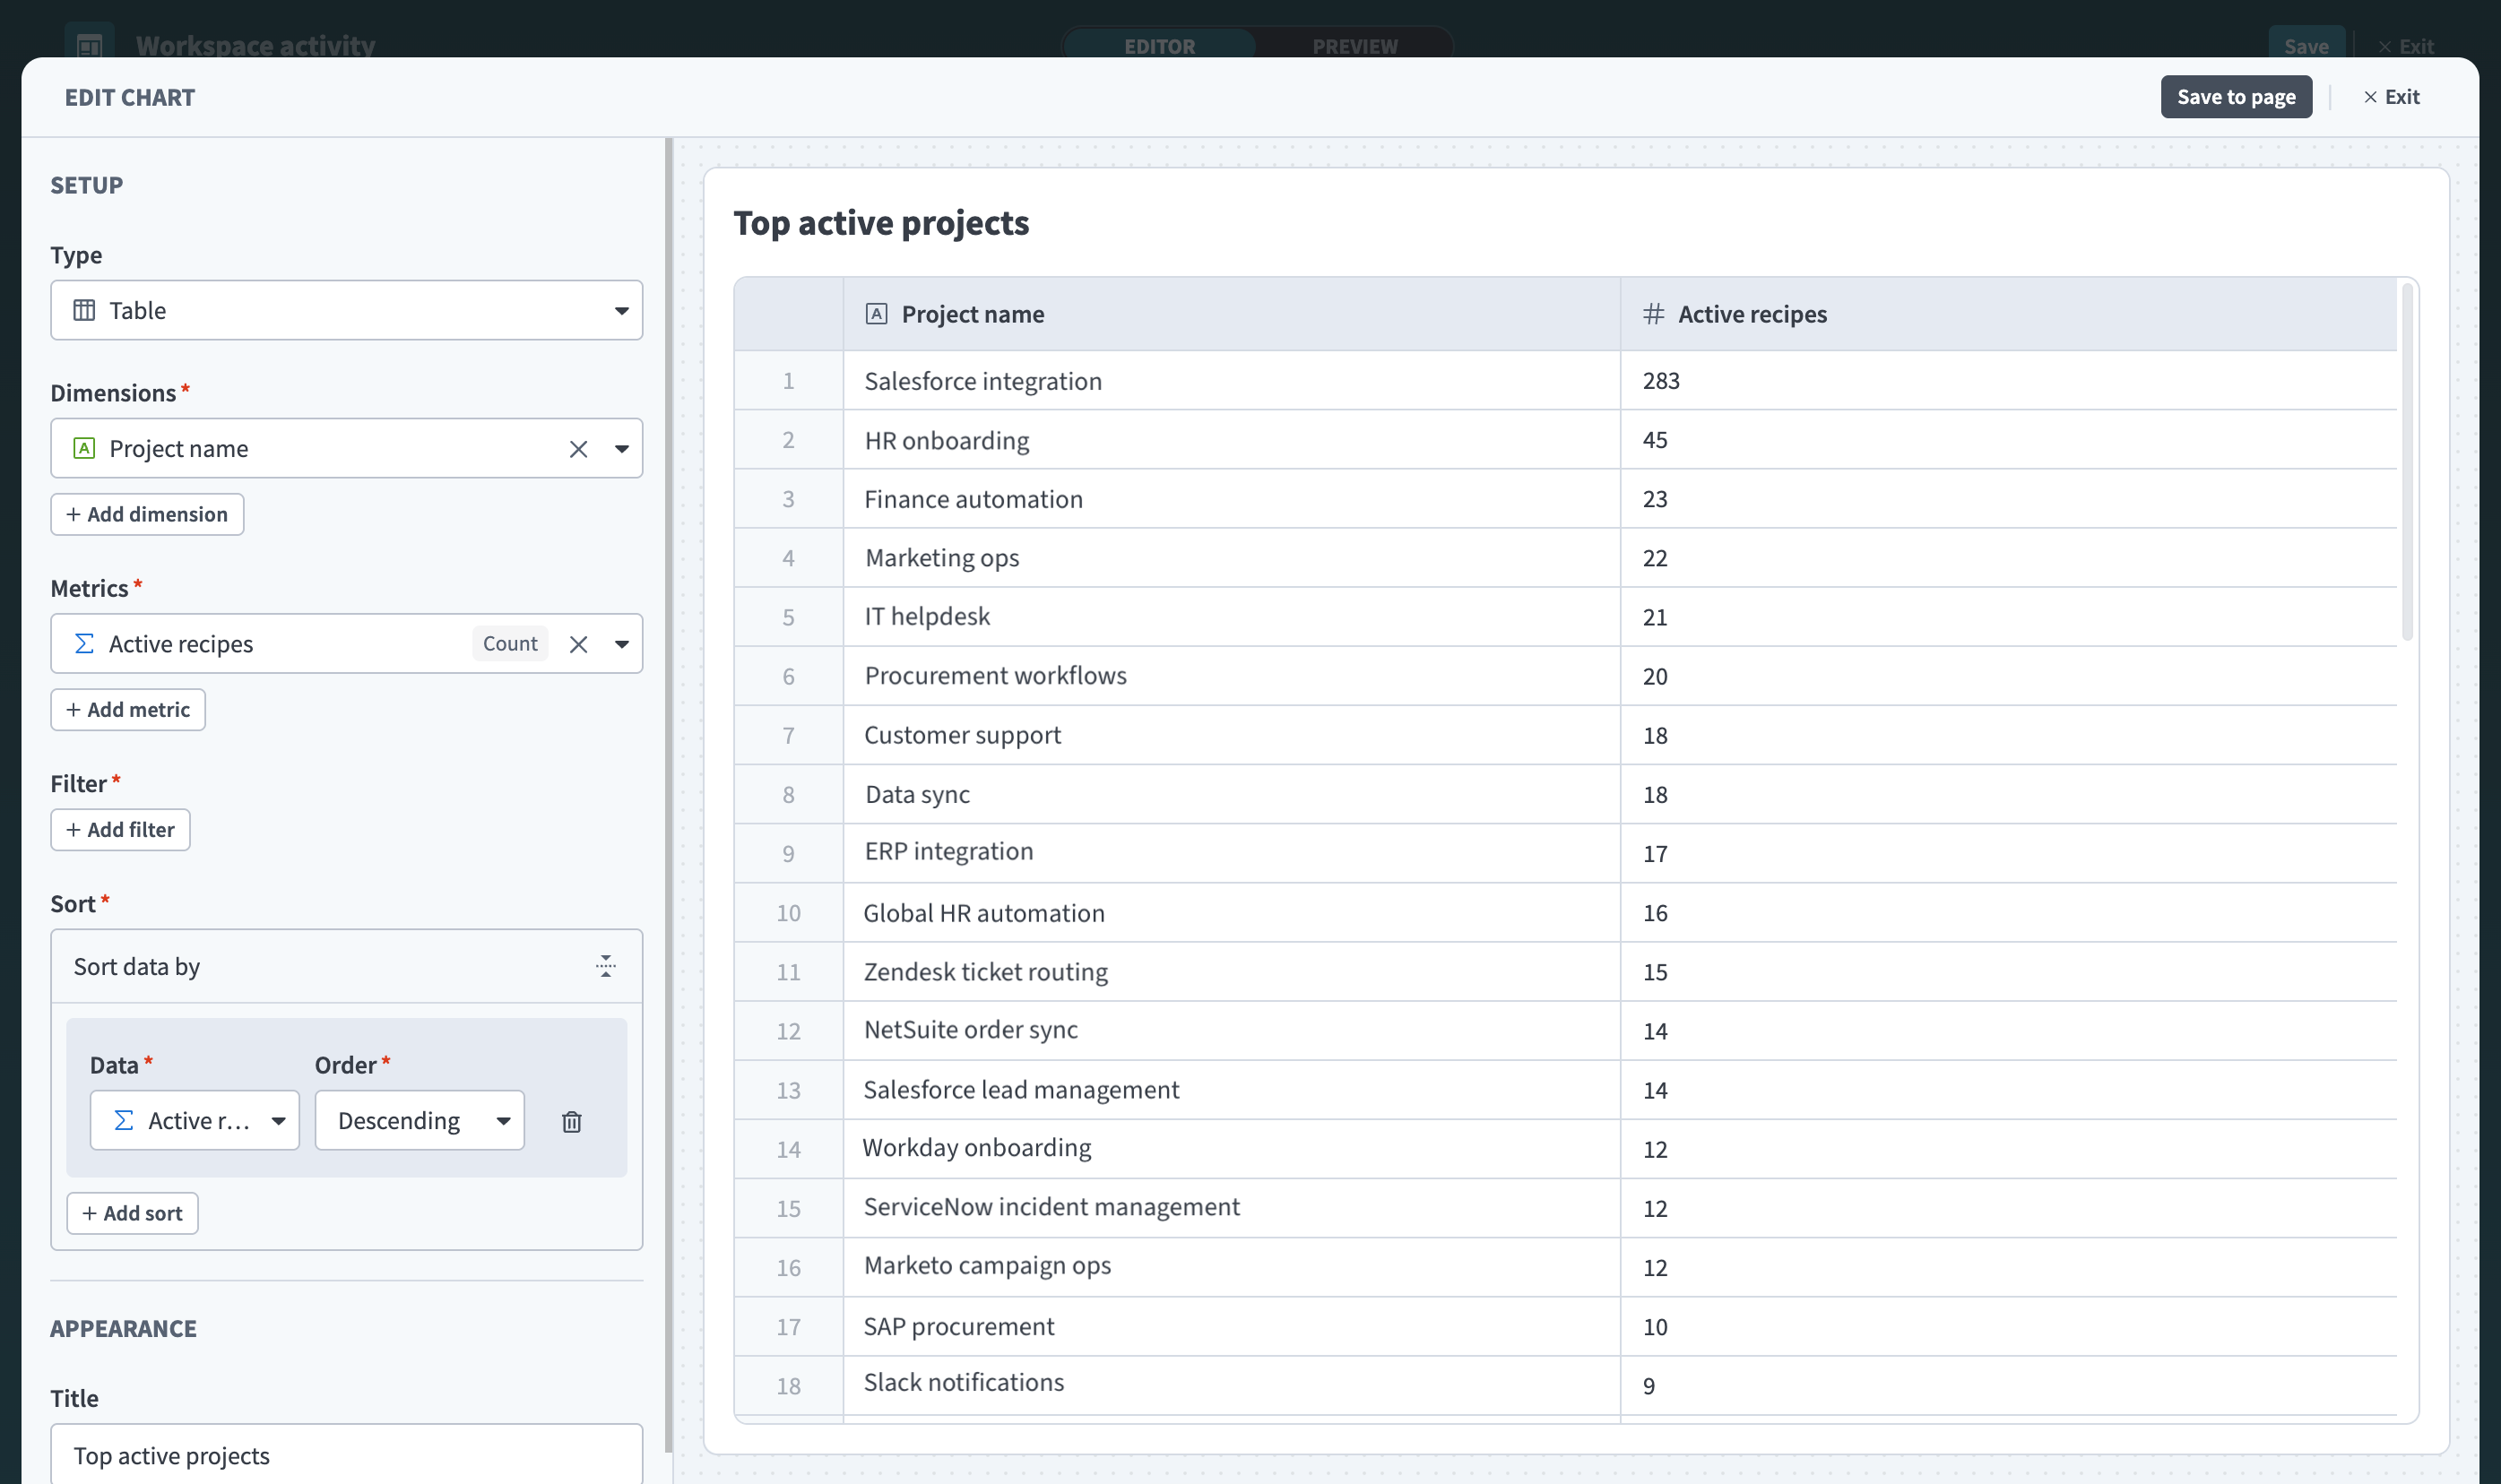 Top active projects table configured with dimensions, metrics, and sort order
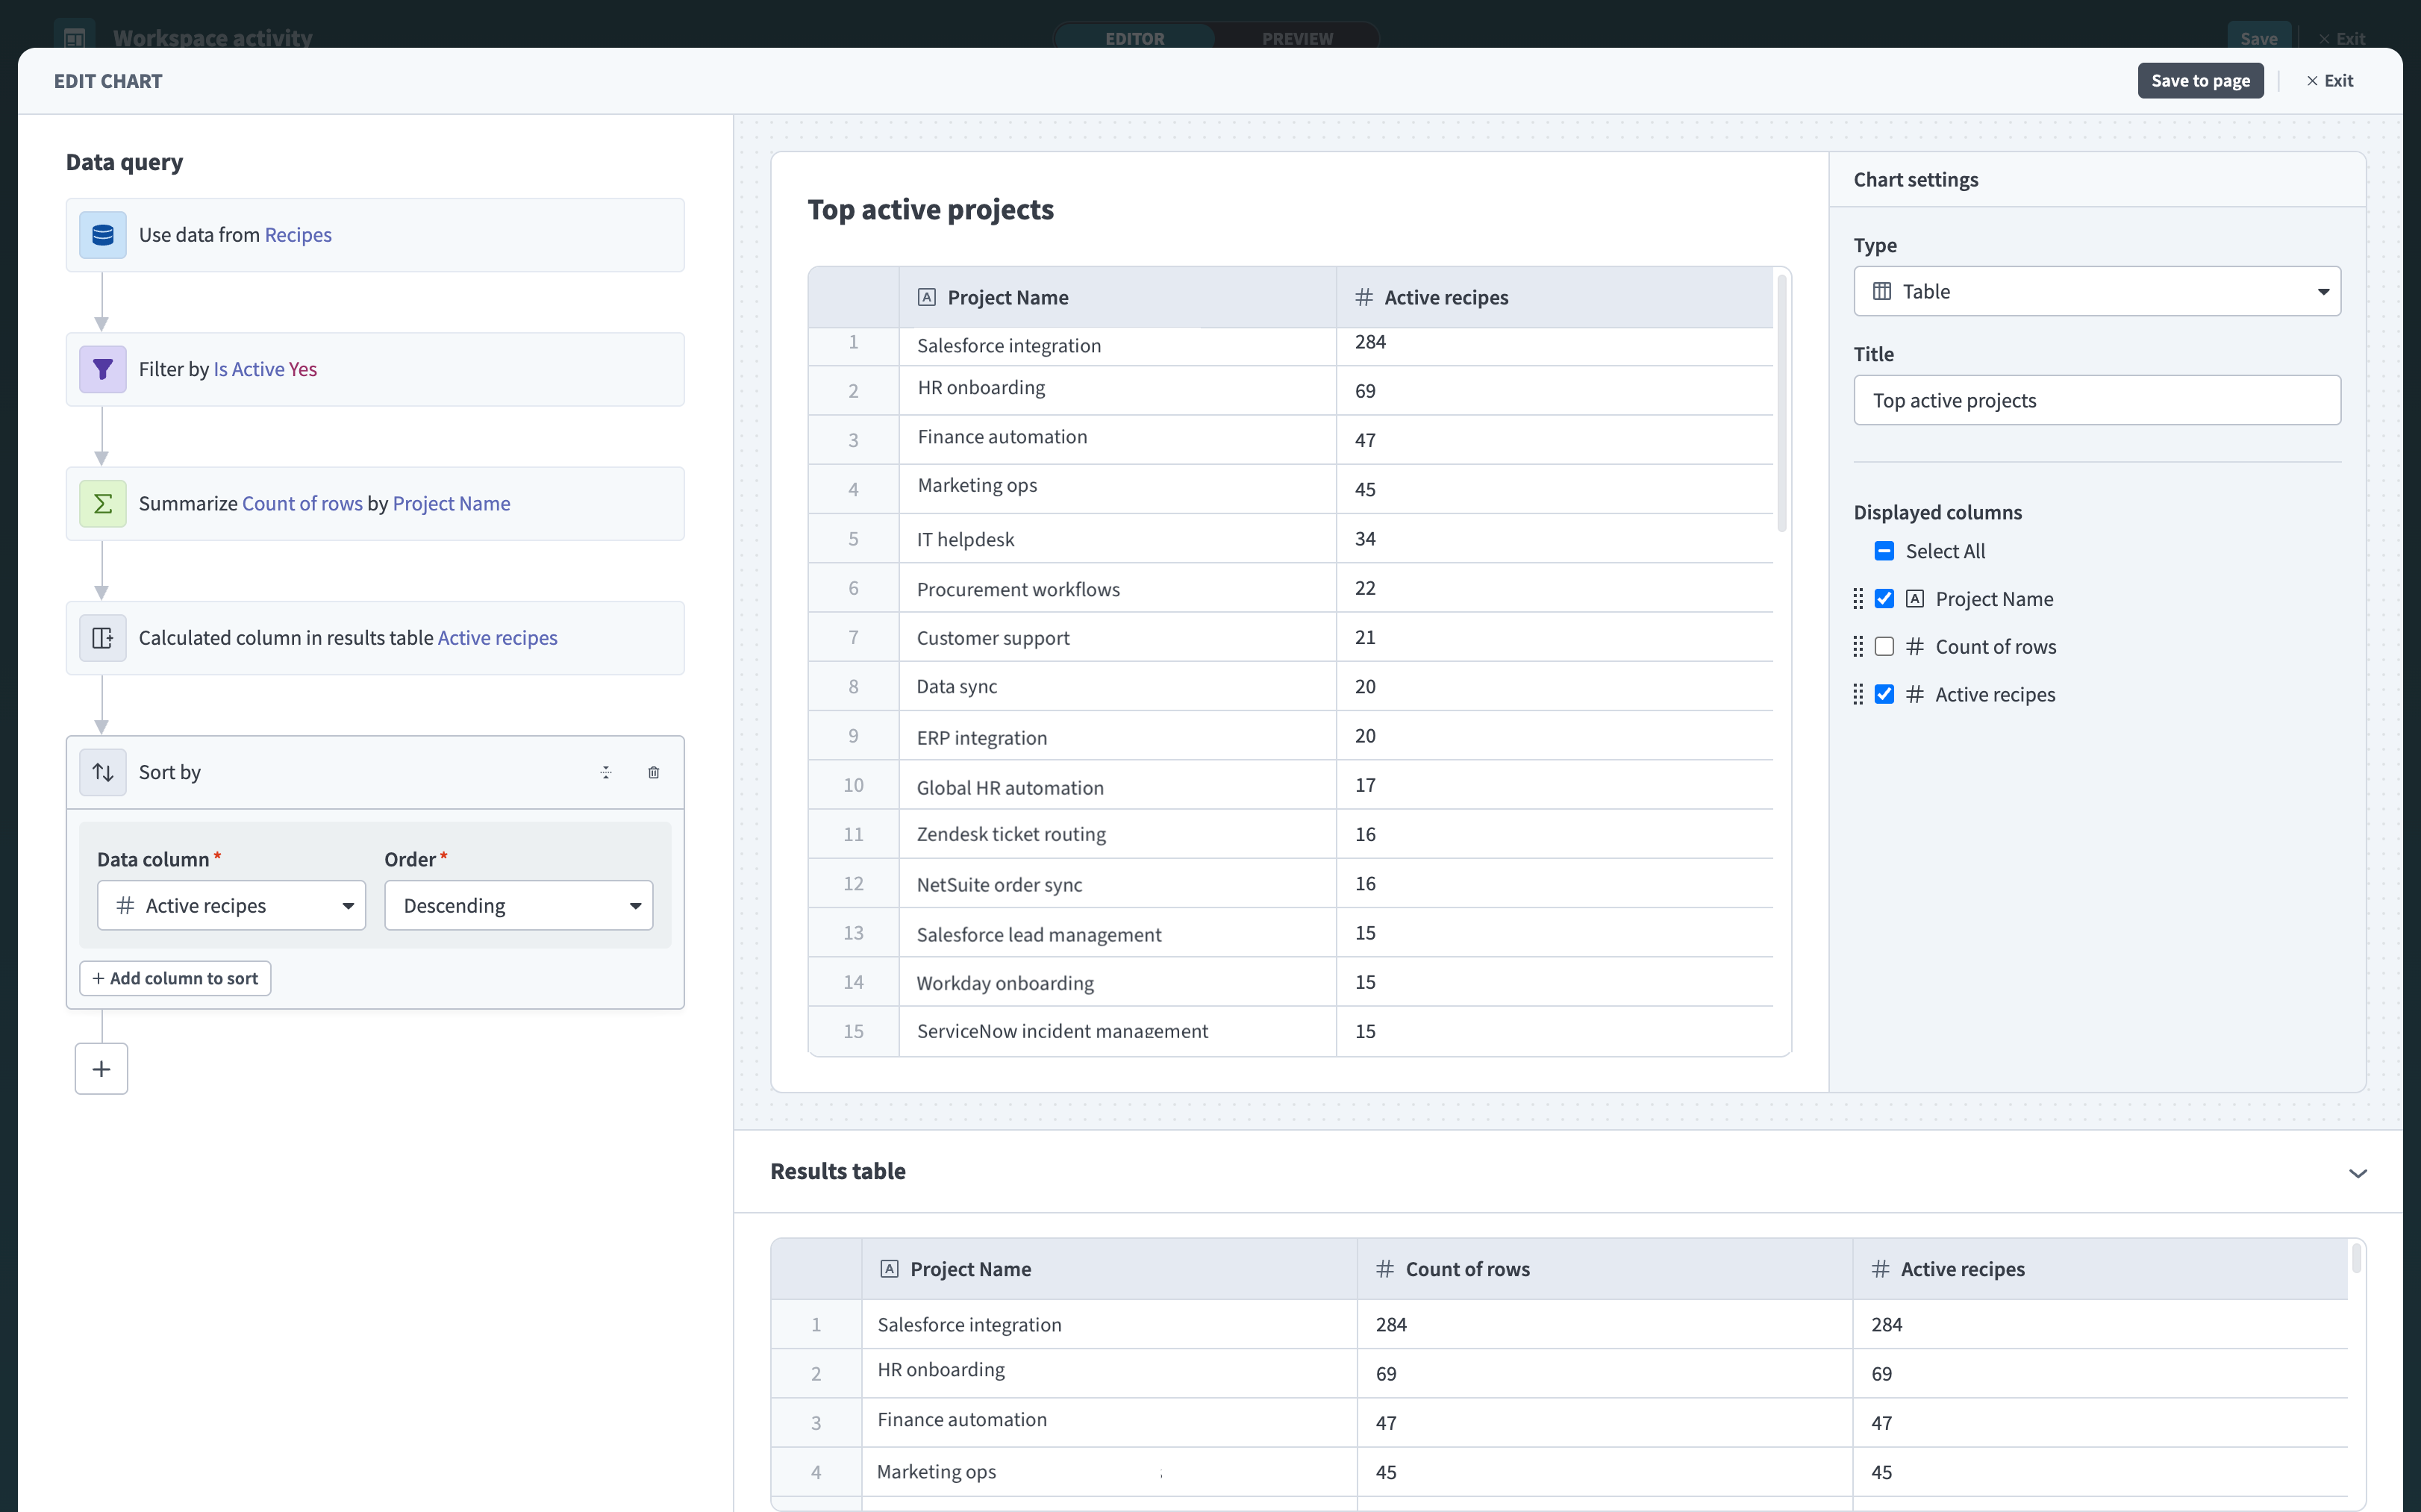 Top active projects table configured with dimensions, metrics, and sort order
# Save your dashboard
Complete the following steps to save and view your dashboard:
Click Save in the dashboard editor.
Click Preview to see how your dashboard looks to viewers.
Example: Active recipes dashboard
Your dashboard shows:
- Three key metrics about workspace activity
- A table of your most active projects
Click Exit to return to the Insights homepage.
Your dashboard updates automatically as new jobs run in your workspace.
Last updated: 4/9/2026, 3:32:43 PM