# How it works
Insights is designed to provide you an overview of your automations' functionality out of the box and provides two templates pre-configured with queries to give you insights into your workspace and projects:
Additionally, you can start with a blank template to build your dashboard from scratch. Refer to the usage inspiration section of our documentation for examples of the custom dashboards you can build.
# Create an Insights dashboard
Access Insights from the side navigation bar in Platform > Insights. You can customize the charts that appear on your dashboards in three main steps:
To create an Insights dashboard:
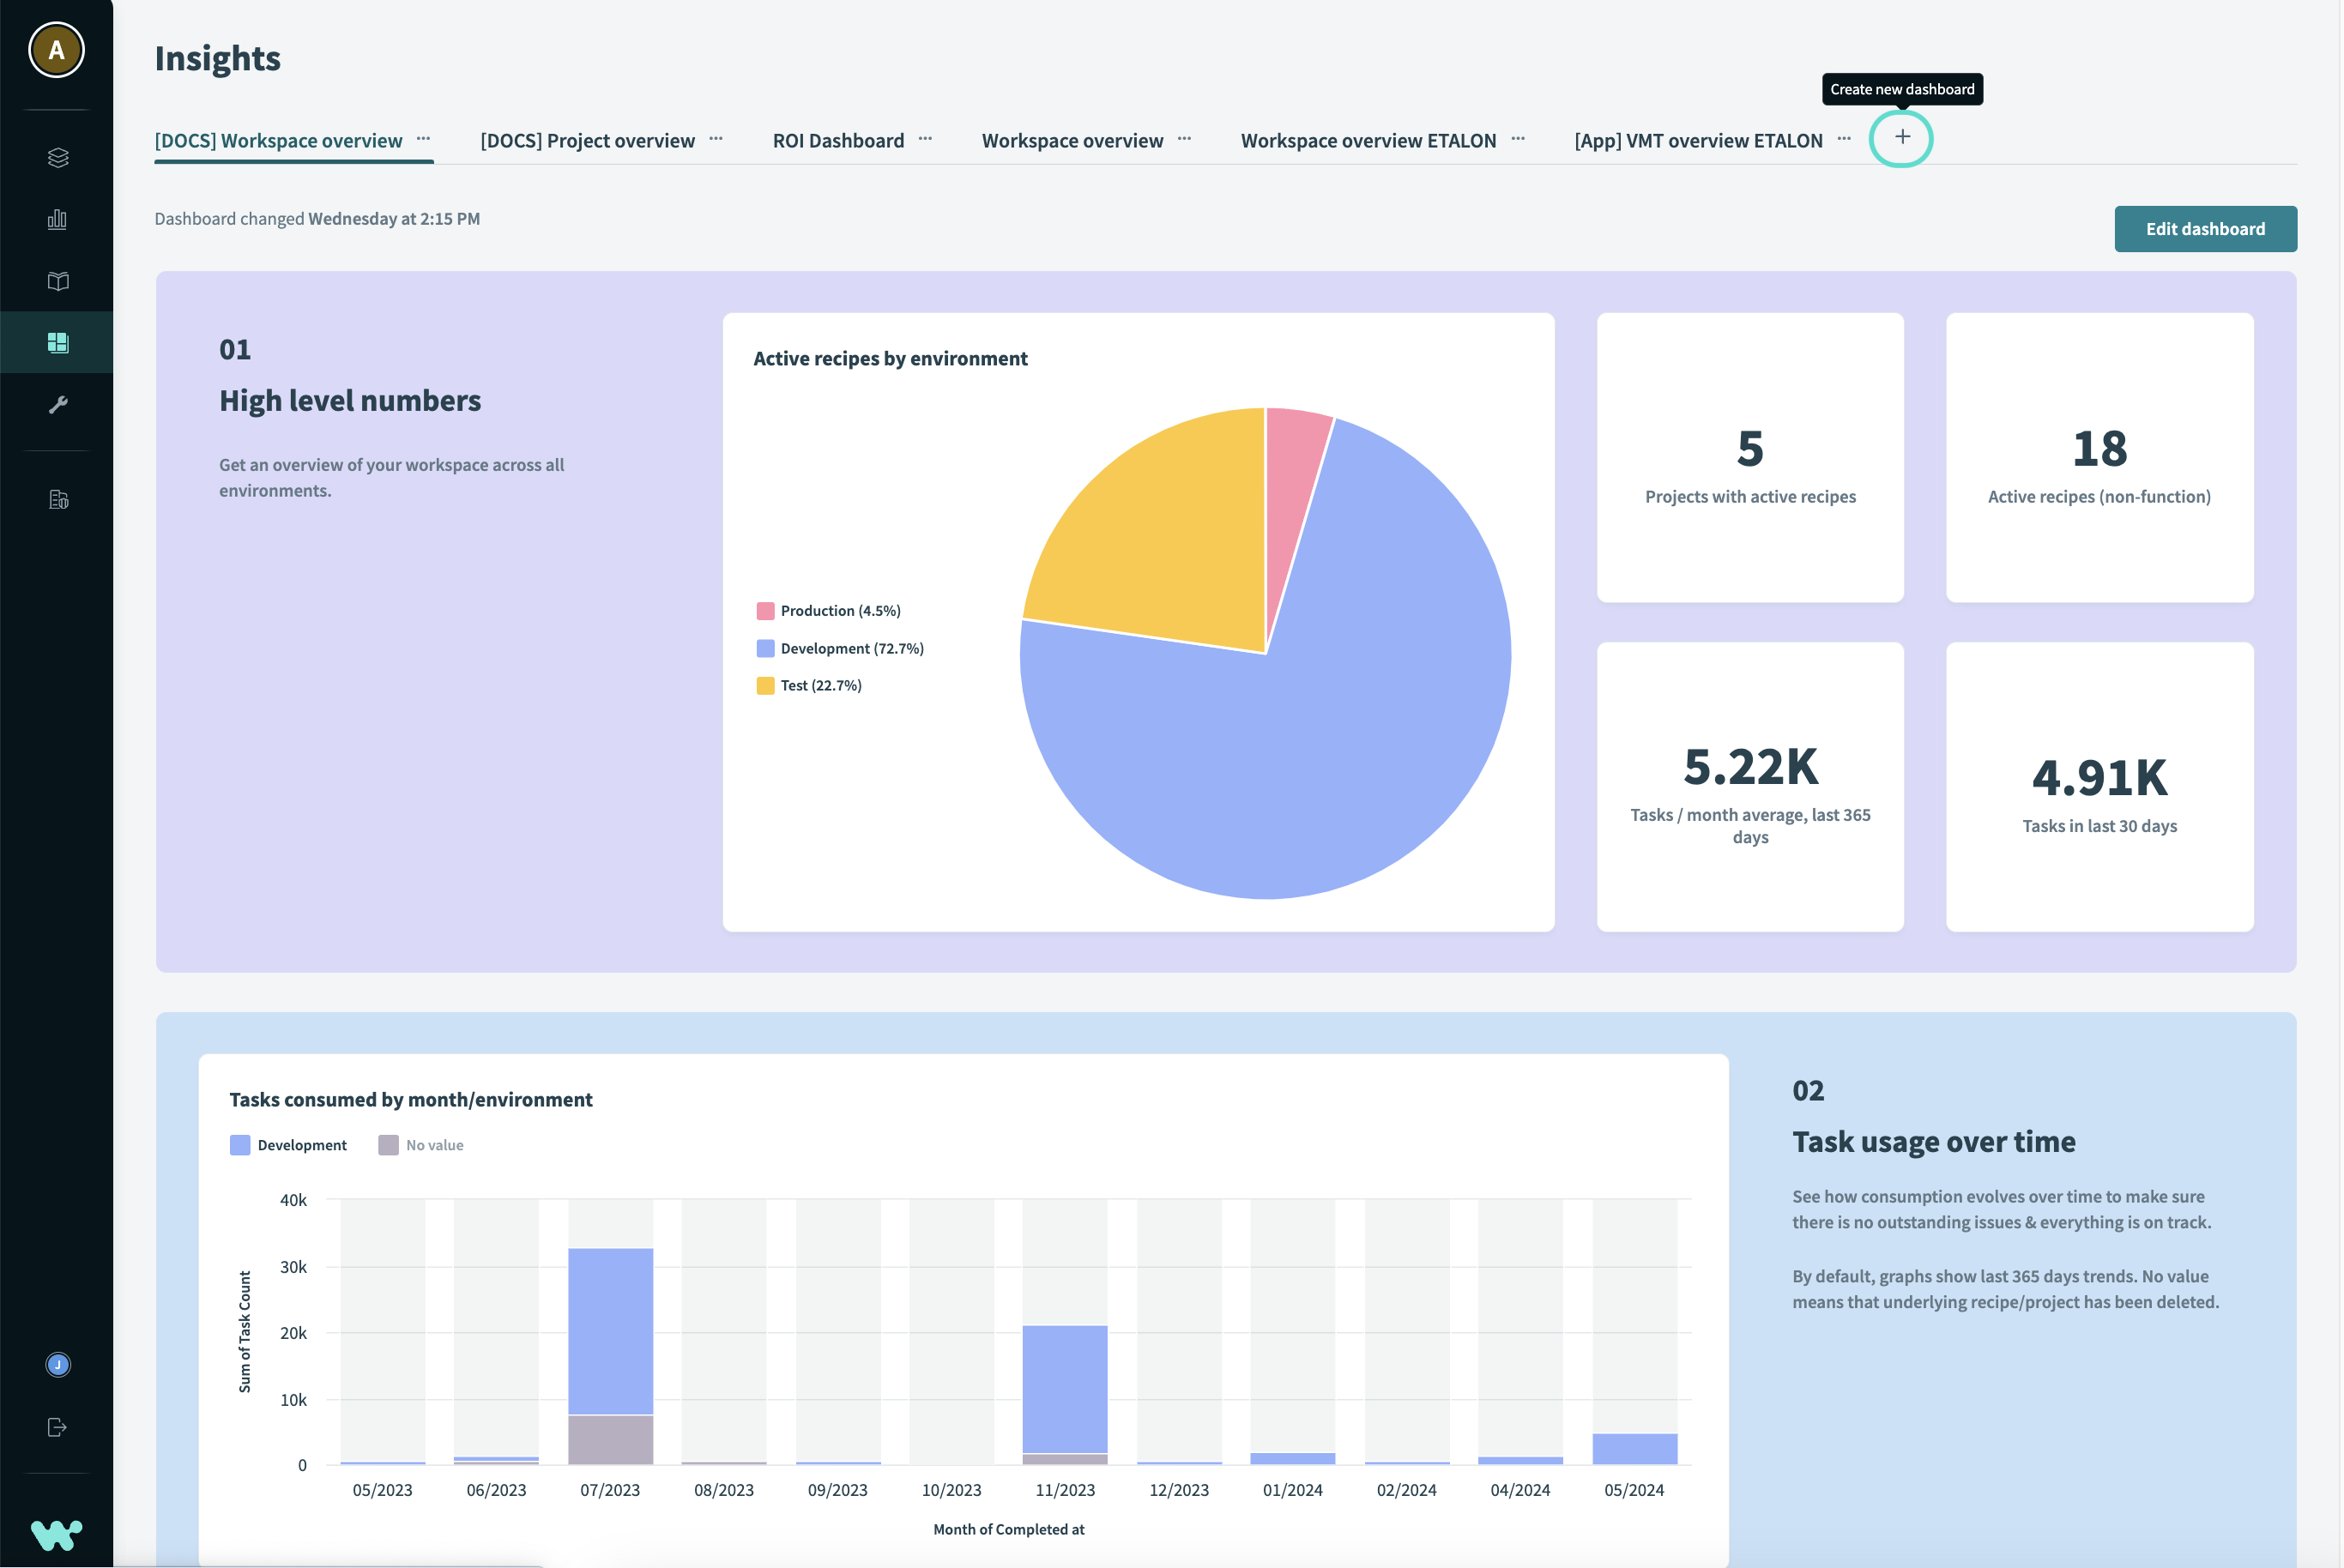
In Workato, use the side navigation bar to go to Platform > Insights.
Click + (plus) to create a new dashboard.
 Create a new dashboard
Name your dashboard.
Choose a template to use as the basis of your dashboard. The following options are available:
- Workspace overview
- Project overview
- Blank
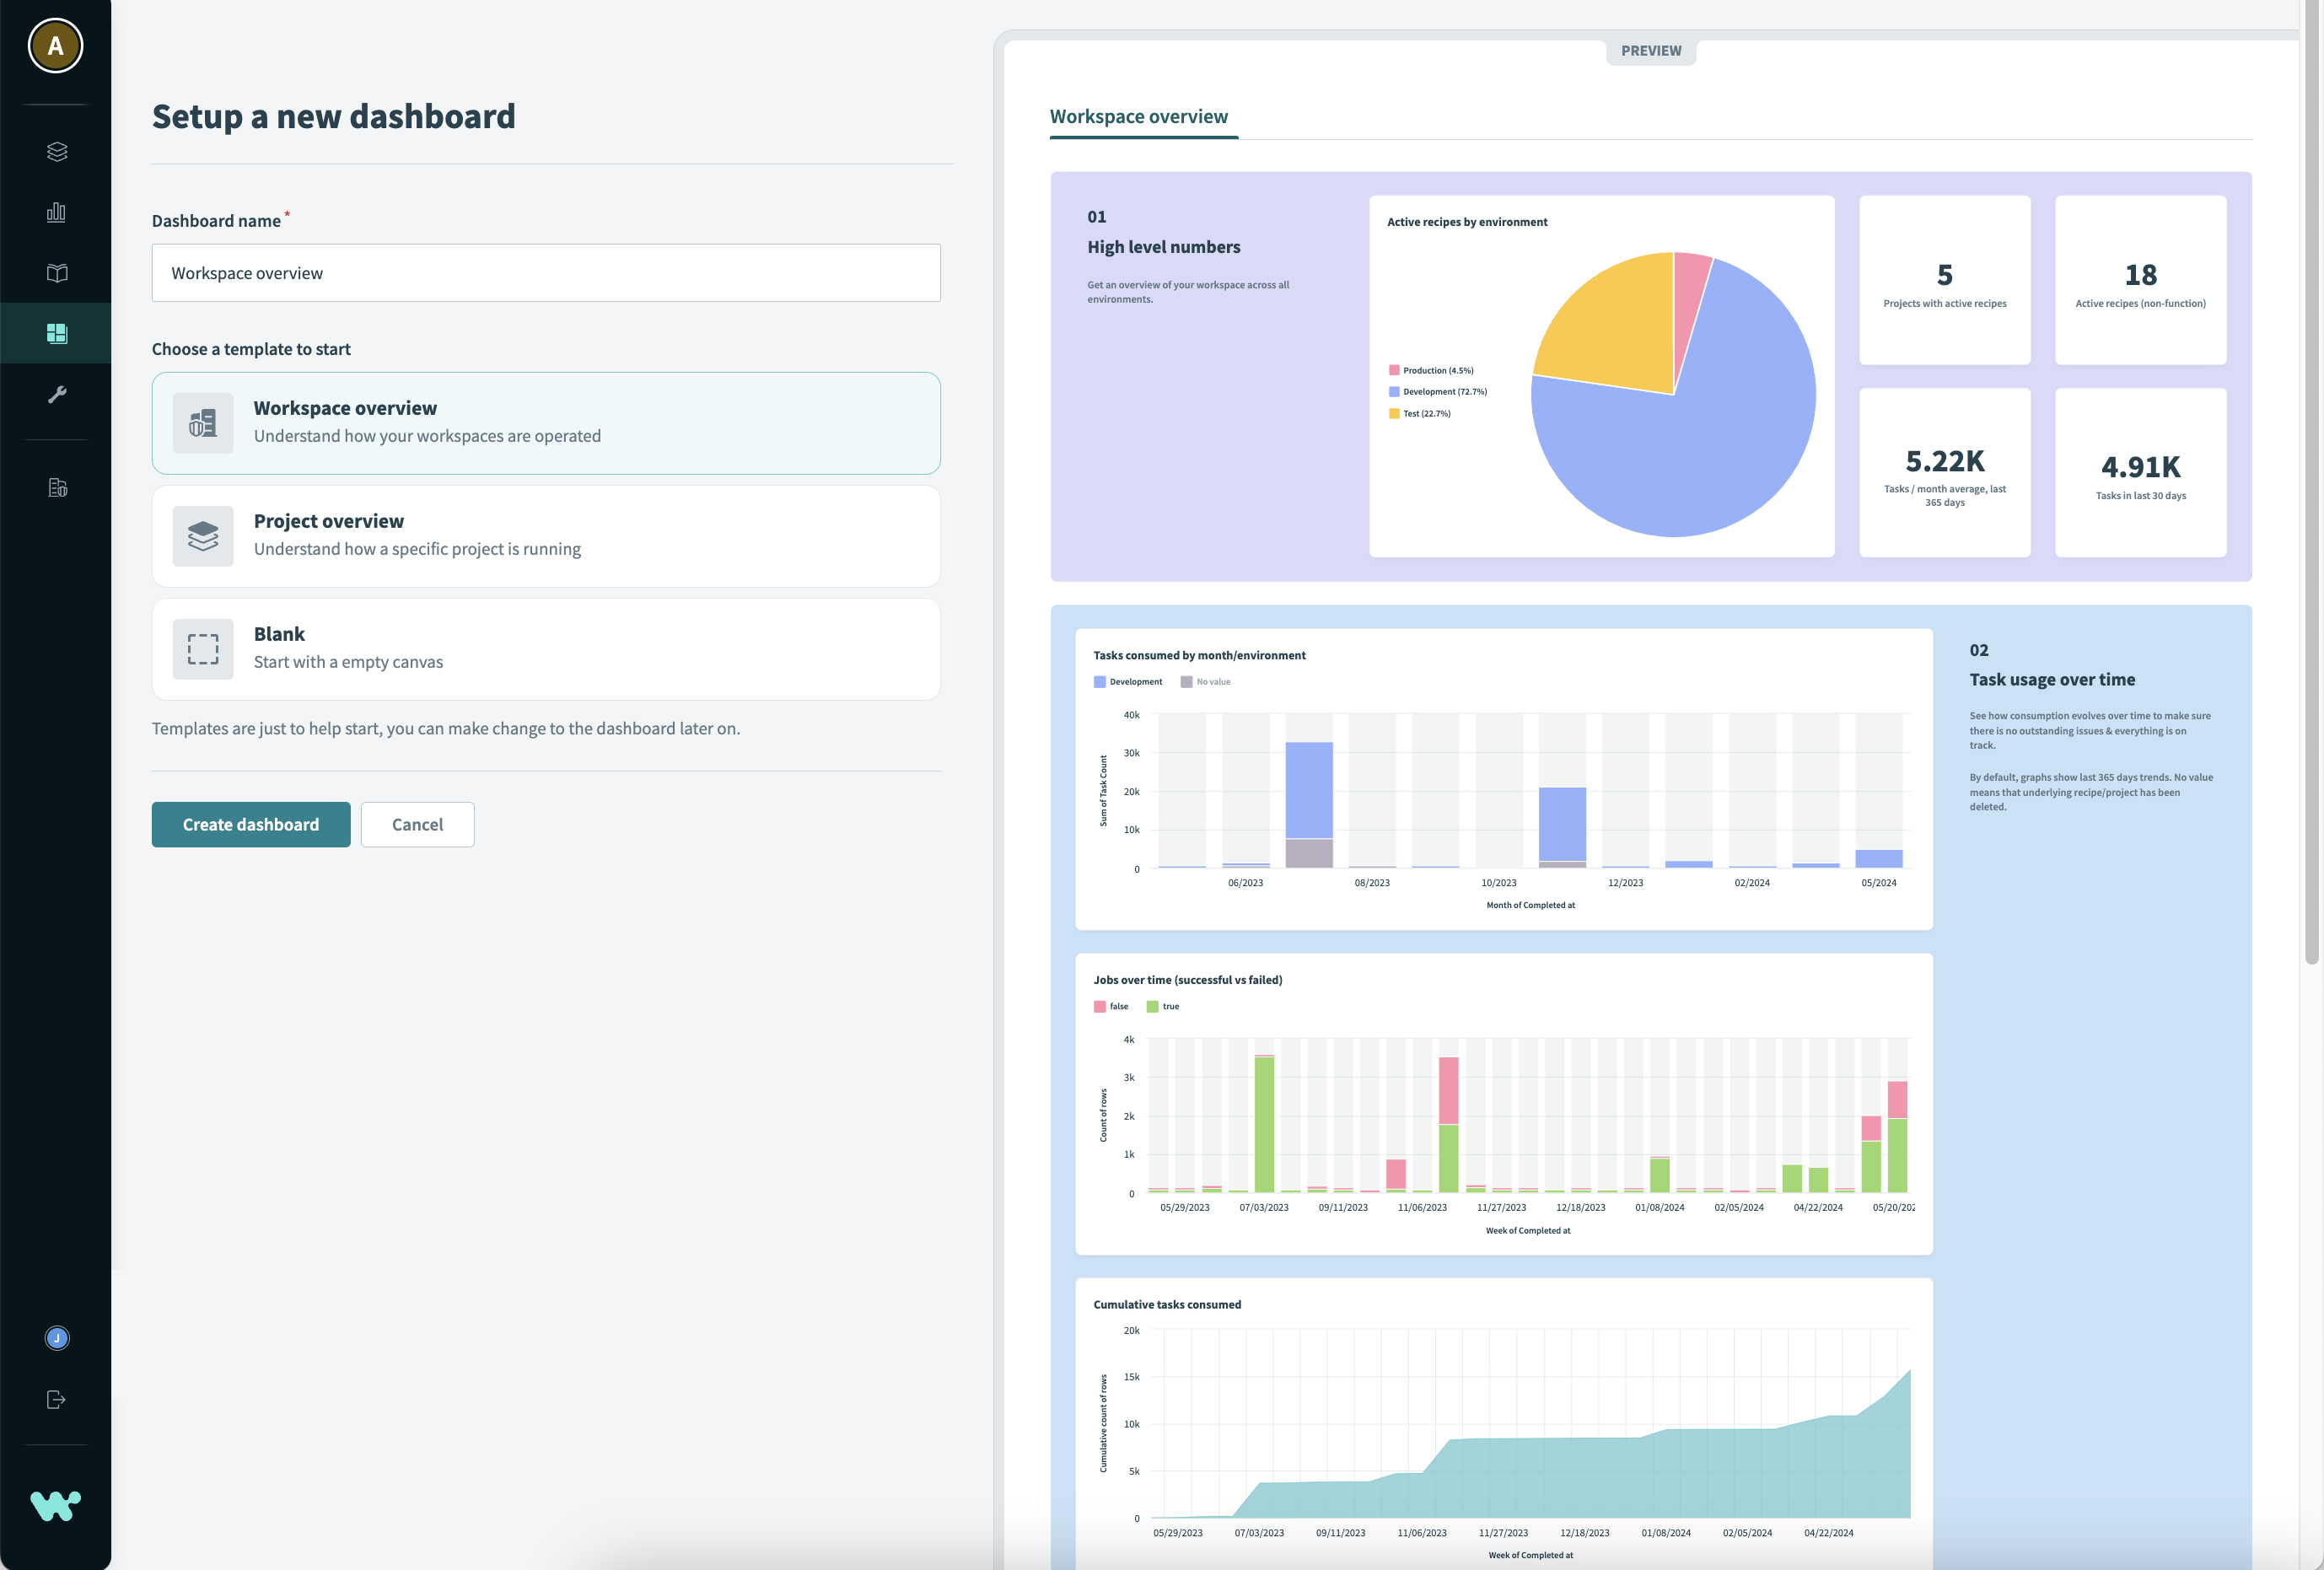 Workspace overview template
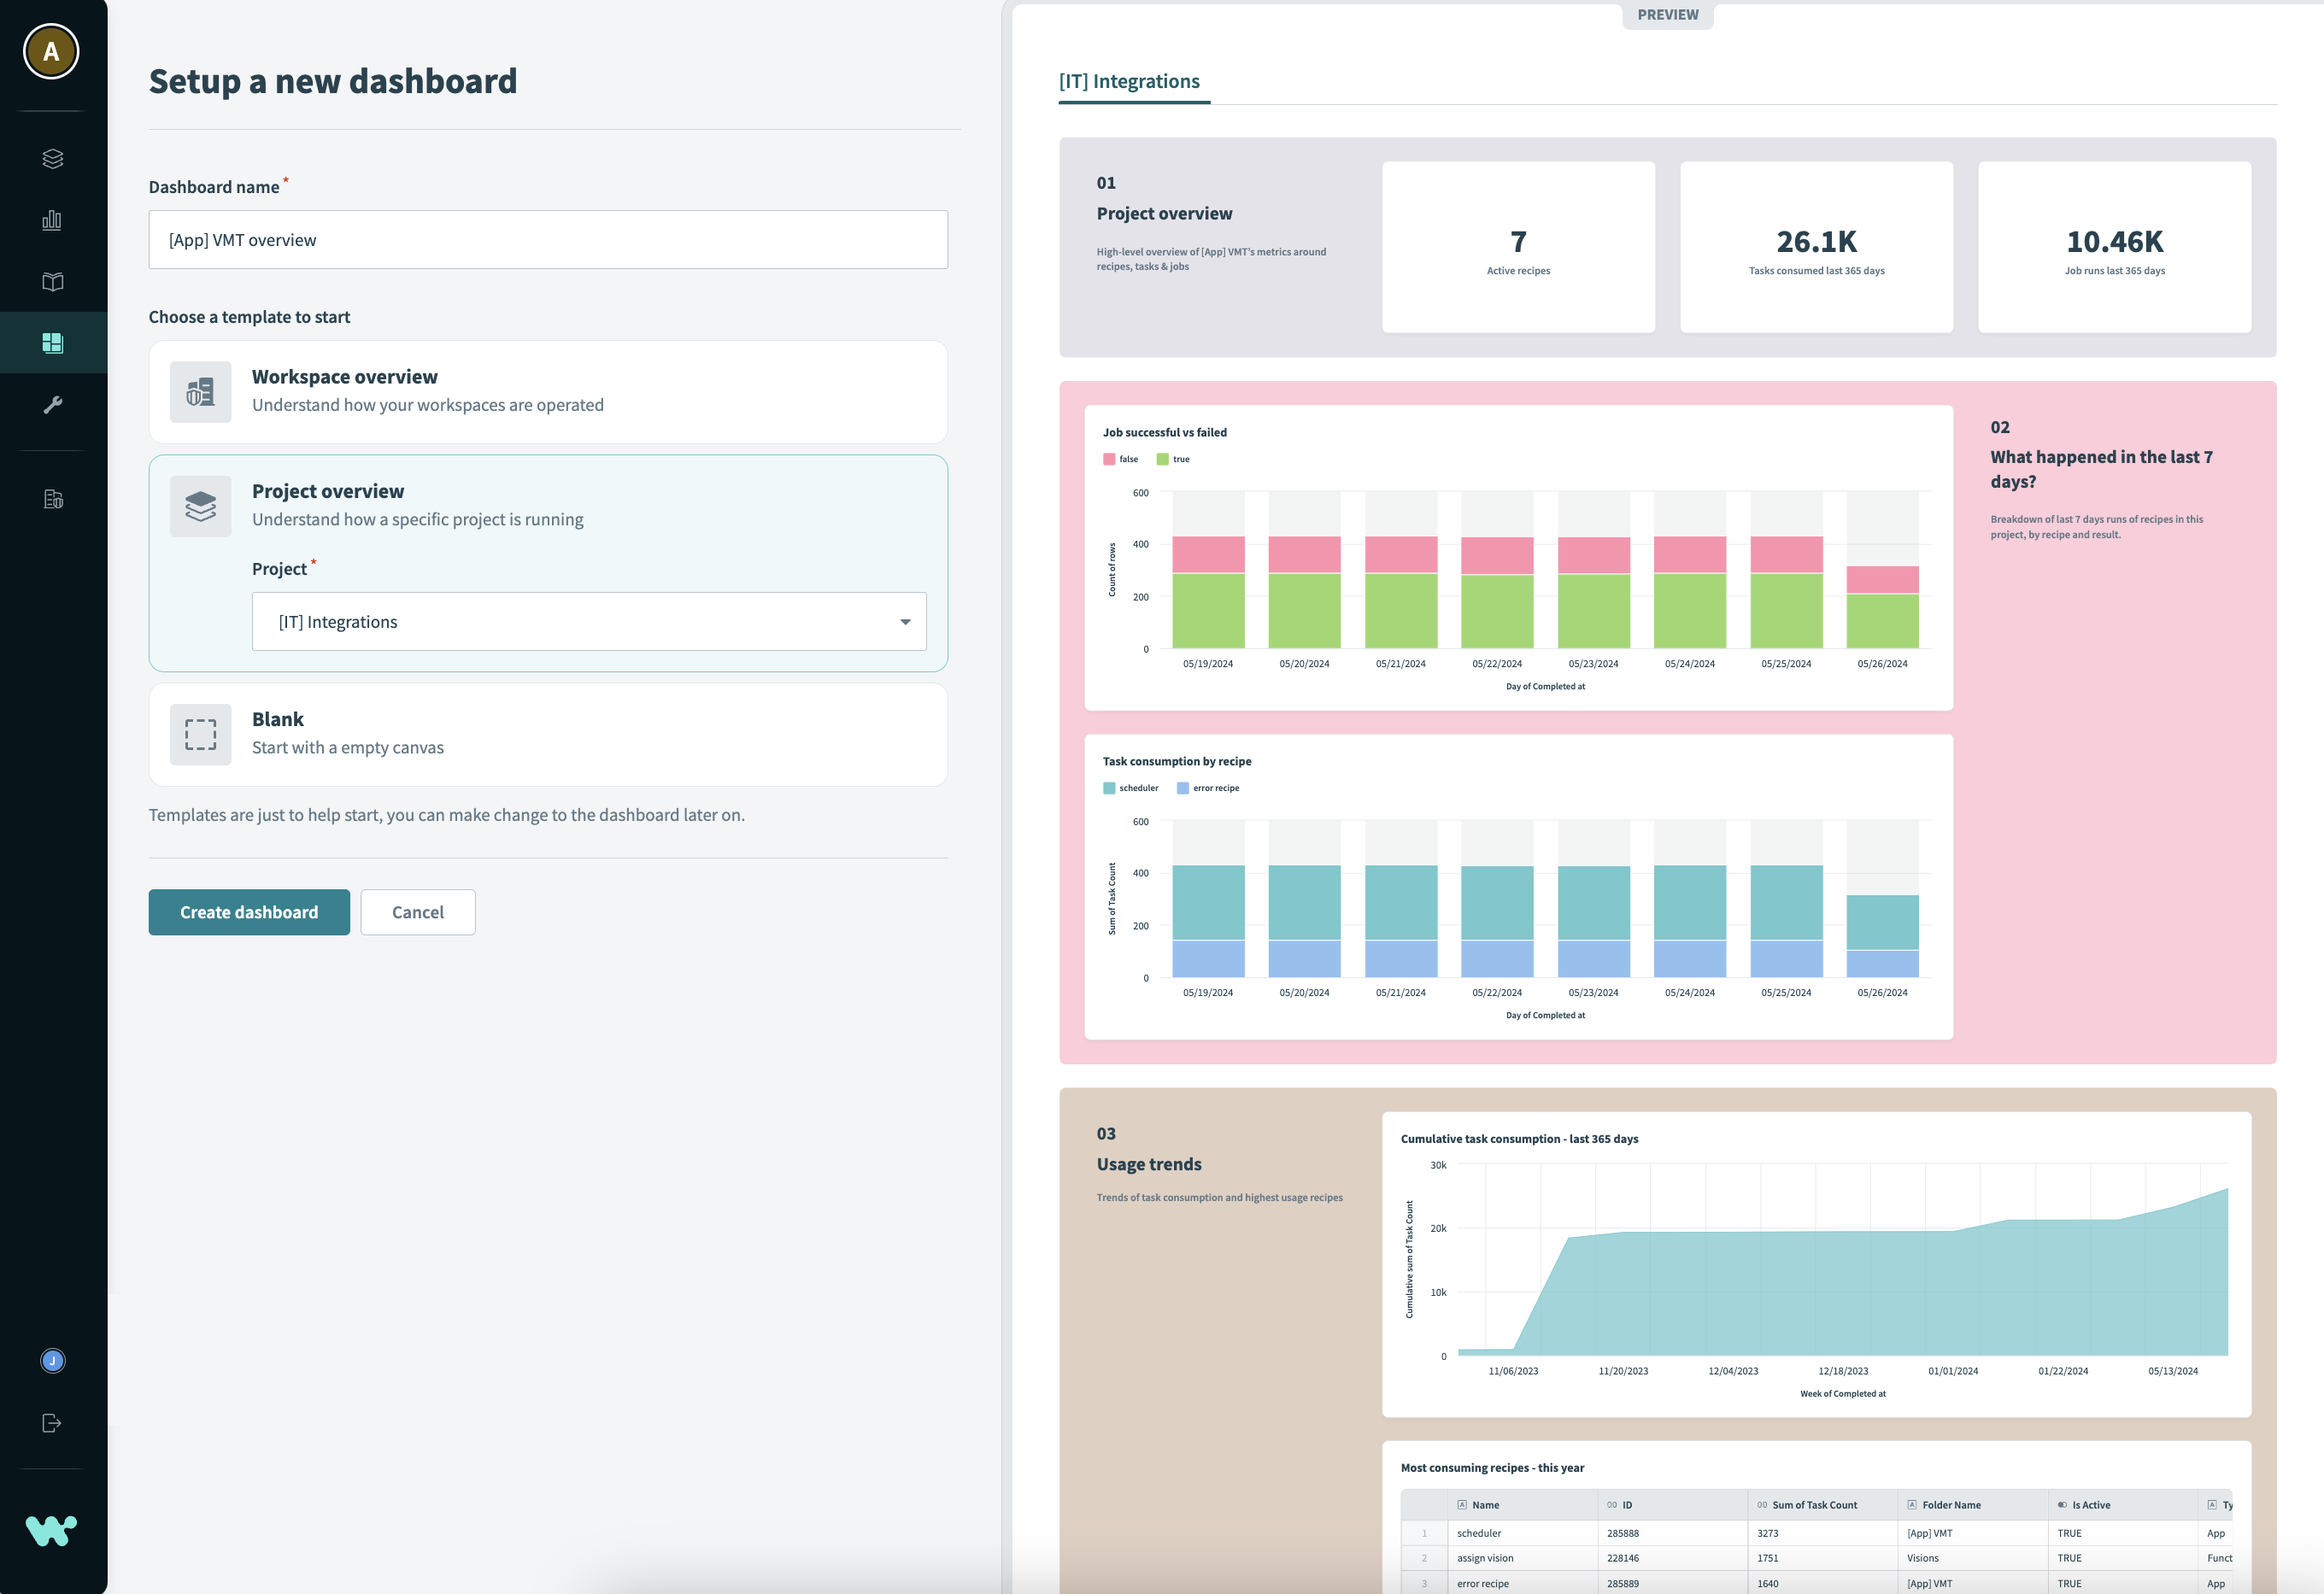 Project overview template
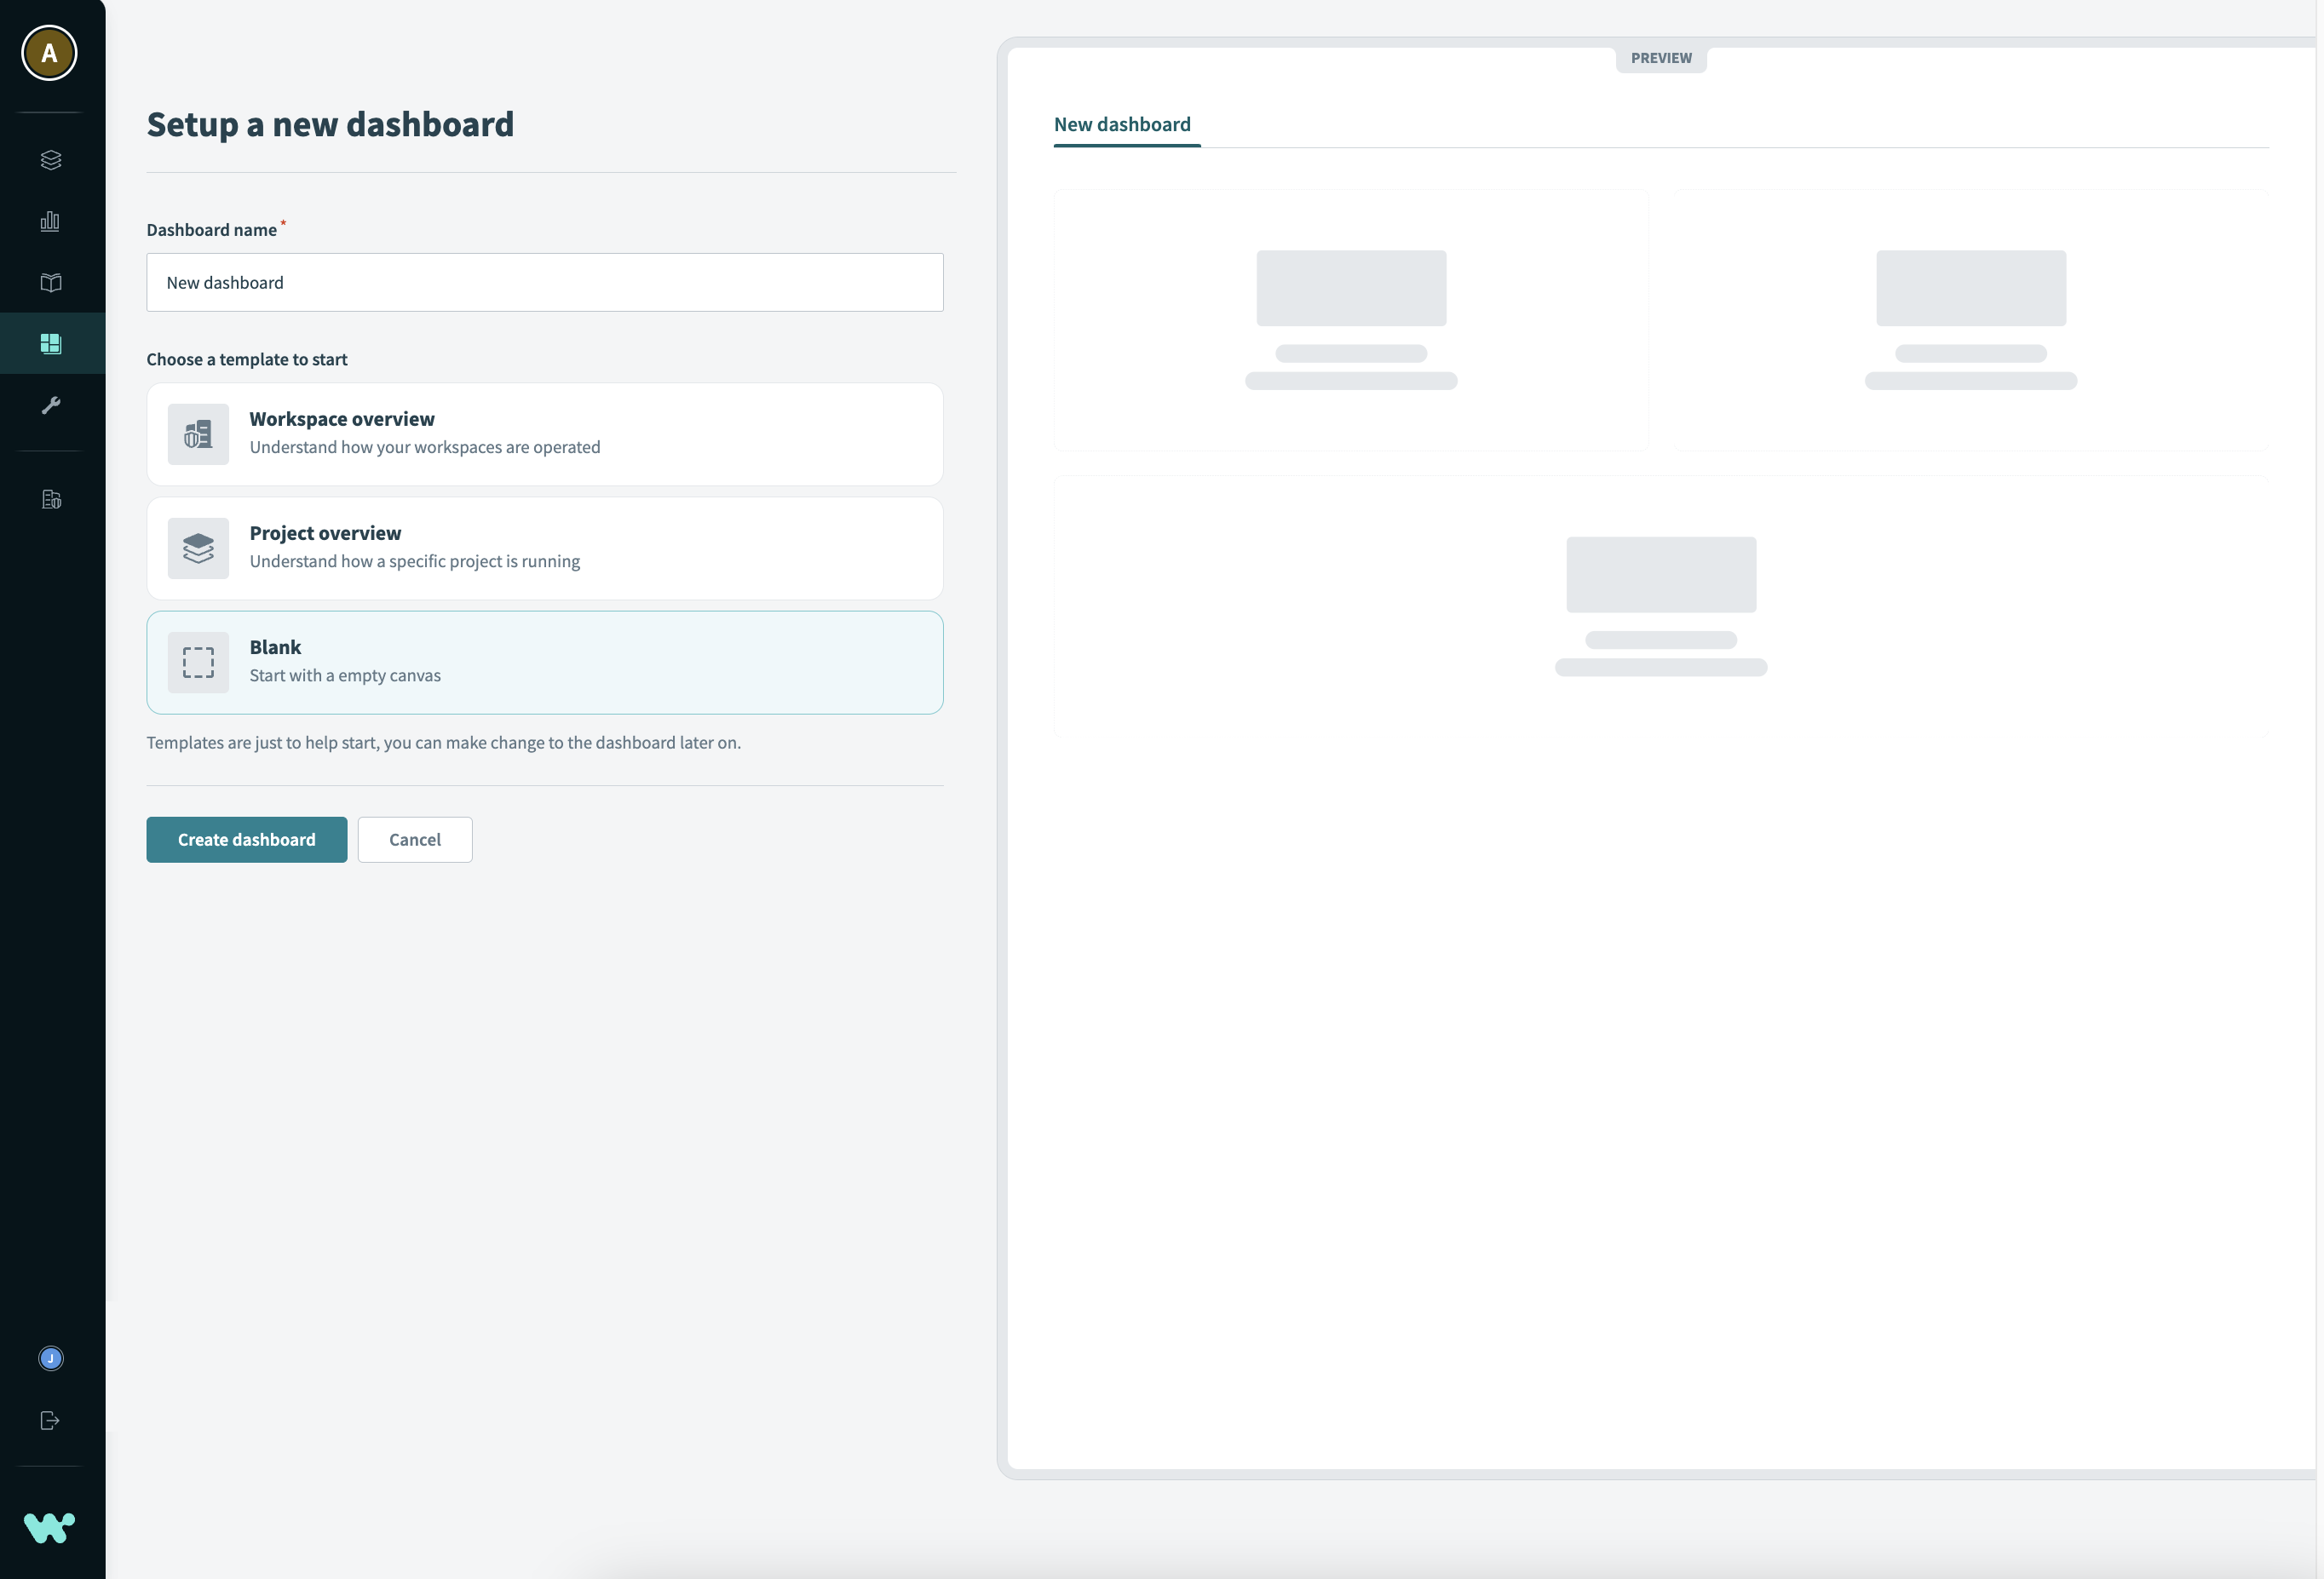 Blank template
Customize your dashboard by dragging and dropping components and edit chart data.
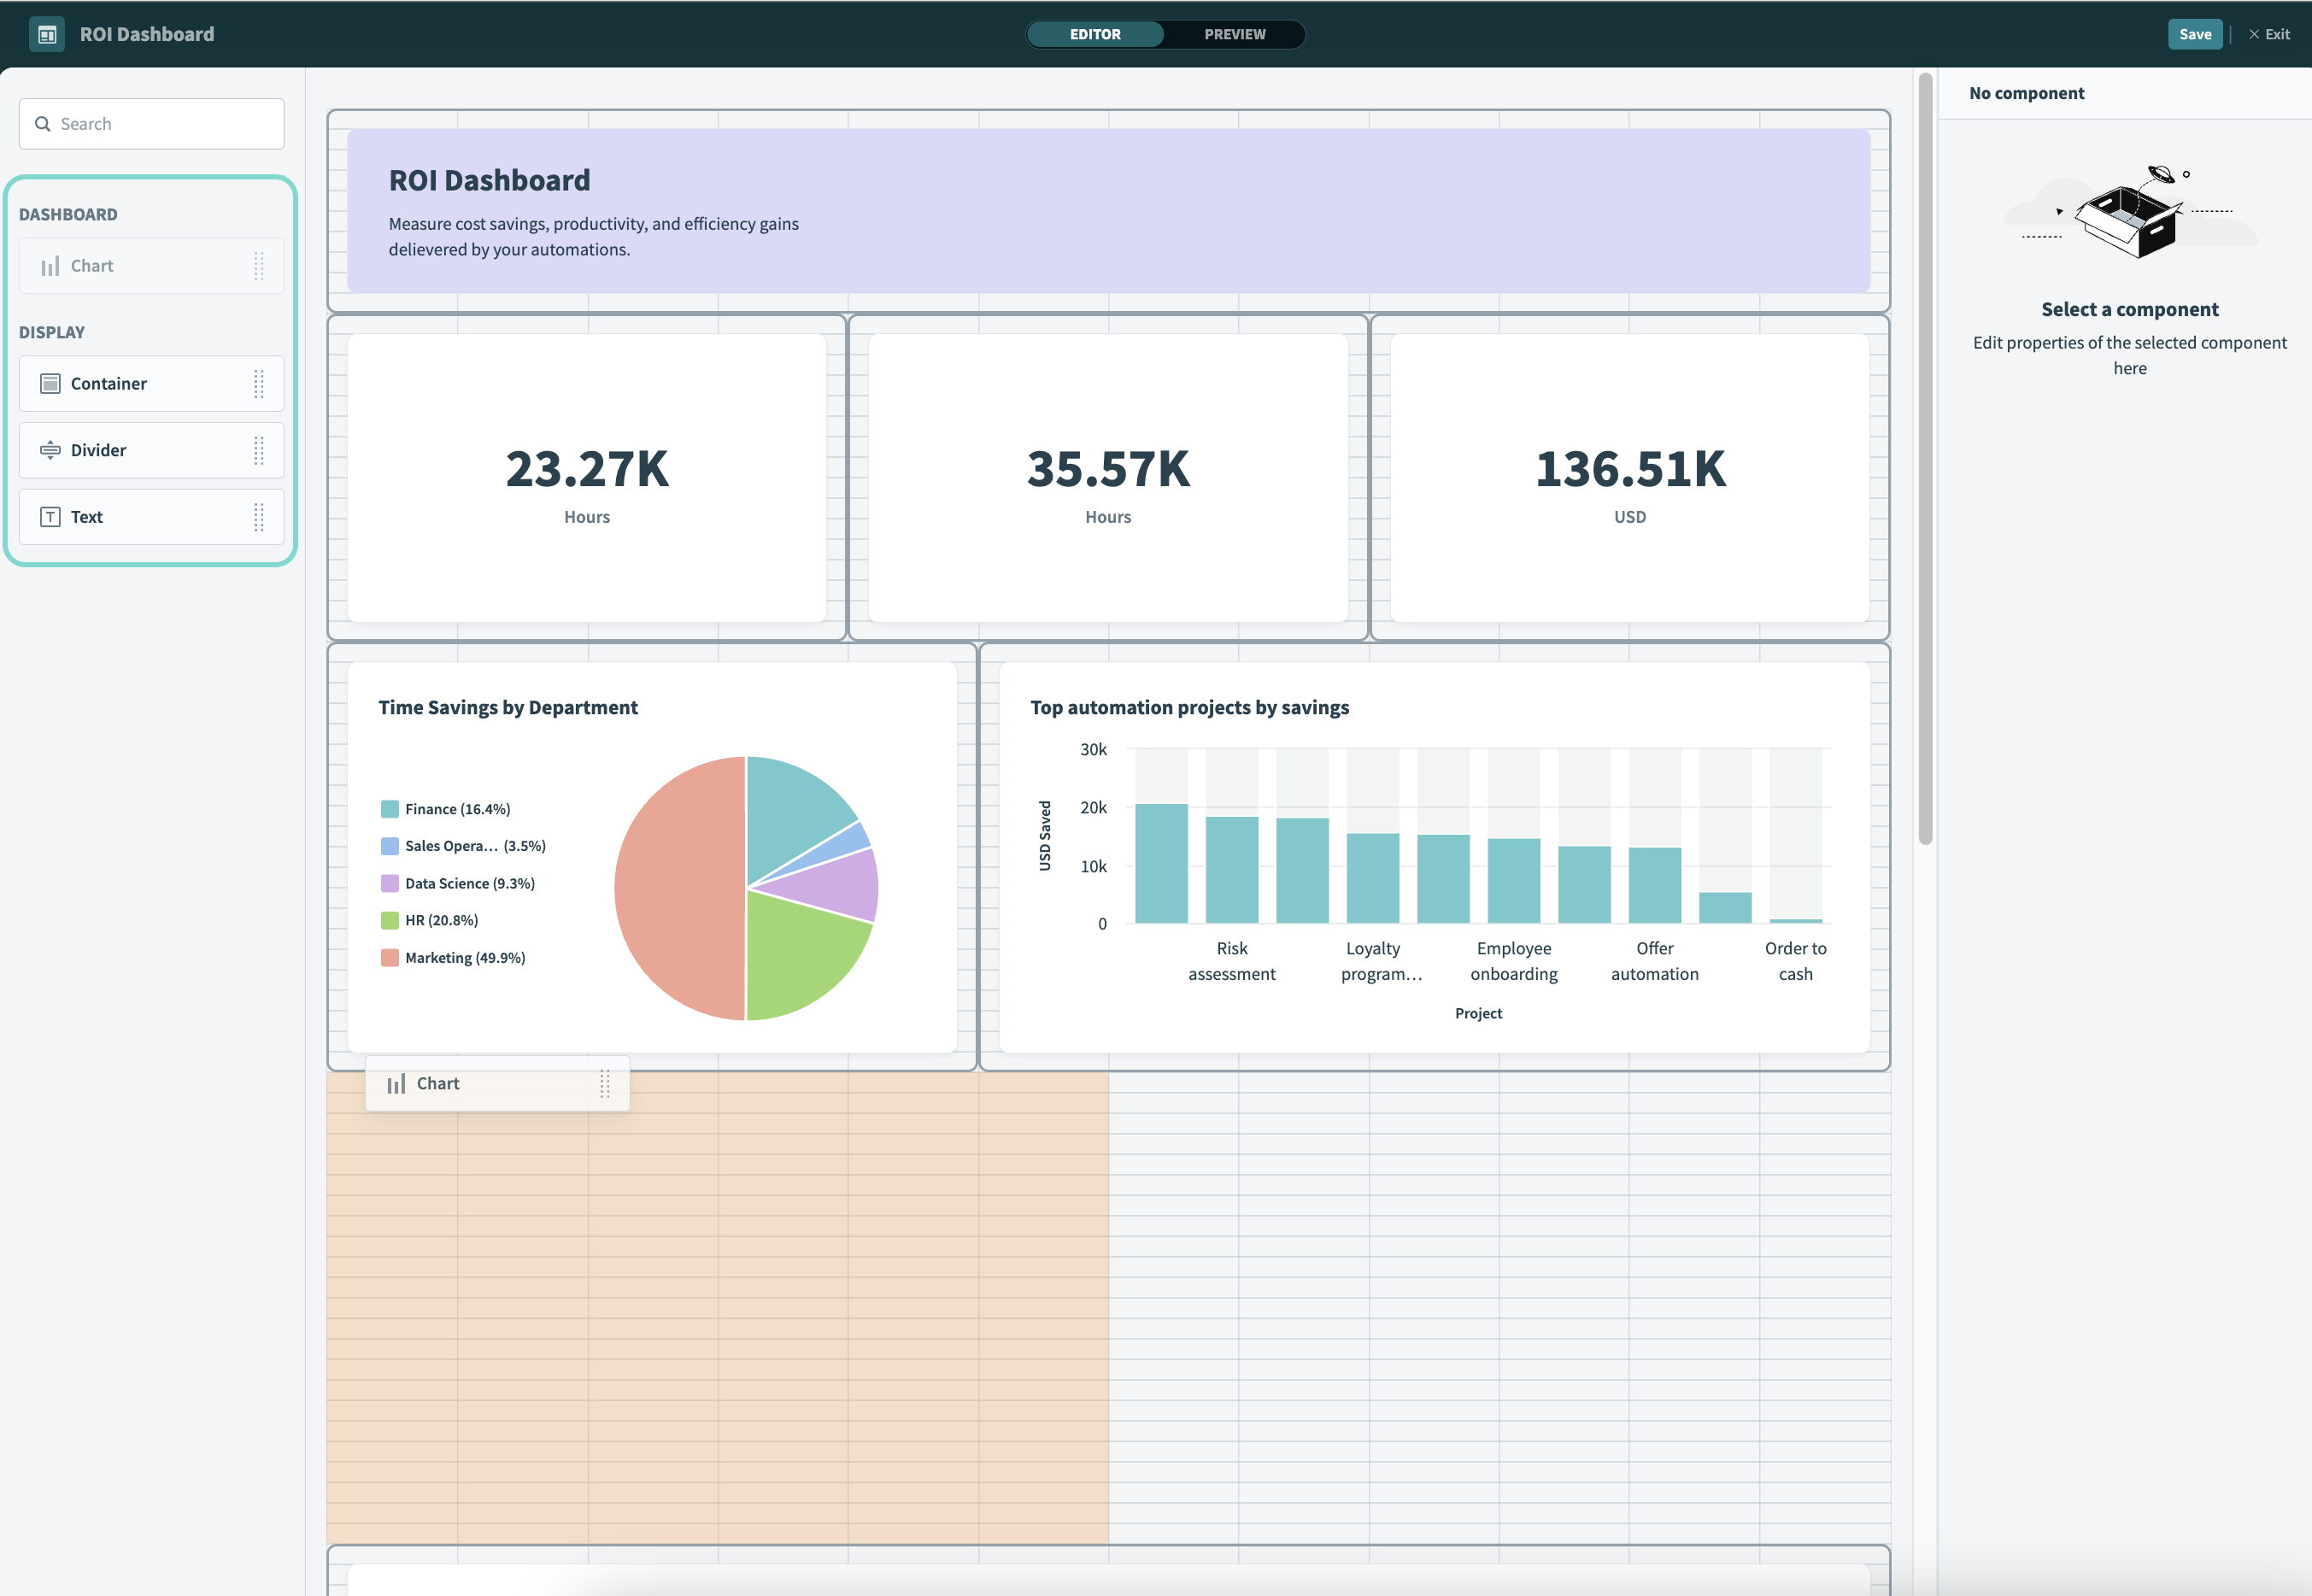 Add components to your dashboard
# Edit chart data
To edit charts and build custom queries:
Select a chart and click Edit chart data.
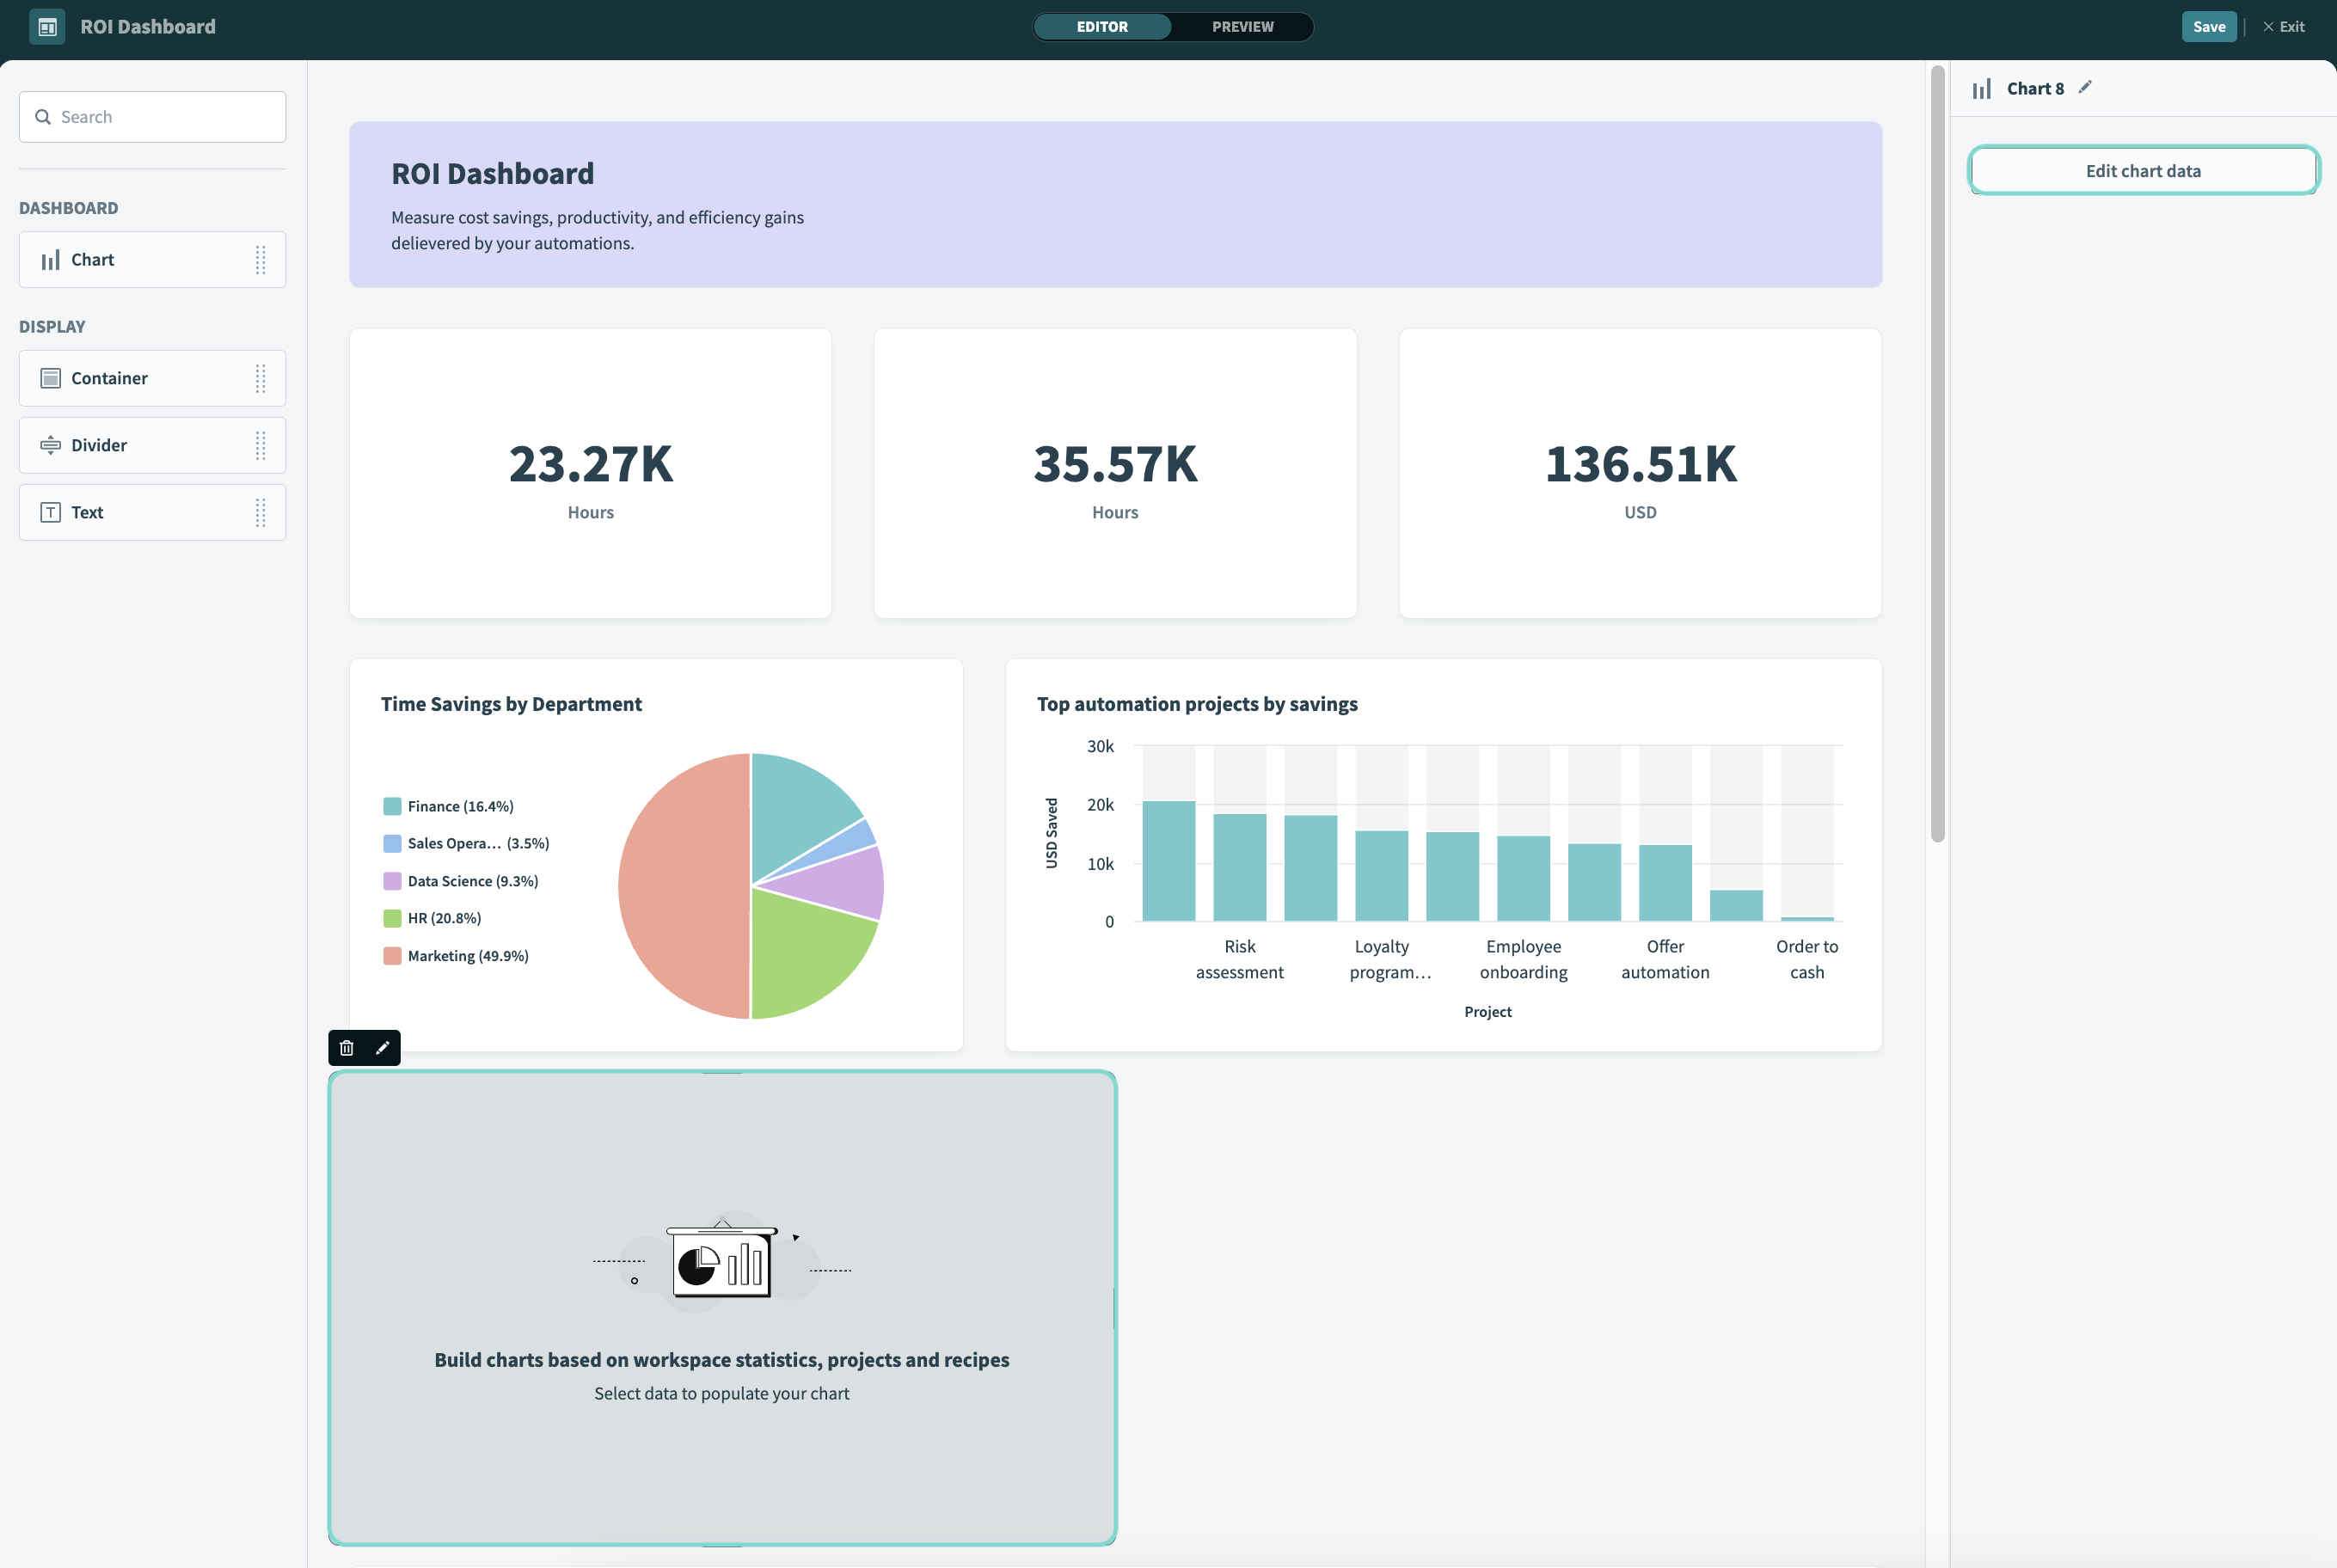 Edit chart data
Select your main data source: Connect data from Workflow apps, data tables, recipe job history, or workspace usage.
First, choose a Source type from the drop-down and then select the specific Data source you plan to use.
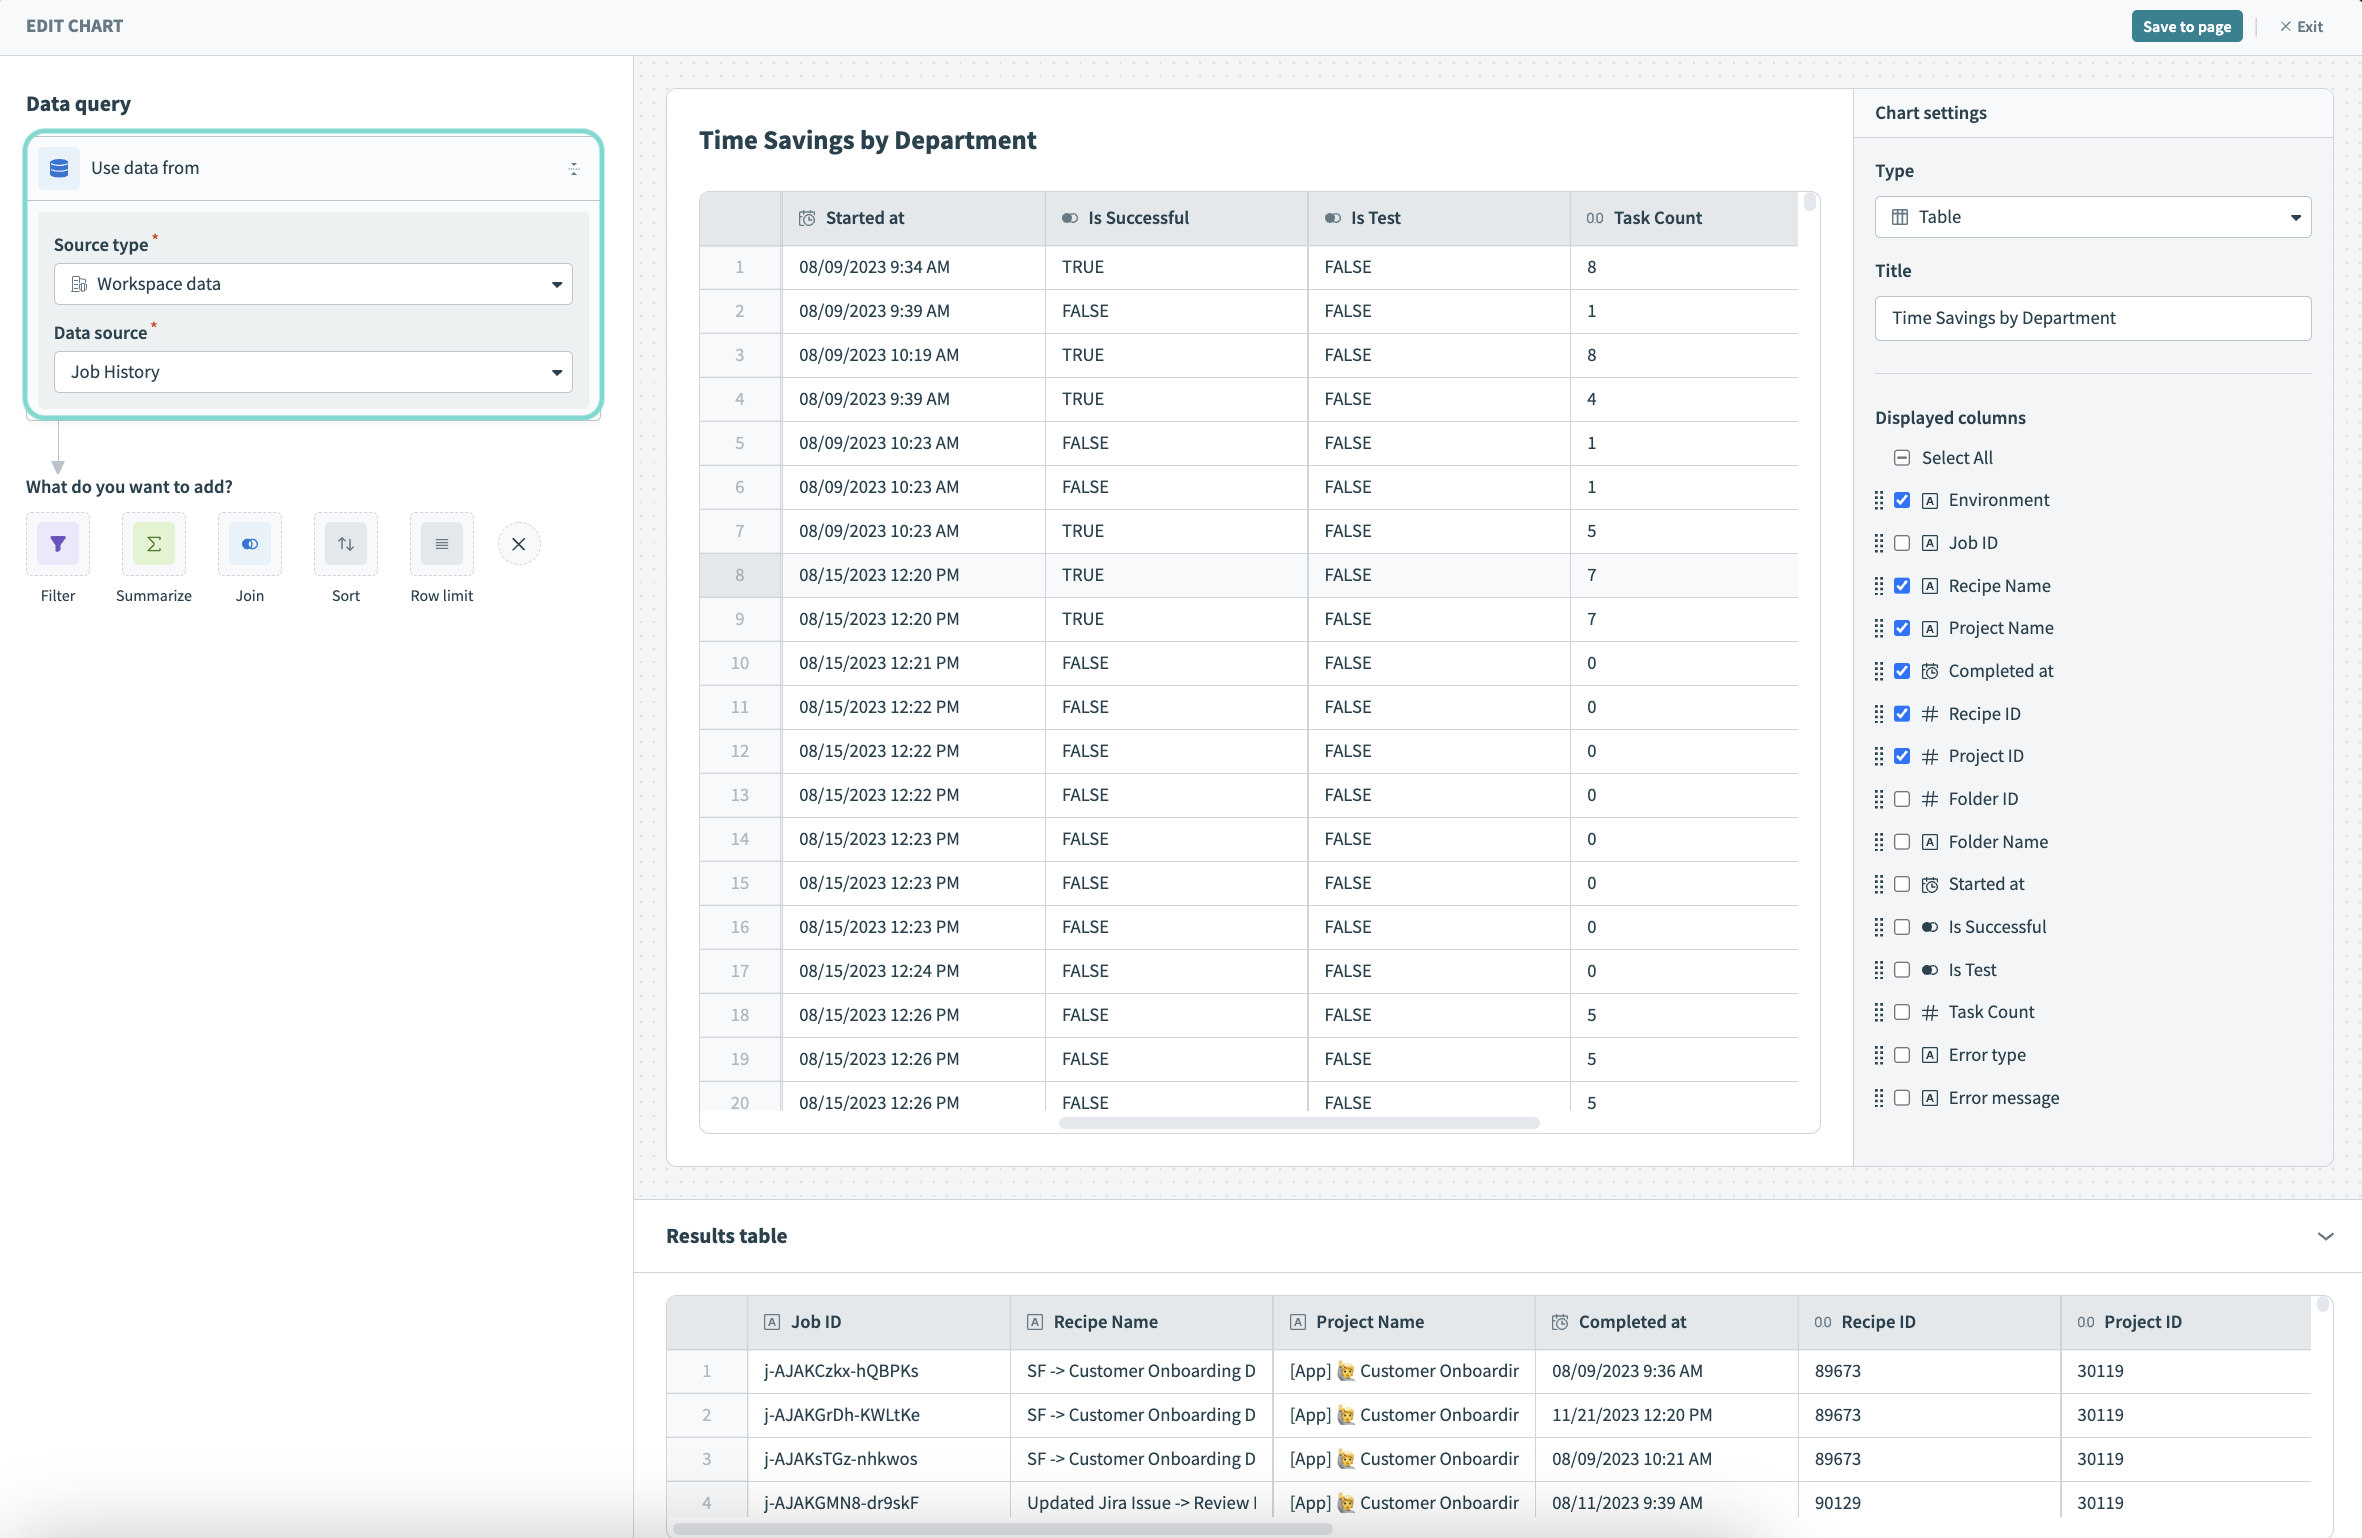 Select your data source
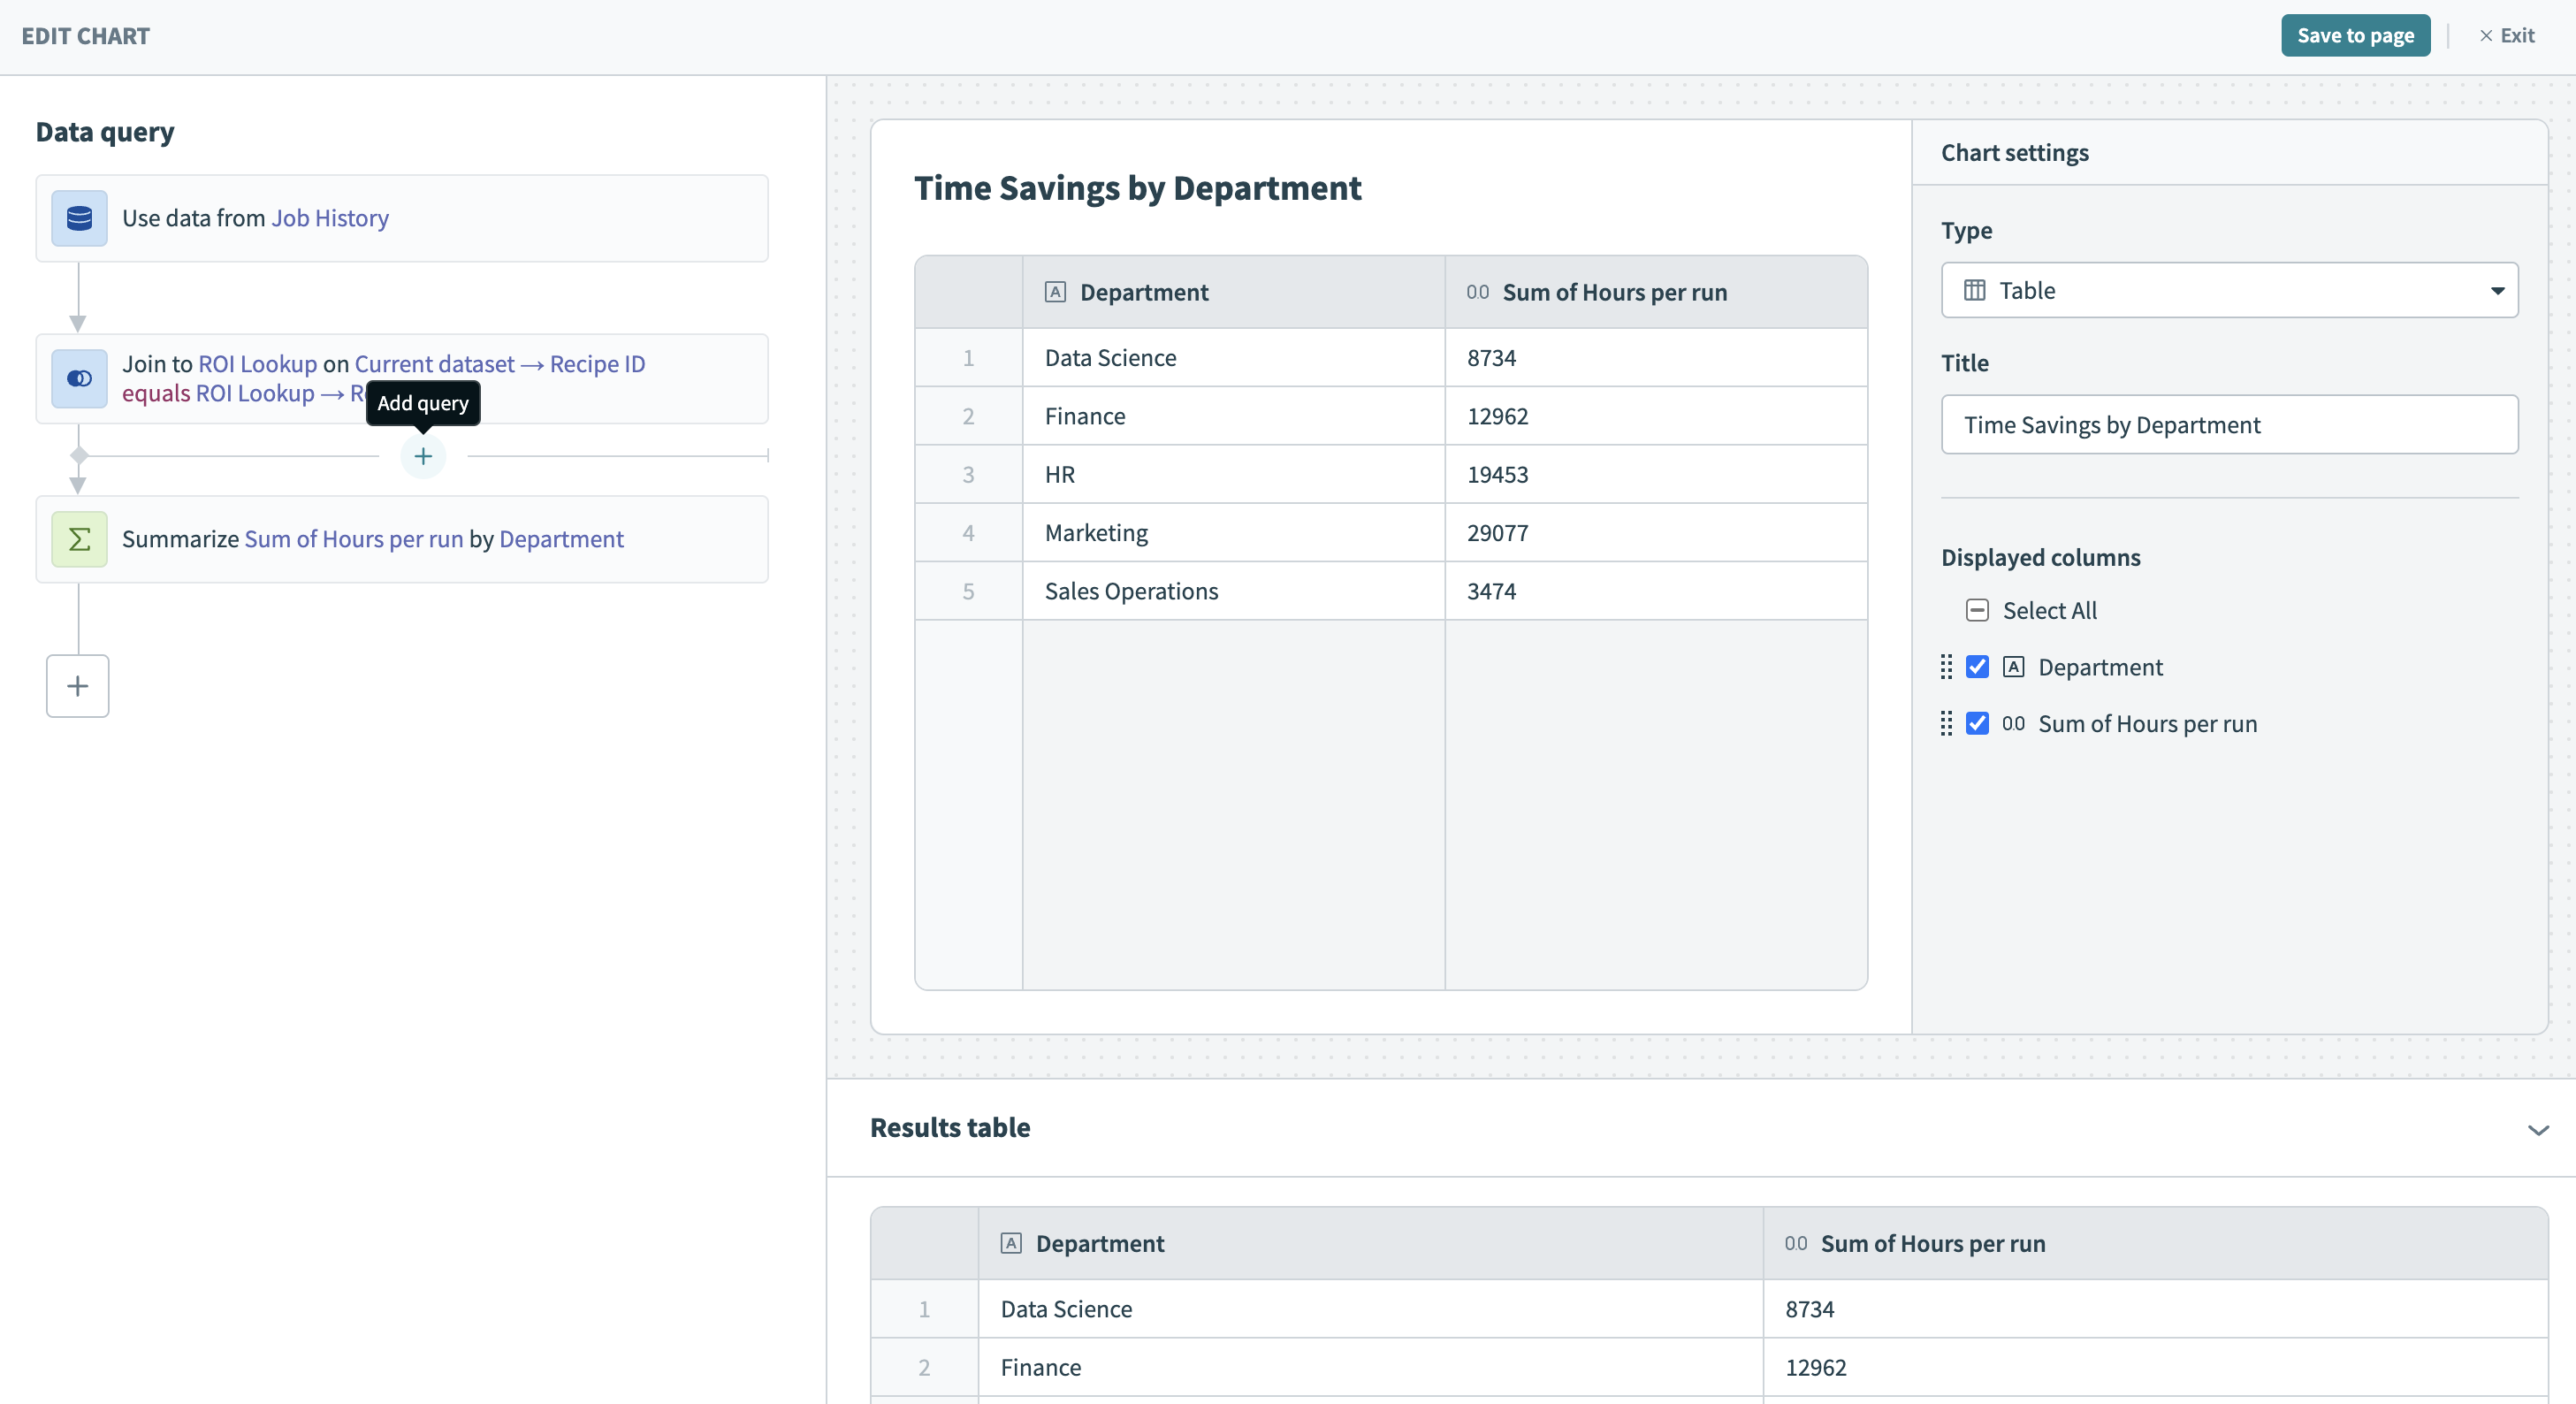
Transform your data: Filter, sort, summarize the data sets, join them with other data sources, and perform other transformations using a no-code query builder.
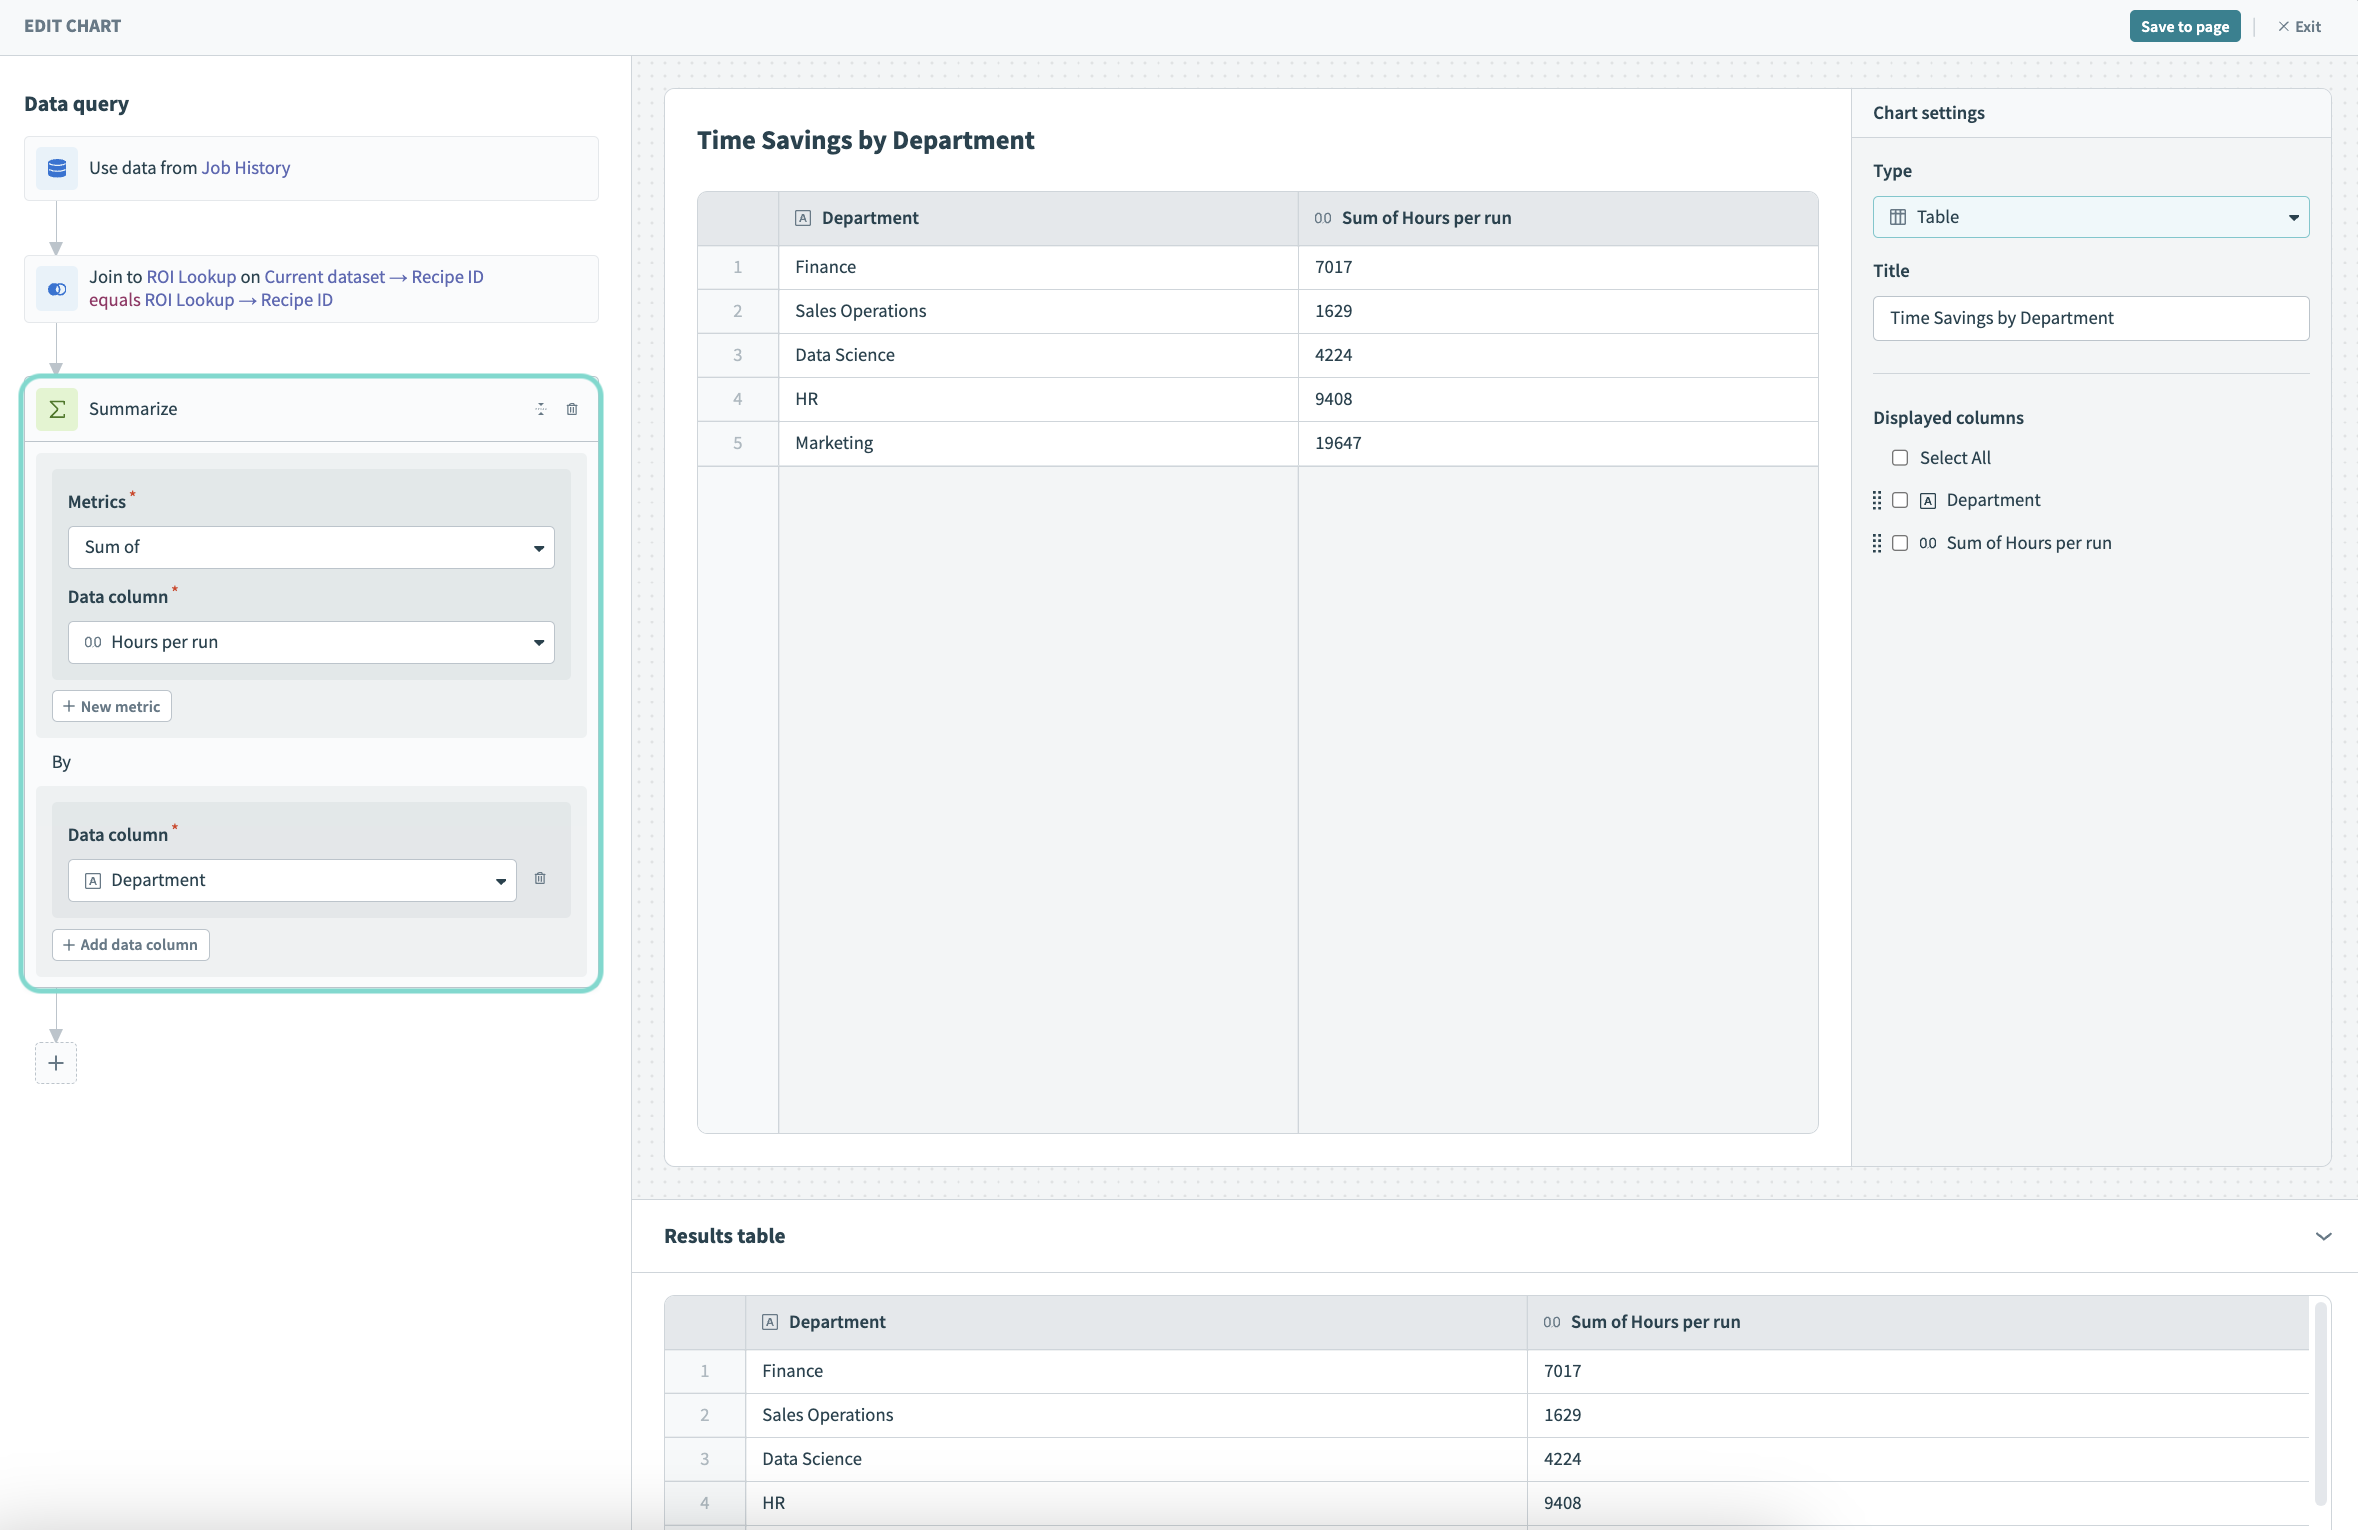 Perform queries on your data
In this example, we Join job history data to ROI data stored in a data table, and then Summarize the sum of hours per run and group the results by department.
To add a new transformation between existing queries, hover between them. Click Add query to insert your transformation.
 Add a query between existing queries
Visualize your data: Display your data as interactive charts and organize them in dashboards using a WYSIWYG (what-you-see-is-what-you-get) editor.
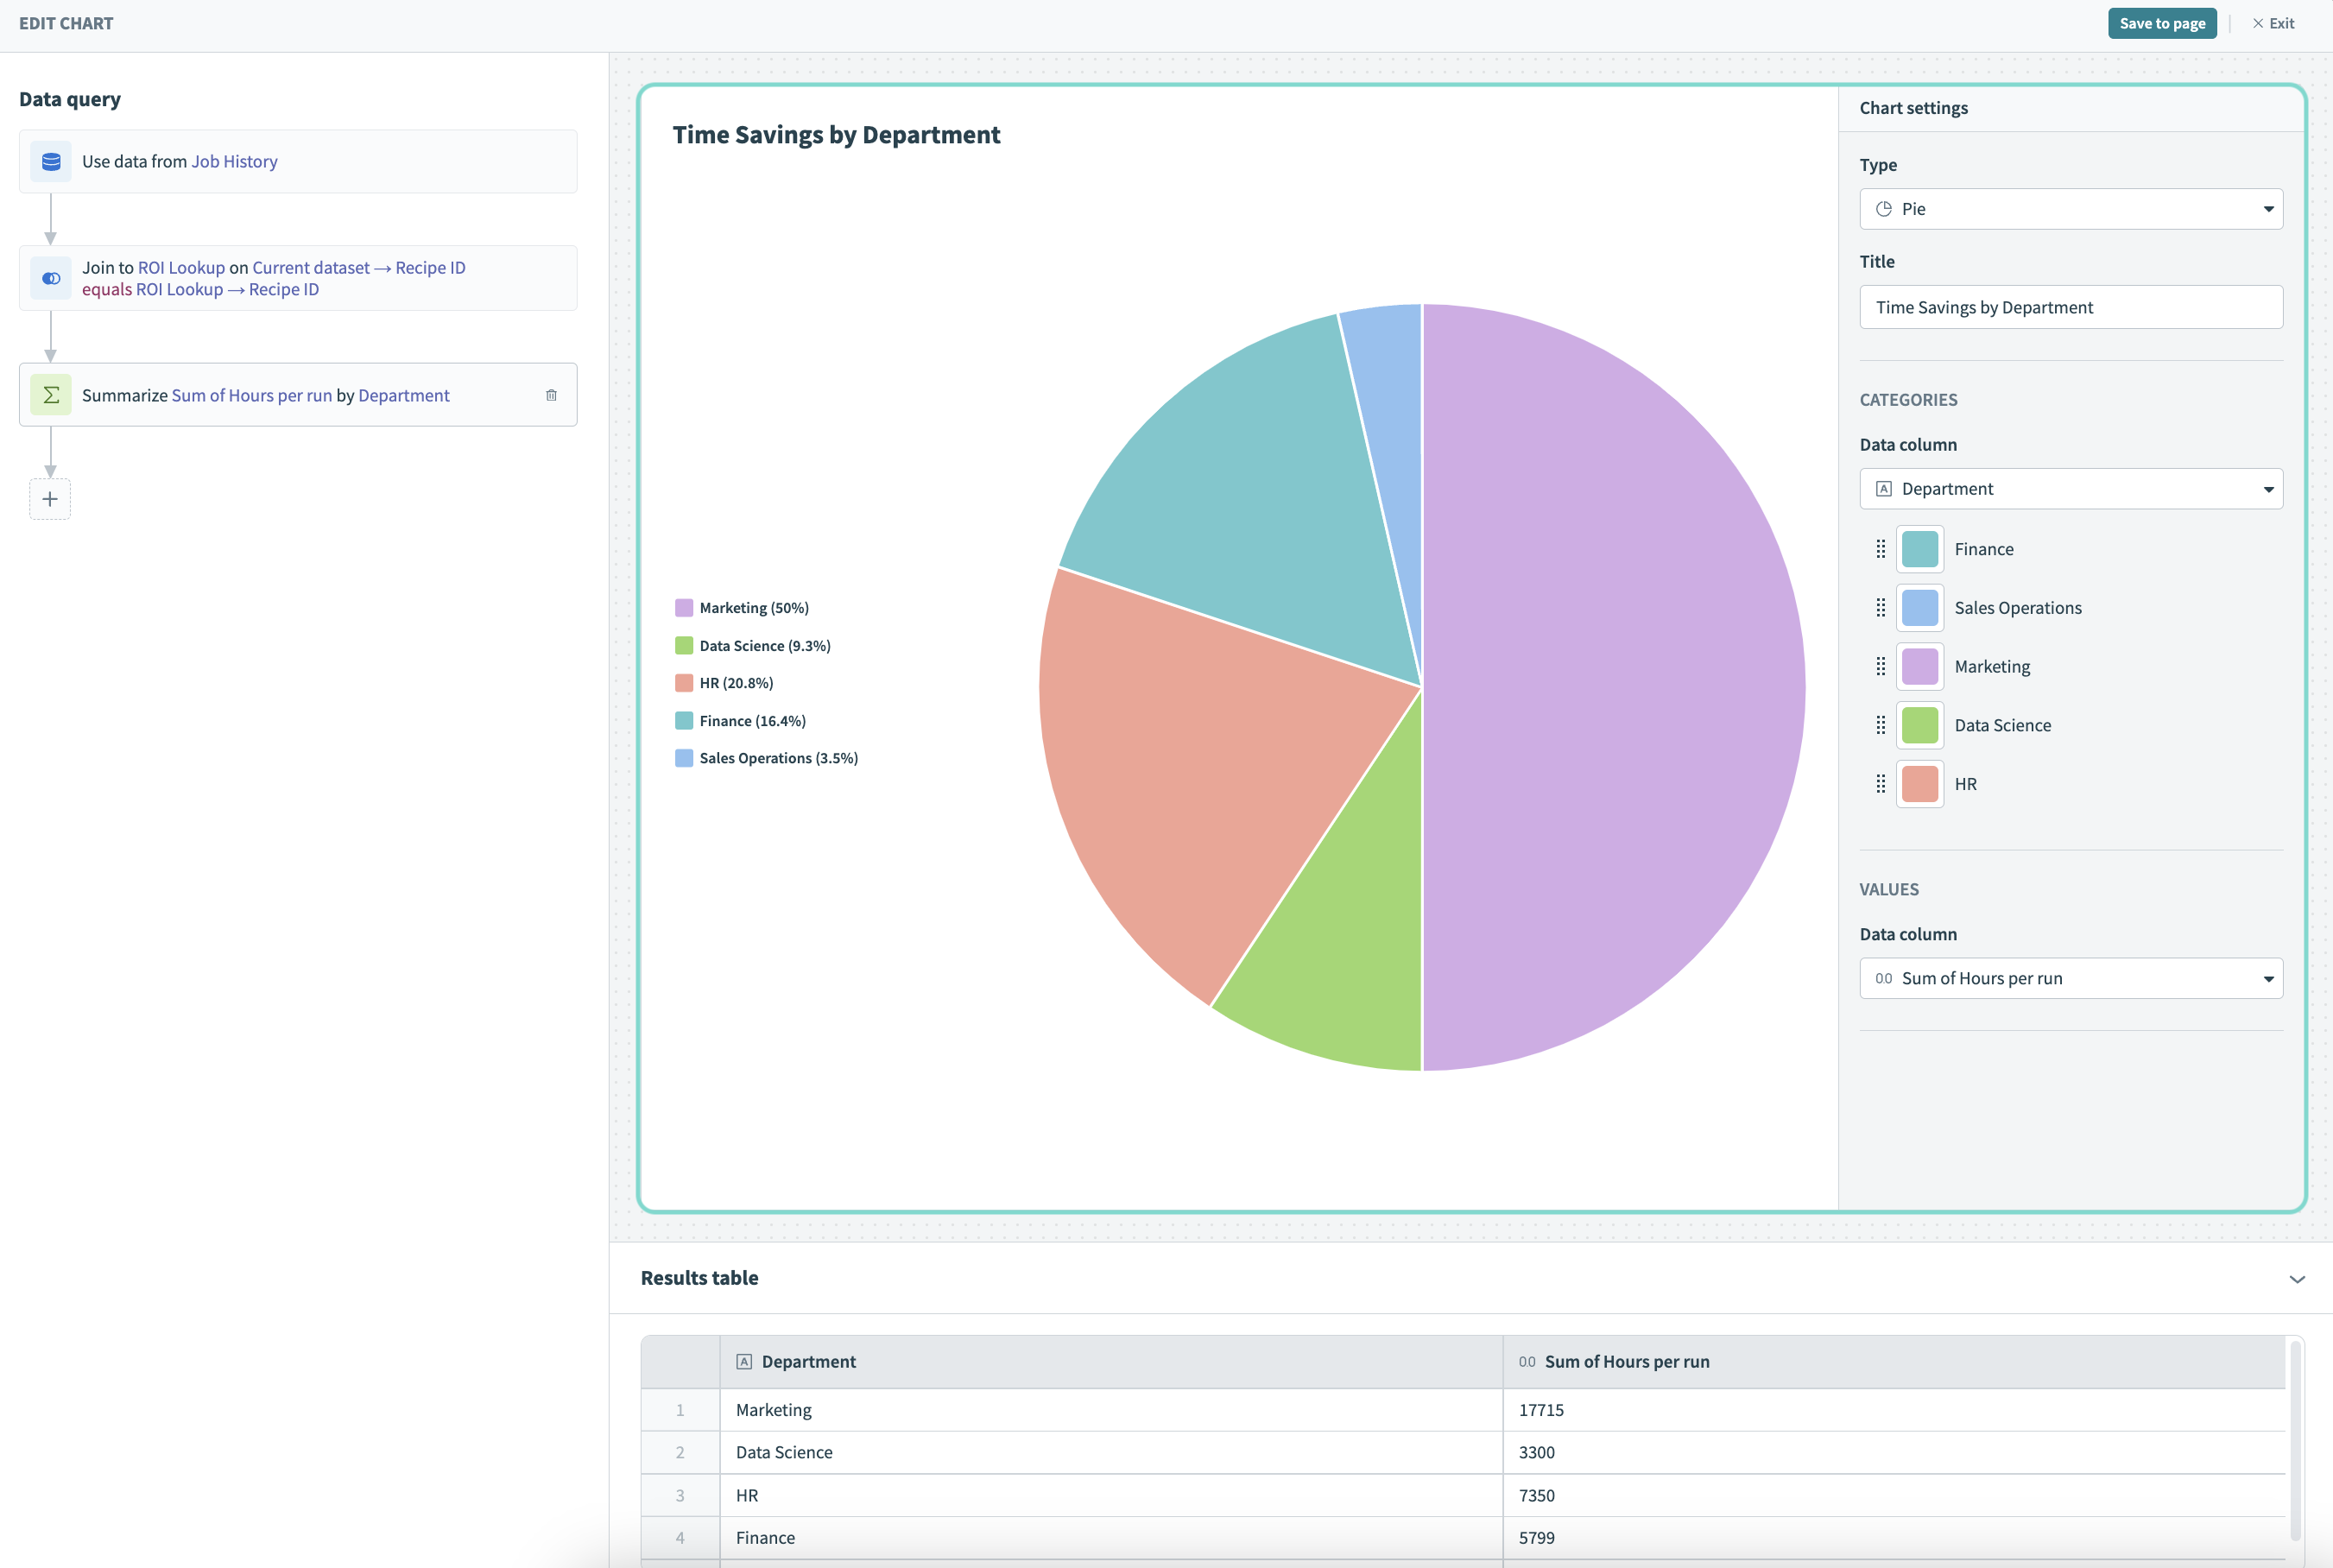 Visualize your data
FURTHER READING
Last updated: 12/20/2024, 6:06:00 PM